

Abstract
With its tunable band-gap and its unique optical and electronic properties black phosphorus (BP) opens exciting opportunities for optoelectronic nanotechnology. The band-gap extends from the visible to the mid-infrared spectral range, as a function of sample thickness and external parameters such as electric field and pressure. This, combined with the saturable absorption and in-plane anisotropic optical properties, makes BP a versatile platform for realizing polarization-sensitive photodetectors and absorbers. Although its near-equilibrium properties have been intensively studied, the development of efficient ultrafast optical devices requires detailed knowledge of the temporal dynamics of the photoexcited hot-carriers. Here we address the electronic response of BP to an ultrafast laser excitation, by means of time-and angle-resolved photoelectron spectroscopy. Following the optical excitation, we directly observe a shift of the valence band (VB) position, indicative of band-gap renormalization (BGR). Our data also show that the hole population in the VB relaxes with a characteristic time  ps, while the lifetime of the electrons accumulated at the minimum of the conduction band is
  ps. The experimental results are well reproduced by ab initio calculations of the out-of-equilibrium electronic properties. Our study sets the reference for the ultrafast carrier dynamics in BP and demonstrates the material's ultrafast BGR, which is promising for optoelectronic switches.
Export citation and abstract BibTeX RIS
Black phosphorus (BP), the most stable allotrope of elemental phosphorus, is a layered semiconductor. It recently experienced a resurgence of interest after exfoliation down to few layers was accomplished [1–4]. Among two-dimensional (2D) materials, BP combines the optoelectronic properties of gapless graphene [5] and of wide-gap transition metal dichalcogenides (TMDs) [6]. The charge mobility of bulk BP is comparable to that of graphene ( ) [7]. Even if it decreases by one-to-two orders of magnitude in an isolated monolayer [3, 8, 9], it still surpasses that of TMDs [10–13], which proved to be sufficient to realize field-effect transistors [2]. In contrast to TMDs, in the few-layers limit ambipolar charge transport can be achieved by gating, enabling the realization of p-n junctions [14]. Also, BP-based saturable absorbers have already been successfully implemented in lasers technology [15–17], and polarization-sensitive photodetectors have been designed to exploit its strong in-plane absorption dichroism [4, 18].
BP has an orthorhombic crystal structure, with space group Cmca (Nr. 64) and point group  [10]. The honeycomb layers are puckered as a consequence of the atomic sp3 hybridization, and form bilayers with armchair-shaped (along x) and zig-zag-shaped (along y ) modulations, shown in figure 1(a) [19]. The distortion leads to a sizeable in-plane asymmetry of the optical and electronic properties [20]. Besides this large anisotropy, the band-gap tunability of BP is the cornerstone for novel optoelectric devices. The experimental [21–23] (calculated [24–26]) band-gap of bulk crystals is 0.33 (0.44) eV. A much larger gap (∼2.0 eV) is found both experimentally [2] and theoretically [24] in monolayer samples ('phosphorene'). In multilayer thin-films the band-gap can be engineered to cover the mid- and near-infrared (IR) spectral region [8, 24, 27, 28], with applications in tunable photodetectors [29, 30], in photovoltaic solar cells [31] and in thermoelectric-power generators [32].
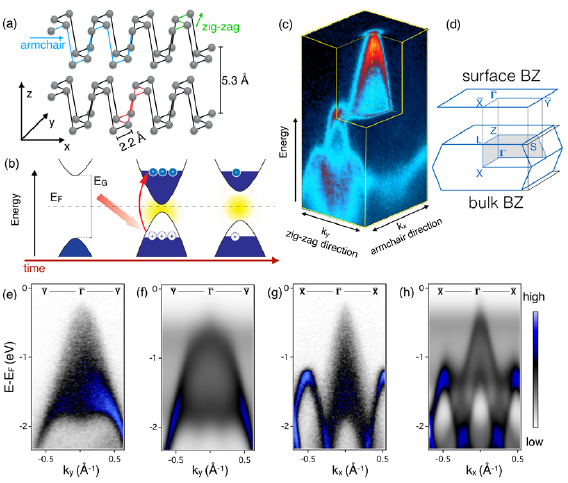
Figure 1. Crystal structure and band-gap renormalization (BGR) mechanism. (a) Crystal structure of BP. The unit cell contains two puckered bilayers [19]. The flat honeycomb structure is distorted with in-plane armchair and zig-zag modulations along the x and y directions, respectively. (b) Schematics of the BGR mechanism. Before optical excitation EF lies within the band-gap and the valence band (VB) is fully occupied (left panel). Upon optical excitation electrons are photoexcited in the conduction band (CB) and high-energy holes are left in the VB. These high-mobility charges are responsible for the band-gap reduction (central panel). The equilibrium bang-gap energy is recovered in time (right panel). (c) Electronic bands of BP measured at 40.8 eV photon energy. (d) Bulk and surface-projected Brillouin zone, with the high symmetry points. (e)–(h) Measured and calculated VB dispersion along the zig-zag ((e) and (f)) and armchair direction ((g) and (h)). The experimental data correspond to the  (e) and
  (g) directions of the SBZ, respectively. The calculated band structure is integrated over the wave vector kz perpendicular to the surface.
Download figure:
Standard image High-resolution imageWhile the steady-state conductivity is determined by the properties of the charges at the Fermi surface, the above applications require a detailed knowledge of the dynamics of the high-energy carriers created in the VB and in the CB by light absorption [33]. Here, we directly investigate these fundamental quantities by means of time- and angle-resolved photoelectron spectroscopy (tr-ARPES) with EUV pulses from a high harmonic generation (HHG) source. The combined momentum, energy and temporal resolution of tr-ARPES enable us to track changes in the band structure induced by an optical excitation with a 1.55 eV laser pulse. We determine the characteristic relaxation time of the holes generated near the VB maximum (VBM,  ) ps, as well as the lifetime of the electrons accumulated at the CB minimum (CBM,
  ) ps.
) ps.
The response of BP to the external optical excitation is more complex than just a variation of the occupancy of the VB and CB states. Namely, we observe a sudden change in the energy position of the VB, following the arrival of the pump pulse. Theoretical simulations of the band structure attribute this energy shift to an ultrafast BGR, as schematically illustrated in figure 1(b). The band-gap shrinks (central panel), and then relaxes back to equilibrium on a longer timescale (right panel). It is well known that the BP energy gap can be modified by external parameters, such as a static electric field [34–38], pressure [39–41], strain [26, 32, 42, 43] and the surface Stark effect upon alkali deposition [22, 23, 44–48]. Our findings demonstrate that optical excitation with laser light offers another way to tune the band-gap, which is potentially applicable to ultrafast optical devices.
The electronic structure of BP (figure 1(c)) measured by ARPES is consistent with earlier reports [2, 22]. The VBM is located in correspondence of the  point of the surface Brillouin zone (SBZ; figure 1(d)), where the dispersion is parabolic with different effective masses along the zig-zag (
 , figure 1(e)) and armchair direction (
 , figure 1(g)). Ab initio density functional (DFT) calculations for both directions are shown in figures 1(f) and (h), respectively. The DFT calculations were integrated over the kz wave vector to account for the intrinsic momentum broadening of ARPES along the surface normal. There is a remarkable agreement between the measured and calculated band dispersion. In the following we focus on the armchair direction, where one also observes sharp sidebands with maximum at a binding energy of 1.35 eV, located at
  .
.
Figure 2 illustrates the experimental observations of the BGR dynamics. Panel 2(a) shows temporal snapshots of the ARPES signal near the Fermi level EF, immediately before (−400 fs) and after (100 fs–400 fs) the optical excitation. The exact pump and probe overlap time, defining the experimental time zero, was determined by the laser assisted photoelectric effect (LAPE) with p-polarized pump (see supporting information (stacks.iop.org/TDM/6/031001/mmedia) [49, 50]). To minimize LAPE contributions to tr-ARPES spectra, all the data shown hereafter were measured with s-polarized optical excitation. At −400 fs (left panel), the VB is fully occupied. Following the arrival of the pump, electrons are removed from the VB and populate the low-energy part of the CB. This is better shown in figure 2(b), which displays EDCs at the  for each delay times. We observe a sudden increase of the intensity above the VBM and across EF, as well as an upward shift of the VB. This time-dependent shift indicates a change in the energy levels of the bands, and is a signature of the ultrafast BGR. Our theoretical calculations show that the BGR is the result of opposite energy shifts of VB and CB resulting from two combined mechanisms (see Supporting Information for more details). On the one hand, the photo-excited carriers alter the screening of the electron–electron Coulomb interaction. On the other hand, they reduce the final states available to scattering processes (Pauli blocking) [51, 52]. These mechanisms, common in the physics of 3D semiconductors [53, 54], are significantly enhanced in 2D materials, such as TMDs [47, 55–57]. An optically-induced BGR of ∼0.4 eV has been reported by tr-ARPES for a 2D
  /graphene heterostructure [56]. Phosphorene is expected to exhibit a large BGR, owing to its small density of states, compared to TMDs [58]. Our combined experimental and theoretical results reveal that an optically-induced BGR occurs also at the surface of bulk BP.
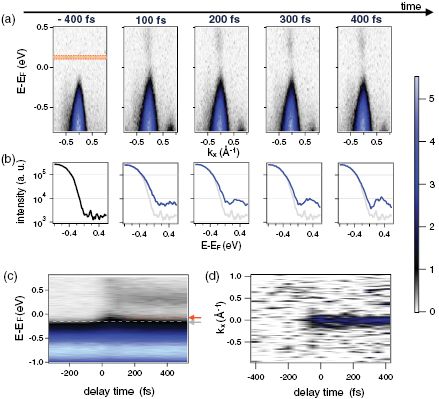
Figure 2. Out-of-equilibrium electron dynamics (a) snapshots of the band structure along the armchair direction at different delay times, after optical excitation with an absorbed fluence of ∼0.15 mJ cm−2. (b) EDCs extracted at the  point for the corresponding time delay. (c) Temporal evolution of the ARPES intensity integrated over a wave-vector window of
  0.1
0.1 centered at
  . The VBM shift is a signature of the BGR. The dashed white and orange lines, highlighted by the two arrows, indicate the VBM at −300 fs (white) and at +400 fs delay times (orange). (d) Temporal evolution of the ARPES intensity integrated in an energy window between 100 meV and 150 meV above EF (the orange band in (a)), showing photoexcited electrons in the CB.
Download figure:
Standard image High-resolution imageThe BGR dynamics is well illustrated by figure 2(c), which shows the temporal evolution of the energy-dependent ARPES intensity integrated over a wave-vector window of 
 around the
  point. A precise experimental determination of the VBM is difficult due to the aforementioned kz broadening. We estimate the time-dependent relative shift of the VBM by a standard procedure in semiconductor physics [59]. Namely, for each delay time, we linearly extrapolate the spectral leading edge to the baseline and take the intersection as a proxy for VBM, as in figure 3(a). The white dashed line in figure 2(c) indicates the position of VBM at −300 fs. During optical excitation (∼50 fs) we observe a shift to lower binding energy of the VB of approximately 60 meV, along with a broad distribution of excited electrons within the gap region. The dark orange dashed line indicates the VBM position at large positive delay time (400 fs). Figure 2(d) illustrates the temporal evolution of the ARPES intensity integrated over an energy window between 100 meV and 150 meV above EF, indicated by an orange band in figure 2(a). It shows that electrons accumulate at the bottom of CB upon optical excitation.
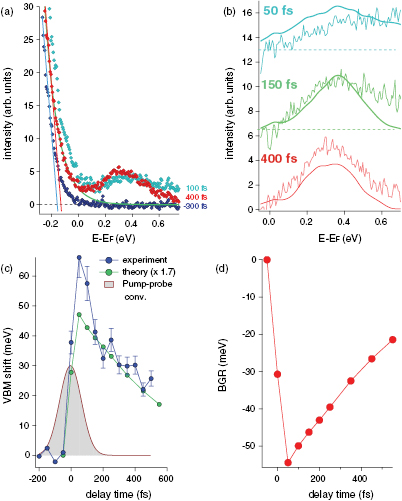
Figure 3. Ultrafast BGR: experiment and theory (a) energy distribution curves (EDCs) measured at the  point at −300 fs (blue markers), 100 fs (light blue markers) and 400 fs (red markers), extracted from the data of figure 2(b). The position of VBM is estimated as the baseline intercept of the linearly extrapolated spectral leading edge. Blue and red lines show the linear extrapolation of the VB intensity at −300 fs and 400 fs, respectively. The green line is an exponential fit of the tail of the 400 fs EDC. (b) Experimental (thin lines) and theoretical EDCs (thick lines) at
  point at 50 fs (light blue), 150 fs (green) and 400 fs (red) after subtraction of the high energy VB tail, in order to isolate the CB contribution. The curves are vertically offset for clarity. (c) Comparison between the temporal evolution of the VBM shift, as obtained experimentally (blue) and by ab initio calculations (green,
  to ease the comparison). The gray-area indicates the cross correlation between pump and probe pulses. (d) Calculated temporal dynamics of the BGR as estimated by theory.
Download figure:
Standard image High-resolution imageFigure 3 presents a quantitative comparison of the experimental and theoretical BGR. Figure 3(a) shows three EDCs measured at the  point, extracted from the data of figure 2(b), at −300 fs (blue markers), 100 fs (light blue markers) and 400 fs (red markers), respectively. A large increase in the spectral intensity within the original gap region is observed 100 fs after the arrival of the pump. Figure 3(b) compares experimental EDCs at the
  point for three delay times (50 fs (teal), 150 fs (green) and 400 fs (red)), with theoretical calculations (thin lines). The experimental data are plotted after subtracting an exponential function that fits the tail of the VB spectral intensity, as shown by the green line in figure 3(a) for the 400 fs EDC. The excitation of hot electrons at high energy in the CB is clearly visible at 50 fs, as a broad and structureless distribution. The simulations show that the deep CB valley around the bulk
  point accommodates most of the directly excited carriers (see supporting information). On a longer time scale, electron–electron scattering mediates the relaxation of the charges towards the CBM at the bulk
  point, where they accumulate. The remarkably good agreement between experimental and calculated line shapes at 250 fs and 400 fs indicates that the measured ARPES peak reflects the density of states of the CB. This population evolves at larger delay times due to electron–hole recombination with the VB. Additional experimental and theoretical details on the excitation and the following cascade process are provided in the supporting information. The unknown intrinsic line shape of the CB peak and the experimental energy and momentum broadening hamper a precise determination of the CBM. We find that a linear extrapolation to the baseline of the CB intensity underestimates the CBM energy. The comparison between theory and experiment suggests that the midpoint of the spectral rising edge is an upper boundary for the CBM energy. This criterion yields an overall value for the band-gap of 0.29 eV, at 400 fs delay time, to be compared with the experimental (calculated) equilibrium value of 0.33 [2, 47] (0.45 [21, 25]) eV.
Since we can only provide a rough estimate for the CBM value, we focus on the comparison between theory and experiment for the shift of VBM, shown in figure 3(c). We experimentally resolve a fast dynamics (blue line), which is not fully accounted for by our theory (green line). Similarly to the in-gap intensity previously discussed, this effect lasts only as long as the optical excitation. For an an absorbed fluence of 0.18 mJ cm−2 the calculated BGR is 20 meV (figure 3(c)), 1.7 times lower than the experimental one. This difference indicates that BGR must be influenced by other mechanisms. The intense electric field of the laser could be responsible for a Stark effect, lasting the duration of the optical excitation. This contribution is sizeable (30 meV for the electric field of our pump pulse Emax = 0.14 V nm−1 [36]), when the polarization of the pump is orthogonal to the sample surface. To the best of our knowledge, the effect of an in-plane electric field on the material band-gap has not been investigated. An additional, and potentially more relevant, term that is discussed in the literature is the asymmetric distribution of charge carriers within the BP unit cell. This effect is observed in conventional ARPES experiments following alkali metal deposition [22, 46, 48], whereby extra electrons populate the CB in the top-most surface layer [45]. The formation of a dipole is a general mechanism of band-gap engineering in van der Waals materials [60]. We speculate that a similar effect might be triggered by the photodoping induced by optical excitation, which results in an asymmetric charge distribution within the BP unit cell, and the formation of a transient local dipole. More sophisticated out-of-equilibrium calculations that include an external electric field and spatially asymmetric carrier distribution are needed to clarify the origin of the larger experimental BGR.
Figure 3(d) shows the total calculated BGR dynamics, with a maximum BGR of ∼ meV. Our theory predicts that the optically induced BGR can reach a value as high as 400 meV for a fluence of 1 mJ cm−2, as discussed in the supporting information. This value does not exclude the possibility to achieve band inversion via optical excitation. The threshold fluence, however occurs in a regime of strong non-linear effects.
In figure 4, we analyze the hot carrier population dynamics. The BGR is not the only process governing the properties of optically excited BP. Optical absorption leaves high-energy holes in the VB and electrons in the CB. We assess the electron dynamics by tracking the evolution of the integrated ARPES intensity at the CBM (yellow rectangle), where the broad energy window ensures that the observed band shift does not affect the result. For the hole dynamics we focus on the top of the VB sideband (green rectangle), where we take advantage of a sharper line shape compared to that of VB at  . Figures 4(b) and (c) show the temporal evolution of the carrier population in the CB and in the VB. The dynamics of both signals are well reproduced by a double decaying exponential function. The fast decay component, the same for the VB and CB, is limited by our temporal resolution,
  ps. We tentatively associate this timescale to the action of the electric field of the pump, as previously discussed for the shift of the VBM. This fast dynamics is followed by a slower decay with characteristic times
  ps and
  ps, which we attribute to the effective charge carriers relaxation times. The difference in the dynamics observed in CB and VB implies that the electron–hole-recombination cannot be the only relaxation mechanism. Other effects can play a role, such as diffusion from the surface to the bulk with different electron and hole effective masses, as well as carrier multiplication dynamics in the VB. Moreover, due to the
  broadening discussed in figure 1, our results average contributions from different kz values. Additional experiments as a function of the probe photon energy might give insight in the scattering mechanisms along the direction orthogonal to the surface. All those effect will require further investigation in order to address the charge dynamics in BP from the microscopic point of view.

Figure 4. Charge carriers dynamics (a) ARPES image of the BP band structure measured along the armchair direction before optical excitation. Yellow and green rectangles indicate the integration areas for the CB and VB, respectively. (b) and (c) Temporal evolution of the integrated ARPES intensity, for a pump fluence of 0.15 mJ cm−2. The carrier dynamics are fit by a double decaying exponential function, with a common fast component  ps, and a slower decay with characteristic times
  ps and
  ps.
ps.
Download figure:
Standard image High-resolution image
We can compare our findings with the characteristic times reported from all-optical experiments, which provide a momentum-integrated picture. Several timescales have been observed, from few tens of fs [61], extending to the  ps range [62, 63], and up to several hundreds ps [64, 65]. The shortest timescale reflects electronic scattering processes [61]. Electron–electron scattering is responsible for the intraband scattering and the hot-carriers thermalization, and it drives the accumulation of electrons at the CBM observed in our tr-ARPES experiment (see supporting information for details). The longest timescale, exceeding our investigated temporal window, is generally ascribed to the in-plane diffusion of carriers [65] and to the cooling of the lattice [64]. The origin of the intermediate timescale is more uncertain, and several processes have been invoked, such as carrier-phonon scattering [62] and interband scattering [63, 66]. The direct view of the charge dynamics provided by our tr-ARPES study clarifies the underlying physical mechanisms. We clearly resolve two different dynamics in the ps regime:
  ps defines the relaxation of the optically induced BGR, while the estimated
  ps and
  ps provide a measure of the lifetimes of the excited electron and hole populations.
In summary, we have investigated the electronic properties of photoexcited BP by means of tr-ARPES combined with ab initio calculations of the out-of-equilibrium band structure. We report a transient BGR, which is a consequence of the combined action of the change in Coulomb-interaction screening caused by the optically excited carriers, of the Pauli blocking of selected regions of the BZ and, at very short times, of the anisotropic charge distribution within the BP unit cell combined with the intense electric field of the pump pulse (Stark effect). The BGR manifests itself as a shift of the VB maximum, which is qualitatively captured by our calculations. From the tr-ARPES data we extract the charge dynamics, and find a characteristic time five times slower in the valence than in the CB. Our findings demonstrate that the BP band-gap can be modified by the coupling with intense light pulses. They also provide a direct view of the hot carrier dynamics in BP, a key property for novel optoelectronics devices with enhanced performances.
Methods
Experimental setup
All experiments were carried out at the EPFL LACUS, at the ASTRA end station [67] of the Harmonium beamline [68]. A Ti:Sa Wyvern (KM labs) amplifier operating at 6 KHz provides 50 fs pulses centered at 800 nm. The HHG, with s-polarization, were produced in an Ar jet, and a single harmonic at 37 eV was selected by a conical grating with 900 gr mm−1 [69]. The pump polarization is controlled by using a  waveplate. All tr-ARPES measurement were carried out at 80 K, with an overall temporal resolution of 200 fs, an energy resolution of 130 meV and an angular resolution of 0.3°. Static ARPES measurements were performed at 80 K with a He discharge lamp (Gammadata VUV 5000) whose HeII
  line at 40.8 eV is selected with a monochromator (Gammadata Burklint AB, Sweden). The samples were acquired from hq Graphene Groningen, Netherlands, and cleaved with a scotch tape in UHV at a base pressure below
  mbar.
mbar.
First-principles simulations
We use the quantum-espresso suite [70] to compute the equilibrium properties of BP. We first perform a density-functional-theory calculation of the structural and electronic properties. We use the Perdew–Burke–Ernzenhof (PBE) approximation for the exchange-correlation functional. The BP eigenvalues and wave-functions are calculated by using a 90 Ry plane-waves energy cutoff and a 
 -point mesh for the Brillouin zone sampling. We then consider ten valence and conduction bands to describe the carrier dynamics. Electron–phonon matrix elements are computed within density-functional-perturbation-theory. The real-time simulation is performed with the Yambo code [71]. The density matrix is propagated in time by solving its equation of motion based on the Kadanoff–Baym equation, within the generalized Kadanoff Baym ansatz [72, 73]. The equation of motion for the density matrix is projected on the twenty bands
  . The real-time simulation adopts a coarse
  and a denser randomly generated grid of 500
  -points. The actual simulation is performed on the denser grid with matrix-elements and density matrix interpolated (by using a nearest neighbor technique) from the coarse grid. The experimental pump pulse is simulated by using a narrow band pump laser pulse characterized by the experimental frequency, intensity and width. The screened-exchange SEX approximation guarantees that the pump is correctly absorbed [74]. Finally we monitor the diagonal elements of the density matrix which describe the occupations on the band structure,
  .
.
Acknowledgment
We acknowledge financial support by the Swiss National Science Foundation (SNSF), via the NCCR:MUST and the contracts No. 206021-157773, and 407040-154056 (PNR 70), the European Research Council Advanced Grant H2020 ERCEA 695197 DYNAMOX. AM acknowledges support by the European Union project MaX Materials design at the eXascale H2020-EINFRA-2015-1, Grant agreement n. 676598, H2020-INFRAEDI-2018-1 Grant agreement n. 824143 and Nanoscience Foundries and Fine Analysis—Europe H2020-INFRAIA-2014-2015, Grant agreement n. 654360.
Author contributions
SR carried out the data analysis and performed the experiments with the support of GG, DB, IG and MP. AC conceived the experiment and wrote the manuscript with strong support of SR and MG. MP and TRB were responsible for the HHG generation. CAA, FF and LP designed and developed the HHG generation and the Harmonium beam lines. AM performed all theoretical calculations and contributed to the physical interpretation and the manuscript preparation. All authors contributed to discussions and to the revisions of the manuscript.