
Abstract
Recently, the up-converting (UC) materials, containing lanthanide ions (Ln3+)have attracted considerable attention because of the multitude of their potential applications. The most frequently investigated are UC systems based on the absorption of near-infrared (NIR) radiation by Yb3+ ions at around 975–980 nm and emission of co-dopants, usually Ho3+, Er3+ or Tm3+ ions. UC can be observed also upon excitation with irradiation with a wavelength different than around 980 nm. The most often studied systems capable of UC without the use of Yb3+ ion are those based on the properties of Er3+ ions, which show luminescence resulting from the excitation at 808 or 1532 nm. However, also other Ln3+ ions are worth attention. Herein, we focus on the investigation of the UC phenomenon in the materials doped with Ho3+ ions, which reveal unique optical properties upon the NIR irradiation. The SrF2 NPs doped with Ho3+ ions in concentrations from 4.9% to 22.5%, were synthesized by using the hydrothermal method. The structural and optical characteristics of the obtained SrF2:Ho3+ NPs are presented. The prepared samples had crystalline structure, were built of NPs of round shapes and their sizes ranged from 16.4 to 82.3 nm. The NPs formed stable colloids in water. Under 1156 nm excitation, SrF2:Ho3+ NPs showed intense UC emission, wherein the brightest luminescence was recorded for the SrF2:10.0%Ho3+ compound. The analysis of the measured lifetime profiles and dependencies of the integral luminescence intensities on the laser energy allowed proposing the mechanism, responsible for the observed UC emission. It is worth mentioning that the described SrF2:Ho3+ samples are one of the first materials for which the UC luminescence induced by 1156 nm excitation was obtained.
Export citation and abstract BibTeX RIS

Original content from this work may be used under the terms of the Creative Commons Attribution 4.0 licence. Any further distribution of this work must maintain attribution to the author(s) and the title of the work, journal citation and DOI.
1. Introduction
The up-conversion (UC) phenomenon, which is a process of conversion of the low-energy photons, to the high-energy ones, usually from the near-infrared (NIR) to the ultraviolet (UV) or visible (vis) range [1], has been intensively investigated in the last years, mainly because of its many applications. Materials, which contain lanthanide (Ln3+) ions have attracted considerable attention because of their ability to exhibit the UC phenomenon. Their unique properties, following from the 4f electronic structure imply the presence of many well-defined energy levels and usually, a large energy difference between the excitation and emission maximum and their emission spectra are characterized by multiple narrow bands with maxima covering a wide spectral range [2]. Therefore, the UC systems based on the properties of Ln3+ ions have been or are planned to be used in solar cells [3], lasers [4], displays [5], temperature or pressure sensors [6, 7], fingerprint detectors [8] and security markers [9]. Moreover, the increasing interest in nanotechnology has opened new applications of the up-converting nanoparticles (NPs) based on the Ln3+ ions, particularly in medicine for phototherapy [10], theranostics and cancer treatment [11], bioimaging [12], drug delivery [10, 12] and biomarkers [13].
Nowadays, one of the most widely studied are UC materials containing Er3+ ions because of the bright [14], multicolor luminescence [15] of these ions excited by different wavelengths [16] with relatively high values of quantum yields (QY) [17]. The systems that contain Er3+ ions are often additionally doped with Yb3+ ions to improve the UC emission efficiency [18, 19]. Then the Er3+ ions, which act as activators, receive energy from the Yb3+ ions, playing a role of sensitizers absorbing energy in the 900–1000 nm range via the 2F7/2 → 2F5/2 Yb3+ transition [7]. Furthermore, there are also compounds, in which Er3+ ions can transfer energy to the other Ln3+ ions: Eu3+, Dy3+, Ho3+ or Tm3+ ones [20–22], which allows obtaining e.g. tunable luminescence color.
The materials containing Ho3+ ions have been shown to reveal interesting properties that have not been fully investigated as yet. Most reports concerning these materials have been focused on their magnetic properties related to the high magnetic permeability of holmium [23]. The systems containing Ho3+ ions are also able to show UC phenomenon, which may be caused by the irradiation at four different wavelengths from the NIR range: around 755, 900, 1150 and 1950 nm, corresponding to the energy transitions from the 5I4, 5I5, 5I6 and 5I7 excited states, to the 5I8 ground state, respectively [24]. The described optical properties of Ho3+-doped compounds are commonly used in the production of NIR lasers [4, 25, 26], but they have a great potential for medical applications because of their ability to absorb or emit energy in the range of the 1st or 2nd biological windows [27].
The majority of reports on the UC luminescence of Ho3+-doped materials have been focused on the materials co-doped with Yb3+ ions, capable of emission upon irradiation at around 980 nm [28–30]. Moreover, the UC emission of Ho3+ and Yb3+ co-doped systems upon excitation with ∼ 1150 nm has been the subject of a few reports [31, 32]. However, a few authors have been concerned with the UC luminescence of the compounds containing Ho3+ ions only, obtained by irradiation with a NIR wavelength around 755 [33–36], 900 [33, 37–39], 980 [35, 40, 41], 1150 [4, 39, 42] and 1950 [25, 26, 43–45] nm or by dual-wavelength excitation (1150 and 980 nm) [46, 47] as well as by sunlight [3].
In this paper we present the properties of new up-converting nanomaterials, i.e. strontium fluorides doped with Ho3+ ions only. SrF2 was chosen a host compound because of its low phonon energy (286 cm–1) [48], which reduces the non-radiative luminescence quenching processes, and transparency in a wide wavelengths range, good thermal stability, and high conductivity [49]. The Ho3+ ions were chosen as the Ln3+ dopants responsible for the optical properties, endowing the prepared materials with unique spectroscopic properties, which permitted investigating their UC luminescence. SrF2:Ho3+ samples were synthesized by a simple, safe, and environment-friendly hydrothermal method [16] and were composed of small size NPs. The 1156 nm radiation resulted in the intense red UC luminescence of the obtained NPs. The mechanism causing the luminescence was proposed based on the analysis of the lifetime profiles and dependencies of the energy transitions intensities on the laser energy.
2. Experimental
2.1. Materials
Holmium oxide (Ho2O3) (99.99%, Stanford Materials, United States) was dissolved in hydrochloric acid (HCl) (ultra-pure, POCh S.A., Poland) to obtain a 1 M solution of holmium chloride (HoCl3), which was used as a source of Ho3+ ions. Strontium chloride hexahydrate (SrCl2·6H2O) (≥99%, Acros Organics, Poland) and ammonium fluoride (NH4F) (≥98%, Sigma Aldrich, Poland) were used as the sources of the Sr2+ and F– ions, respectively. Trisodium citrate dihydrate (NaCit·2H2O) (≥97%, Sigma Aldrich, Poland) was added to the reaction mixture as the capping agent. All the substrates were used as received, without further purification. The reaction was carried out in deionized water. A mixture of ethanol (99.8% POCh S.A., Poland) and deionized water (1:1), was used to purify the obtained products.
2.2. Synthesis procedure
To obtain SrF2:xHo3+ (x = 5, 7.5, 10, 15, 20 or 25%) NPs, 5 ml SrCl2 and HoCl3 solutions containing in total 3.5 mmol Sr2+ and Ho3+ ions (SrCl2: 3.325, 3.238, 3.150, 2.975, 2.800, and 2.625 mmol, and HoCl3: 0.175, 0.262, 0.350, 0.525, 0.700, and 0.875 mmol) were prepared. Next, 20 ml of the 1 M NaCit solution was added to each mixture containing Sr2+ and Ho3+ ions and mixed for 1 h, and then, 5 ml of the 2 M NH4F solution (1.5 excess in comparison to the stoichiometric amount) was added dropwise to each mixture and mixed for the following 15 min. The pH of the final mixtures ranged from 6.84 to 6.13 (the pH value decreased with increasing concentration of Ho3+ ions). The as-prepared mixtures were transferred into a 50 ml Teflon vessel and hydrothermally treated at 200°C for 12 h (Berghof DAB-2). The post-reaction mixtures were centrifuged (10 min, 9000 rpm), and the precipitates were purified three times (ethanol, mixture of ethanol and deionized water, and deionized water) by dissolution and centrifugation (5 min, 9000 rpm). The obtained products were dissolved in deionized water or dried in a desiccator for 12 h.
2.3. Characterization
The compositions of the synthesized SrF2:Ho3+ samples were established by energy-dispersive x-ray spectroscopy (EDXS) on the high-resolution environment scanning electron microscope (SEM) Quanta 250 FEG, FEI (resolution: 124.2 eV, amplification time: 3.84 μs). The synthesized samples were identified using Fourier transform infrared spectra (FT-IR) spectrophotometer JASCO 4200. The crystalline structures of the obtained products were analyzed with help of x-ray powder diffraction (XRD) measurements on a Bruker AXS D8 Advance Diffractometer equipped with a Johansson monochromator (λCu Kα1 = 1.5406 Å) and a LynxEye strip detector (step: 0.05° 2θ, step time: 1 s, angular range: 20–100°2θ). The reference data were taken from the Inorganic Crystal Structure Database (ICSD). Hydrodynamic sizes of the prepared nanoparticles were determined by the Dynamic Light Scattering (DLS) method and zeta potential measurements using a Malvern Zetasizer Nano ZS instrument. The images of the samples, used for determination of the average sizes and size distributions, were recorded on the high-resolution transmission electron microscope Hitachi HT7700 with an accelerating voltage of 120 kV.
The spectroscopic properties of SrF2:Ho3+ NPs was characterized with the use of a QuantaMasterTM 40 spectrophotometer equipped with an Opolette 355LD UVDM tunable laser (with a repetition rate of 20 Hz) and a PIXIS:256E digital CCD camera with an SP-2156 imaging spectrograph (Princeton Instruments) (emission spectra) or Hamamatsu R928 photomultiplier (excitation spectrum) used as the detectors. The dependencies of the energy transitions intensities on the laser energy were measured using neutral filters which modified the laser energy The luminescence rise and decay lifetimes were recorded with a Mixed Domain Oscilloscope − 200 MHz - Tektronix MDO3022. The luminescence characteristics were measured at room temperature for solid SrF2:Ho3+ samples (powders).
3. Results and discussion
3.1. Structural and morphological properties
The concentrations of the Ho3+ ions in the prepared SrF2:Ho3+ samples were similar to the intended ones (table 1). However, slight differences in the composition were observed for highly doped products (Ho3+ ions concentration: ≥15%), which were characterized by a lower concentration of dopant ions than assumed. These differences are probably related to the nature of the synthesis, during which the complexes of Sr2+ and Ho3+ cations and citrate C3H5(COO)3 3- anions, present in the reaction mixture, are formed. The Sr2+-Cit3– complexes (K = 6.6·10–3 [50]) are less stable than the Ho3+-Cit3– ones (K = 5.9·10–7 [51]), therefore in the reaction medium the concentrations of free Sr2+ and Ho3+ ions is not necessary the same as the overall ones, including also chelated ions. As a result, the obtained samples are characterized by a smaller admixture of Ho3+ ions than intended [52].
Table 1. SrF2:Ho3+ sample composition based on EDXS measurements and comparison of nanoparticle sizes calculated using different methods.
| Dopant Ho3+ ion concentration [%] | NPs diameters [nm] | |||
|---|---|---|---|---|
| Nominal | Determined | Evaluated based on the Scherrer equation | Calculated from TEM images | Measured by DLS method (hydrodynamic) |
| 5.0 | 4.9 ± 0.2 | 61.2 | 82.3 ± 23.2 | 127.8 ± 44.2 |
| 7.5 | 7.1 ± 0.1 | 48.1 | 98.0 ± 30.3 | |
| 10.0 | 10.0 ± 0.1 | 45.9 | 49.9 ± 11.4 | 88.8 ± 28.9 |
| 15.0 | 14.1 ± 0.1 | 30.4 | 73.9 ± 25.1 | |
| 20.0 | 18.7 ± 0.1 | 21.5 | 18.6 ± 4.0 | 46.3 ± 12.3 |
| 25.0 | 22.5 ± 0.3 | 18.4 | 41.4 ± 11.7 | |
For the subsequent SrF2:Ho3+ samples, the average hydrodynamic diameters decreased (table 1), and ranged from 127.8 nm for the SrF2:4.9%Ho3+ sample to 41.1 nm for the SrF2:22.5%Ho3+ sample. The observed effect of decreasing the hydrodynamic sizes of the obtained particles was caused by the decrease in unit cell parameters, connected with the increasing substitution of the larger Sr2+ ions ( = 1.18 Å) by the smaller Ho3+ ions (
 = 0.90 Å) in the particle structures of the subsequent SrF2:Ho3+ samples [53]. Also another effect could be responsible for decreasing size of NPs with growing amount of Ho3+ ions. As mentioned before, higher stability of Ho3+-Cit3– complexes than Sr2+-Cit3– ones affected the precipitation reaction kinetics, as there is lower total concentration of not-complexed Sr2+ and Ho3+ ions, with growing total amount of Ho3+ (including free and complexed ions) in the reaction medium. The number of nucleation seeds is therefore higher, resulting in smaller NPs' sizes.
The prepared SrF2:Ho3+ samples exhibited negative surface charge, which suggests the presence of residual citrate anions on their surfaces (see EDXS results in figure S1(available online at stacks.iop.org/MAF/10/024001/mmedia)). The presence of Cit3– groups on NPs surface was confirmed by the results of the FT-IT measurements (figure S3). The determined zeta potentials took values from –22.9 mV for the sample doped with the lowest content of Ho3+ ions to –13.8 mV for the highest doped in the Ho3+ ions sample. These results indicate good stability of the low-doped SrF2:Ho3+ samples in water, but a growing tendency of highly-doped SrF2Ho3+ NPs to agglomerate, which is a consequence of their smaller sizes and increased specific surface area [6].
The obtained SrF2:Ho3+ samples showed the crystalline single-phase structures, with the  space group (figure 1(a)). In the recorded XRD patterns, a shift of the diffraction peaks towards higher 2θ angles in comparison to the reference pattern (SrF2 ICSD #40414) was observed, especially noti-ceable for the higher-doped samples. As mentioned before, the effect was due to a decrease in the unit cell parameters, resulted from substitution of the larger Sr2+ by the smaller Ho3+ ions in the crystals structure. (Table S1). The size of the obtained crystallites were determined from the Scherrer's equation [54] and ranged from 61.2 nm (SrF2:4.9%Ho3+) to 18.4 nm (SrF2:22.5%Ho3+) (table 1).
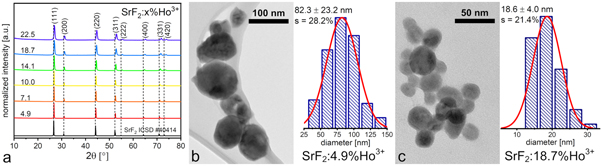
Figure 1. XRD patterns of SrF2 NPs doped with various amounts of Ho3+ ions (a), TEM images with the corresponding size distributions histograms of SrF2:4.9%Ho3+ (b) and SrF2:18.7%Ho3+ (c).
Download figure:
Standard image High-resolution imageThe obtained SrF2:Ho3+ NPs were characterized by spherical shapes and various sizes, as shown in the TEM images (figures 1(b) and (c)). In the subsequent samples with increasing content of Ho3+ ions, a significant decrease in the average nanoparticle sizes was observed, and their diameters varied from 82.3 nm (the sample doped with the lowest number of Ho3+ ions) to 16.4 nm (the sample highly doped with Ho3+ ions) (table 1). The observed tendency is consistent with the results of the DLS and XRD measurements.
3.2. Spectroscopic properties
The obtained SrF2:Ho3+ NPs were subjected to spectroscopic studies, revealing interesting properties. In the excitation spectrum (figure 2(a)), the NIR band in the range from 1140 to 1210 nm (λmax. = 1156, 1184 nm), related to the 5I8 → 5I6 Ho3+ ions energy transition, was observed [24]. On the basis of the recorded excitation spectrum, the luminescence of the obtained SrF2:Ho3+ NPs was measured under 1156 nm irradiation.
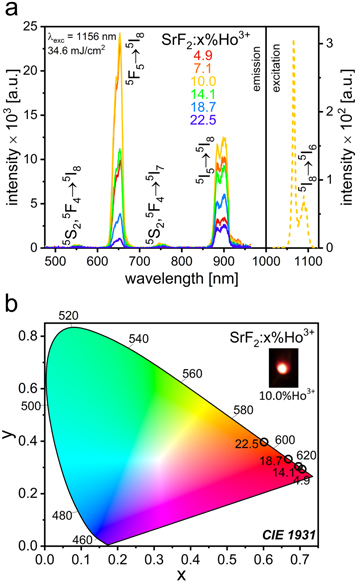
Figure 2. The excitation spectrum of the SrF2:10.0%Ho3+ sample recorded with the observation of the 653 nm luminescence band and emission spectra of SrF2 NPs doped with various amounts of Ho3+ ions obtained upon irradiation with 1156 nm excitation wavelength (a), CIE chromaticity diagram of prepared SrF2:Ho3+ NPs, calculated from the emission spectra (b).
Download figure:
Standard image High-resolution imageThe 1156 nm excitation resulted in UC emission at 554, 653, 755, and 900 nm (figure 2(a)) and the bands were assigned to the 5S2,5F4 → 5I8; 5F5 → 5I8; 5S2,5F4 → 5I7 and 5I5 → 5I8 Ho3+ ions transitions, respectively [24]. The bands at 653 and 900 nm were characterized by intensities significantly greater than those of the 554 and 755 nm bands. The SrF2 NPs doped with 10.0% Ho3+ ions were characterized by the most intense UC luminescence. Interestingly, it was observed that with increasing content of Ho3+ ions in the samples, the ratio of the intensities of the red emission at 653 nm and the NIR one at 900 nm decreased from 1.84 to 0.28 (figure S4). It is worth mentioning that the UC luminescence of the obtained SrF2:Ho3+ NPs appearing in the range of the optical windows can be used in medical applications.
The CIE chromaticity diagram related to the emission color of the SrF2:Ho3+ NPs was prepared on the basis of the corresponding UC emission spectra (figure 2(b)). The luminescence color of the obtained samples was slightly tuned due to the different concentrations of Ho3+ ions present in the samples and changed from red for NPs doped with low concentrations of Ho3+ ions to reddish-orange for NPs highly doped with Ho3+ ions.
The UC luminescence of Ho3+ ions may be a result of numerous energy transitions both from the excited states to the ground state as well as from the higher-energy excited states to the lower-energy ones, e.g. NIR emission with a wavelength of about 750 nm may result from the 5I4 → 5I8, 5S2,5F4 → 5I7 and 5F3 → 5I6 energy transitions [33]. Therefore, to fully understand the processes occurring in the obtained SrF2 NPs containing Ho3+ ions, the luminescence lifetime profiles were investigated. The results of these measurements for the SrF2:10.0%Ho3+ sample, as an example, are shown in figure 3(a) (the remaining results are presented in figure S5 in ESI). Moreover, to consider the nature of the observed UC emission, the rise and decay times were estimated with the use of the fitting by the Kohlrausch function (figures 3(b) and (c), Table S3):
where A is the oscillator coordinate, β is the degree of non-exponentiality, and τ is the characteristic rise (R) or decay (D) time [55].
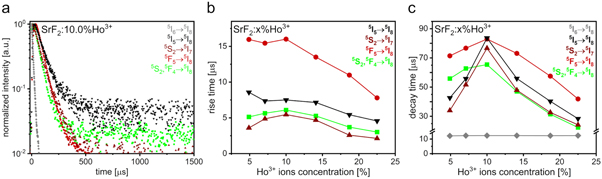
Figure 3. Luminescence lifetime profiles of SrF2:10.0%Ho3+ NPs (a), the rise (b) and decay (c) times calculated for the SrF2:Ho3+ NPs UC luminescence induced by excitation with 1156 nm.
Download figure:
Standard image High-resolution imageThe prepared SrF2:Ho3+ NPs were characterized by similar rise time values of the UC emission recorded at 554, 755 as well as 900 nm (6.09, 5.46 and 7.50 μs, respectively, for the SrF2:10.0%Ho3+ sample), which suggest, that these bands resulted from the radiative transitions from the excited energy levels similarly populated. The determined values of the rise times at 554 and 755 nm are in a very close range because they are related to the transition from the same 5S2,5F4 excited state. Therefore, it is concluded, that the 554 nm luminescence resulted from the radiative relaxation of the 5S2,5F4 excited energy levels to the 5I8 ground energy level, whereas the 755 nm emission was assigned to the radiative transition from the 5S2,5F4 states, but to the first excited 5I7 state. The above-described nature of the emission bands observed at the mentioned wavelengths is also supported by their low intensities, probably related to the low efficiency of the excitation process of the 5S2,5F4 energy levels. The UC emission at 900 nm is attributed to the 5I5 → 5I8 electronic transition. Analysis of the measured luminescence decays suggests that the excitation process, preceding the observed UC luminescence at 554, 755 and 900 nm, is associated with rapid processes, such as ground and excited state absorption (ESA and GSA).
The rise time values calculated for the 5F5 → 5I8 transition responsible for the emission at 653 nm are relatively long (16.01 μs for SrF2:10.0%Ho3+ sample), therefore the population of the 5F5 emitting level might be related to processes characterized by slower kinetics such as cross relaxations (CR) or energy transfers (ET) [31, 42]. Furthermore, for all of the SrF2:Ho3+ NPs, the values of rise times decreased with growing concentration of Ho3+ ions in the prepared samples, while the values of decay times initially increased, achieved a maximum for the sample characterized by the most intense luminescence, then rapidly decreased. This dependence is usually found for the materials doped with Ho3+ ions [28] and probably results from the increased contribution of the non-radiative processes related to the concentration quenching [56].
To determine the UC mechanism, the estimation of the number of photons involved in the population of the excited states in UC process is also relevant. The values of the involved photons n can be estimated on the basis of the dependence of the UC emission intensity IUC on the excitation power density P, or in the case of excitation with a pulsed laser, from its energy E [57]:

further described as n coefficients or slopes (obtained from a linear fit to the plot presented on a double logarithmic scale). Therefore, the dependencies of the integral UC emission intensities on the 1156 nm laser energy were measured and analyzed. The results obtained for the SrF2:10.0%Ho3+ sample are presented in figure 4(a) (the remaining results are shown in figure S6 and table S4 in ESI). The dependencies of the number of photons involved in the UC mechanism in the prepared SrF2 NPs doped with various amounts of Ho3+ are compared in figure 4(b).
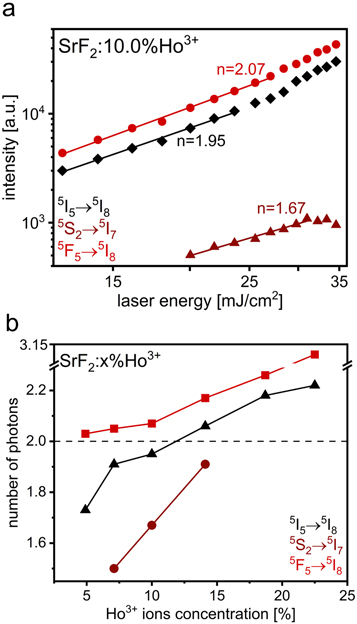
Figure 4. Dependencies of the integral luminescence intensity of the Ho3+ transition bands on the laser energy under 1156 nm excitation obtained for the SrF2:10.0%Ho3+ sample (a), number of photons involved in the UC mechanism of SrF2 NPs doped with various amounts of Ho3+ ions under 1156 nm excitation (b).
Download figure:
Standard image High-resolution imageThe estimated n coefficients of the recorded 653 nm bands of all SrF2:Ho3+ NPs were higher than 2, which implied that 3 photons were needed to excite the 5F5 energy level. The actual slope values are usually lower than theoretical because of competitive to UC processes, such as cross-relaxation or multiphonon quenching. Meanwhile, the slopes of the dependences shown in figure 4 and referring to the 755 nm bands in the emission spectra (figure 2) of the samples doped with Ho3+ ions in 7.1, 10.0, and 14.1% are lower than 2, which suggests that 2 photons were required to excite the 5S2 energy level (the intensity of this band for the remaining samples was too low to estimate the n coefficients, as were the intensities of the 554 nm bands of all obtained samples). The low doped in Ho3+ ions SrF2 samples were characterized by the slopes of the analogous dependences for 900 nm bands lower than 2, while the slopes of the dependences for the bands for the highly doped SrF2:Ho3+ samples were higher than 2. Thus, the number of photons, which were needed to excite the 5I5 state increased from 2 to 3 with increasing content of Ho3+ ions, which suggests possible alternations to the mechanism of excitation of the 5I5 state resulting from the processes of energy transfers (ET) induced by the Ho3+–Ho3+ interactions [43].
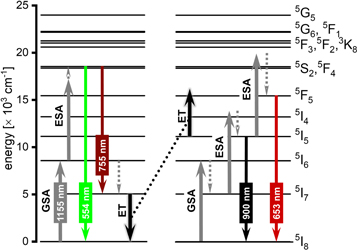
The spectroscopic analysis of the prepared SrF2:Ho3+ NPs, allowed drawing conclusions about the mechanism responsible for the observed UC emission (see figure 5). When the samples are irradiated with the 1156 nm pulsed laser, absorption of the first NIR photon occurs due to the GSA process, which results in the excitation of Ho3+ ions from their 5I8 ground state to the 5I6 excited state. After absorption of the first photon, two competitive energy processes can take place.
Figure 5. The proposed mechanism of energy transfers in SrF2:Ho3+ samples resulted from the 1156 nm excitation.
Download figure:
Standard image High-resolution image
In the first one, the second NIR photon can be absorbed by the Ho3+ ions in their 5I6 state, populating the higher-energy 5S2 and 5F4 states in the ESA process. Next, the absorbed energy can be released from the 5S2 and 5F4 energy levels to the 5I8 and 5I7 energy levels, generating luminescence at 554 and 755 nm, respectively.
In the second process, the Ho3+ ions, initially excited to the 5I6 state, undergo relaxation in the non-radiative process which results in populating the 5I7 excited state. Then, the absorption of the second NIR photon also by ESA process can occur leading to the excitation of the Ho3+ ions to their 5I4 excited state. The 5I4 state can undergo non-radiative relaxation process populating the 5I5 state, followed with another, but this time radiative relaxation process, resulting in emission at 900 nm.
The described mechanism responsible for the UC emission at 554, 755 and 900 nm is confirmed by the measured short rise times and the calculated numbers of photons involved in the UC mechanism, close to 2 [46, 47].
Moreover, the Ho3+ ions in their 5I7 excited state can act as an energy reservoir, from which the energy can be transferred to the other Ho3+ ions in the 5I5 excited state. This energy exchange results in the excitation of Ho3+ ions to their 5F5 energy state, from which depopulation to the ground state connected with red emission at 653 nm is possible. The described mechanism responsible for the red luminescence is supported by the long luminescence rise times with a rapid decrease in their values with growing Ho3+ concentration. Furthermore, the Ho3+ ions in the 5I5 state can be excited by the third NIR photon in the ESA process yielding the Ho3+ ions in the 5S2 and 5F4 states, from which a relaxation to state 5F5 occur, contributing to the observed at 653 nm luminescence.
The presented mechanism corresponds to the nature of the UC phenomena occurring in low-doped SrF2:Ho3+ samples. However, with the increase in the concentration of Ho3+ admixture in subsequent samples, the n coefficient increased, which was connected with the increase in the number of photons involved in the observed UC luminescence. The similar trend of the dependence of the n coefficient on the concentration of doping Ln3+ ions in UC materials is explained by the fact that as the concentration of Ln3+ ions increases, the distance between them decreases, and this enhances the efficiency of energy transfer, which has a contribution to increasing the overall conversion efficiency [16, 58, 59]. On the other hand, the increase in the content of the Ho3+ ions in the prepared samples caused the decrease in the luminescence rise and decay time, which is connected with the concentration quenching effect, reducing the UC efficiency [56]. The observed increase of n coefficient may be also a consequence of higher quenching/cross-relaxation rates resulting in the need for more rapid absorption/energy transfer of another photon [60].
4. Conclusions
Nanoparticles of strontium fluoride doped with 4.9 - 22.5% of the Ho3+ ions were successfully prepared using the hydrothermal method. The obtained materials were characterized by a crystalline structure and contained the nanoparticles of round shapes and sizes ranging from 16.4 to 82.3 nm.
The UC luminescence caused by the 1156 nm irradiation of SrF2:Ho3+ NPs was observed, wherein the most intense were red and NIR bands, recorded at 653 and 900 nm, respectively. Interestingly, a decreasing dependence of the ratio of the intensities of the 653 and 900 nm bands was noticed with increasing content of the Ho3+ ion admixture in the prepared SrF2 NPs samples. The up-conversion mechanism consisted of GSA and ESA processes (bands at 554 and 755 nm), assisted by non-radiative relaxation processes (bands at 653 and 900 nm), as evidenced by the calculated values of the rise times and slopes.
The most promising properties revealed the SrF2:10.0%Ho3+ sample, which was characterized by the most intense UC emission and red color luminescence. The size of the NP-s forming this material was about 50 nm. The mentioned sample was also characterized by good stability and low agglomeration in water colloids. The presented results are promising for opening a new path to the different applications of the prepared compounds, especially in medicine.
Acknowledgments
Funding for this research was provided by the National Science Centre, Poland, under grant no. 2016/22/E/ST5/00016 and project No. POWR.03.02.00–00-I032/16 under the European Social Fund—Operational Programme Knowledge Education Development, Axis III Higher Education for Economy and Development, Action 3.2 PhD Programme.
The authors have declared that no conflicting interests exist.
Data availability statement
The data that support the findings of this study are available upon reasonable request from the authors.