

Abstract
Fluorescent protein-encapsulated gold nanoclusters (AuNCs) offer a non-toxic means of sensing and imaging biological phenomena on the nanoscale. However, the biofunctionality of proteins encapsulating AuNCs has not been fully elucidated to date. Here we studied the biofunctionality of the second major drug binding site (Sudlow II) of Human Serum Albumin (HSA) encapsulated AuNCs after AuNC synthesis. L-Dopa, a fluorescent drug molecule associated with the clinical treatment of Parkinson's disease, which commonly binds to the Sudlow II site, was used to study the availability of the site before and after AuNC synthesis through changes to its fluorescence characteristics. L-Dopa was observed using its intrinsic fluorescence to readily bind to HSA-AuNCs complexes. Interestingly, the fluorescence emission intensity of AuNCs linearly increased with L-Dopa concentration while exciting the AuNC directly at 470 nm, Using a 400 nM HSA-AuNC solution, L-Dopa was rapidly detected at a limit of 300 pM, indicating that HSA-AuNCs fluorescence is extremely sensitive to molecular binding at the Sudlow II binding site. Future research may be able to utilize this sensitivity to improve the fluorescence characteristics of AuNCs within HSA-AuNCs for imaging and sensing including drug binding studies.
Export citation and abstract BibTeX RIS
Introduction
Serum Albumin encapsulated gold nanoclusters (AuNCs) are a new class of fluorophore which have several benefits in comparison to conventional aromatic dye fluorophores and have been increasingly studied and developed in recent years [1–8]. They are highly stable, non-toxic [9], non-photobleaching [10], have extremely long fluorescent lifetimes [11], possess a large Stoke-shift and emit in the red-near IR regime [12]. The latter minimises endogenous fluorescence, reduces Rayleigh scattering and permits work in the therapeutic window of tissue and cells. Due to these qualities, protein encapsulated AuNCs have significant potential as a fluorescent label in biomedical imaging and sensing [13–15]. To exploit this potential it is essential to understand the effects AuNC formation has on natural protein bio functionality. Human Serum Albumin (HSA) is the major plasma protein with vital functions acting as a molecular depot and carrier via two major binding sites (Sudlow I and II) [16]. Much effort has been made to elucidate nanoscale biological processes and dynamics in order to improve disease diagnostics and therapy via fluorescence and Raman based techniques [17–23]. With a better understanding of molecular transport within the body via nanoscale imaging and sensing, therapeutic treatments for specific diseases where drugs must be delivered to specific sites, such as Parkinson's, can be more intelligently developed for increased effectiveness [24–26].
Previously, we have disclosed the location of AuNCs within HSA, taking advantage of Forster Resonance Energy Transfer (FRET) between the single tryptophan of HSA and the encapsulated AuNC in conjunction with molecular dynamics simulations [27]. It was discovered that the AuNCs are bound to cysteine residues within a hydrophobic pocket located in domain IIB of the HSA protein, near the Sudlow I major drug binding site. Further studies found that the model binding drug, warfarin, could not occupy the Sudlow I binding site at the same time as an AuNC was bound to the protein, indicating that the proximity of AuNCs affects the Sudlow I binding site [28]. This raised further questions as to how the second Sudlow drug binding site was affected by the presence of a bound AuNC. Yeggoni and Subramanyam previously reported on the interactions of L-Dopa with HSA (Kd = 4.3 × 10⁻⁵ M) using intrinsic fluorescence spectroscopy [29]. It was shown that L-Dopa upon binding to the Sudlow II site quenched the fluorescence emission of tryptophan from the HSA protein and caused a decrease in the α-helical content of the protein. Thus, the binding of L-Dopa to HSA can be detected via this tryptophan emission quenching. In this work, we investigated the binding of L-Dopa to the HSA-AuNC and any effect the binding may have on the emission from the AuNC. The increasing HSA-AuNC emission in the red with L-Dopa can offer clear advantages over the weak, near UV emission of tryptophan.
Materials and methods
The synthesis of HSA-AuNCs was carried using Xie's method [1]. All synthesised samples were then dialysed into PBS buffer solution, using 10 kDa dialysis cassettes. All chemicals were purchased from Sigma-Aldrich. All dilutions were carried out using PBS buffer. L-Dopa solutions were made fresh for each experiment, diluted in purified water. Fluorescence emission spectra were measured using a HORIBA Fluorolog 3. Fluorescence lifetimes were measured using the Time Correlated Single Photon Counting (TCSPC) technique on a Horiba Deltaflex fluorometer. A time range of 13 μs and excitation with a 482 nm Delta Diode or 279 nm pulsed LED was used for all fluorescence lifetime measurements. Analysis was carried out using HORIBA DAS6 software.
Results and discussion
Figure 1 displays the normalized fluorescence emission spectra of L-Dopa, HSA and HSA-AuNCs. The excitation wavelength used and emission peak for each fluorescent molecule was (ex 280 nm, em 320 nm), (ex 290 nm, em 320 nm) and (ex 290 nm, em 680 nm) respectively. L-Dopa's ability to bind to HSA and HSA-AuNCs was studied by introducing free L-Dopa in solution with HSA and HSA-AuNCs independently. The emission intensity of tryptophan at 320 nm was found quenched upon the introduction of L-Dopa up to a concentration of 40 μM in both cases of HSA and HSA-AuNCs. Upon increasing the L-Dopa concentration further, the emission was seen to increase due to the influence of free L-Dopa fluorescing in solution, despite the excitation of 290 nm used, as shown in figure 2.

Figure 1. Normalized fluorescence emission spectra of L-Dopa (solid black curve), HSA (dashed red curve) and HSA-AuNCs (dotted blue curve). Excitation wavelength for each sample was 280 nm, 290 nm and 290 nm respectively. The schematic depicts the system, highlighting the Sudlow II binding site, AuNC position and increase in AuNC emission when excited at a longer wavelength of 470 nm.
Download figure:
Standard image High-resolution image
Figure 2. Normalized peak fluorescence intensity of L-Dopa in solution with 40 μM of HSA (red) and L-Dopa in solution with 40 μM of HSA-AuNCs (black). Excitation wavelength of 290 nm, emission wavelength of 325 nm.
Download figure:
Standard image High-resolution imageThe quenching in both cases agrees well with Yeggoni and Subramanyam, indicating that L-Dopa is bound to the Sudlow site II [29]. Thus, the synthesis of AuNCs within HSA does not hinder the binding affinity of this site. The increase in fluorescence intensity of HSA-AuNCs is attributed to L-Dopa in solution; since at 40 μM of L-Dopa in solution the ratio between L-Dopa and HSA protein is 1:1 and no further binding occurs at a higher molecular ratio once all available Sudlow II sites are taken up. Since L-Dopa acts as a static quencher to tryptophan fluorescence emission [30], the effects of quenching on the Forster Resonance Energy Transfer (FRET) between tryptophan and the AuNCs was studied in more detail. The increased concentration of L-Dopa, and subsequent binding to HSA resulted in a diminished energy transfer from tryptophan to AuNCs; observed via a decrease in the emission intensity of AuNCs when excited at 290 nm. Interestingly, the fluorescence maximum intensity of HSA-AuNCs, when excited at a longer wavelength such as 470 nm, increases until a ratio of 1:1 between HSA-AuNCs and L-Dopa is reached. No further enhancement of the AuNCs fluorescence emission is observed at L-Dopa concentrations higher than 40 μM, shown in figure 3.

Figure 3. Normalized peak fluorescence intensity of AuNCs (40 μM) as a function of increasing L-Dopa concentration. Excitation wavelength of 290 nm (red), 470 nm (black), emission wavelength of 680 nm in both cases.
Download figure:
Standard image High-resolution imageThe fluorescence lifetimes associated with HSA-AuNCs were also studied to further understand the effect L-Dopa binding has on the AuNC fluorescence emission. The fluorescence decay was measured using TCSPC required 3-exponential fitting to describe the data, as previously reported [27]. The fluorescence decay curve for HSA-AuNCs when exciting at 482 nm is shown in figure 4 as an example.
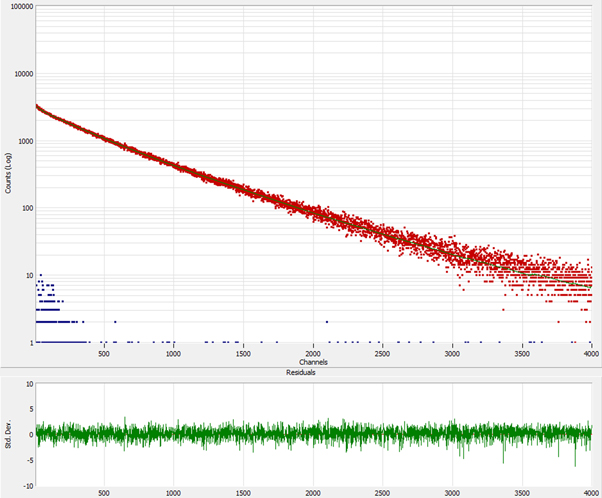
Figure 4. Fluorescence decay curve of HSA-AuNCs over a time range of 13 μs. Excitation 482 nm, emission 680 nm with the weighted residuals of a 3 exponential fitting to the decay. Time Calibration is 3.327 ns/channel. Peak position at channel 10. The blue dots represent the tail of the excitation pulse which is effectively a δ function on this time-scale.
Download figure:
Standard image High-resolution imageThe lifetimes were studied both by excitation at 279 nm via FRET from tryptophan to AuNCs, and directly exciting the AuNCs at 482 nm. In both cases τ1 is small and does not change. This component arises from measured scattered light [31] and accounts for 1%–2% of the total relative amplitude of the decay. The two long lifetime components, τ2 = ∼1 μs and τ3 = ∼2 μs, are attributed to the AuNCs and agree with previous reports [32]. As L-Dopa concentration increases, the fluorescence lifetime, τ3, is seen to increase by 0.1–0.2 μs, depending on the excitation source. This increase in fluorescence lifetime also coincided with a decrease in the relative amplitude and the percentage of overall counted photons (a3) associated with τ3. Since τ1 is scattered light and the photons collected are proportional to the measurement time, the decrease in the relative intensity of τ3 had no effect on τ1, but resulted in the relative intensity and percentage of overall counts (a2) attributed to the τ2 increase. The observed changes in τ2 and τ3 are not dependent on the excitation wavelength, showing that the binding of L-Dopa to the Sudlow site II can directly affect the triplet states and decay process of AuNCs. To further understand how AuNCs are affected by molecules binding at Sudlow Site II, synthesis of AuNCs was carried out with L-Dopa prebound to HSA. The fluorescence emission of HSA-AuNCs was monitored during the synthesis. For AuNC synthesis using native HSA a fluorescence emission peak at 525 nm was initially seen to grow, as seen in figure 5.
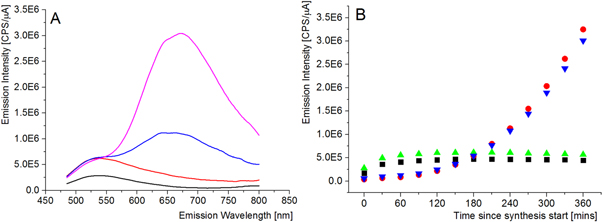
Figure 5. (A)—Fluorescence emission spectra of HSA-AuNCs during synthesis. 0 h (black), 2 h (red), 4 h (blue) and 6 h (pink). Excitation wavelength of 470 nm. (B)—Peak fluorescence emission of HSA-AuNCs (with and without L-Dopa pre-bound to HSA) during synthesis. Emission maximum of HSA-AuNCs at 525 nm (black) and at 680 nm (red). Emission maximum of L-Dopa-HSA-AuNCs at 525 nm (green) and at 680 nm (blue). Excitation wavelength of 470 nm in all cases.
Download figure:
Standard image High-resolution imageThis peak has previously been attributed to small intermediate AuNCs forming [28, 32]. Over time this peak decreases as the cluster size increases and fluorescence emission at 680 nm increases. Both fluorescence peaks were tracked during the synthesis of HSA-AuNCs with L-Dopa prebound and compared to the native HSA. It was found that prebound L-Dopa does not affect the synthesis of AuNCs in HSA. This adds further evidence that the Sudlow II binding site is independent of the AuNC binding site and does not play a role in the formation of AuNCs, unlike the Sudlow site I [28]. To quantify the L-Dopa detection limits of HSA-AuNCs the concentration of HSA-AuNCs was diluted to 400 nM. Sequential additions of 20 nM of L-Dopa was added to the HSA-AuNC solution and the fluorescence emission of AuNCs (excitation 470 nm, emission 680 nm) was measured. A nearly linear relationship was found between 0–200 nM of L-Dopa and AuNC emission, as shown in figure 6.
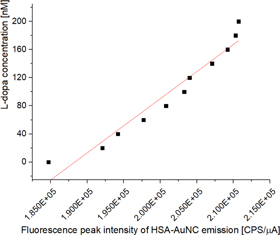
Figure 6. L-Dopa concentration as a function of fluorescence emission of HSA-AuNCs (400 nM), excitation 470 nm, emission 680 nm. A linear fit was applied to the data set with a gradient of 7.7 ± 0.6 × 10⁻³.
Download figure:
Standard image High-resolution imageThe linear relationship was seen to fall away and the fluorescence enhancement of AuNCs had diminishing returns above 200 nm, as seen for the initial interaction studies in figure 3. Again, we observed that the enhancement only takes place when the protein to L-Dopa molecule is less than 2:1, indicating that the formation of dimers upon AuNC synthesis has a direct effect on the number of Sudlow II binding sites available for L-Dopa binding. The limit of detection (LOD) was found to be 300 pM, for a HSA-AuNC concentration of 400 nM. Since the dynamic range is directly linked to the protein/L-dopa ratio, it is possible to shift the dynamic range to accommodate the L-Dopa concentration of interest. To show that the dynamic range can be tailored via HSA-AuNC concentration we increased the concentration of HSA-AuNCs to 4 μM and carried out the experiment again, as shown in figure 7.

Figure 7. L-Dopa concentration as a function of fluorescence emission of HSA-AuNCs (4 μM), excitation 470 nm, and emission 680 nm. A linear fit was applied to the data set with a gradient of 2.9 ± 0.3 × 10⁻⁶ μMμA/CPS.
Download figure:
Standard image High-resolution image
In this case, the dynamic range was found to be between 0–2 μM; again, showing the same behaviour at L-Dopa concentrations higher than the 2:1 protein/L-Dopa ratio. For a 4 μM concentration, the LOD was found to be 340 nM. The same experiment was applied to HSA-AuNC solution with a concentration of 40 μM, again finding the same dynamic range in relation to HSA-AuNC concentration.
Conclusions
We have disclosed that the Sudlow II binding site located in domain IIIA of the HSA protein is active after the encapsulation of AuNCs. L-Dopa was found to successfully bind to Sudlow site II in the presence of the AuNCs, confirmed by a characteristic decrease in the intrinsic protein fluorescence intensity. It was also found that AuNCs could be synthesised within HSA that already had L-Dopa pre-bound, suggesting that the Sudlow II binding site does not play a role in AuNC formation, unlike the Sudlow I binding site. It was also observed that the fluorescence characteristics of AuNCs are directly affected by the binding of L-Dopa to the protein. The decrease in fluorescence intensity as a function of L-Dopa concentration combined with the increase in fluorescence lifetime under 279 nm excitation suggests that a complex is formed between the two fluorescent molecules and reduced FRET between tryptophan and the AuNC. Future studies into improving the fluorescence emission of HSA-AuNCs may concentrate on utilising the Sudlow II binding site. The relationship between HSA-AuNC and L-Dopa concentration below a ratio of 2:1 was found to be nearly linear, and as such, could be used as a means of quantifying L-Dopa concentrations in solution via a quick and simple measurement of AuNC emission intensity. We have shown that the lowest limit of detection is sub nanomolar, with a value of 300 pM and as a rule of thumb, the limit of detection has always been lower than 1/100th of the HSA-AuNC concentration. Therefore, HSA-AuNCs have a larger dynamic range and lower limit of detection than some other fluorescence-based methods of detecting L-Dopa and related compounds [33–35]. Further studies are needed to explore the possibility of using HSA-AuNCs as a platform for investigating the binding of a wider range of drug molecules to the Sudlow II site of HSA-AuNCs.
Acknowledgments
Ben A Russell Acknowledges a PhD studentship from the University of Strathclyde. The authors have declared that no conflicting interests exist.