

Abstract
Under physiological conditions, in vitro interaction between the bio-active substance 6-(2-morpholin-4-yl-ethyl)-6H-indolo[2,3-b]quinoxaline hydrochloride (MIQ) and human serum albumin (HSA) was investigated at an excitation wavelength 260 nm and at different temperatures (298 K, 308 K and 313 K) by fluorescence emission spectroscopy. From spectral analysis, MIQ showed a strong ability to quench the intrinsic fluorescence of HSA through a static quenching procedure. The binding constant is estimated asKA = 2.55 × 10⁻⁴ l · mol−1 at 298 K. Based on the thermodynamic parameters evaluated from the van 't Hoff equation, the enthalpy change (ΔH°) and entropy change (ΔS°) were derived to be negative values. A value of 2.37 nm for the average distance r between MIQ (acceptor) and tryptophan residues of HSA (donor) was derived from the fluorescence resonance energy transfer. UV/vis absorption spectra were used to confirm the quenching mechanism.
Export citation and abstract BibTeX RIS
1. Introduction
Drug–protein binding has become an important research field in life sciences, chemistry and clinical medicine [1].
Human serum albumin (HSA) serves as the primary transport protein in human circulation capable of binding reversibly both endogenous and exogenous ligands, such as fatty acids, hormones and drugs. It consists of 585 amino acids in a single polypeptide chain [2]. Serum albumin is considered as a model to study the drug–protein interaction in vitro. It is a convenient protein for intrinsic fluorescence measurement due to the presence of tryptophan (Trp) residues, which are highly sensitive to their local environment. They can also be used to observe changes in the fluorescence emission spectra due to protein conformational changes and binding to substrates [3]. Therefore, study of the interaction between protein and drug molecules will help provide basic information on the pharmacological actions, bio-transformation and bio-distribution of drugs. The binding phenomena will also be useful to explain the relationship between the structures and functions of proteins.
Some popular techniques have been used to investigate the interaction between drugs and proteins. Fluorescence spectroscopy is one of the more powerful techniques used to study molecular interactions that change the local environment of fluorophore and help to predict the binding phenomenon of drugs to proteins [4].
There are a number of reports in the literature, where the binding of metabolites, drugs, dyes, fatty acids and bio-active-substances have been studied in detail. So the nature of binding of a ligand with HAS (BSA) is different for different ligands [5–31].
In this work, we provide fluorescence spectroscopic investigations on the effect of the newly synthesized bioactive substance 6-(2-morpholin-4-yl-ethyl)-6H-indolo[2,3-b]quinoxaline hydrochloride (MIQ) on the structural and optical properties of human serum albumin. Binding parameters, such as the binding constant, number of sites and binding distance were obtained from the fluorescence data.
2. Materials and method
2.1. Materials
HSA was purchased from Sigma-Aldrich. A 1.0 · 10−5 mol l−1 solution of HSA was prepared by dissolving 66.5 mg in 100 ml of water. A protein concentration was determined spectrophotometrically using a molar extinction coefficient of 36 600 mol−1 · l · cm−1 at 280 nm [32].
MIQ solution (2.7 · 10−3 mol l−1) was prepared by dissolving 0.100 g of substance in 100 ml of water. The working solutions were obtained by diluting the stock solution with water. MIQ (scheme 1) was synthesized as described in [33] and manifested antiviral activity.
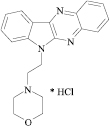
Scheme 1. The structure of MIQ.
Download figure:
Standard image High-resolution imageA buffer solution was prepared by dissolving 121.14 g tris (tris(hydroxymethyl) aminomethane) (Sigma-Aldrich) in 800 ml H2O, and adjusting the pH to 7.4 using the appropriate volume of concentrated HCl, diluted to 1000.0 ml with water.
All of the used chemicals were of either analytical grade or chemically pure. Also high-purity water from the Milli-Q system was used in the performed.
2.2. Apparatus
Absorption spectra were recorded at room temperature on a UV-2401 PC UV–Vis spectrophotometer (Shimadzu, Japan) equipped with 1.0 cm quartz cells. Fluorescence spectra were recorded on a on Cary Eclipse Fluorescence spectrometer (Varian, Australia) equipped with a150 W xenon lamp in a 1 cm quartz cell using an excitation wavelength of 260 nm over a wavelength range of 270–450 nm at three temperatures (298, 308, 313 K). The excitation and emission bandwidths were 10 nm.
For different temperatures a thermostat bath (WNB 14 Memmert GmbH, Germany) was used. The pH values of solutions were measured on a Lab 850 pH meter (Schott Instruments GmbH, Germany) with a glass electrode.
The data were analyzed using Origin 8.0 software (OriginLab Corporation, Northampton, MA, USA).
2.3. Procedure
1.00 ml Tris-HCl buffer, 1.0 ml of 1.0.10−5 mol l−1 HSA solution and an appropriate quantity of the working MIQ solution (2.7 · 10−5 mol l−1) were transferred to a 10 ml flask. Then the solution was diluted to 10 ml with high-purity water. All solutions were mixed thoroughly and kept five min before measurements. A blank system containing only 1.00 ml Tris-HCl buffer and 1.0 ml of 1.0 · 10−5 mol l−1 HSA solution was prepared similarly.
The UV/vis absorbance spectra were recorded at room temperature. A fixed concentration of HSA (8.0 · 10−6 mol l−1) with various concentrations of the MIQ solution (1.0 × 10⁻⁶; 2.0 × 10⁻⁶; 5.0 × 10⁻⁶; 7.0 × 10⁻⁶; 1.0 × 10⁻⁵ mol l−1) and 1.00 ml Tris-HCl buffer were added, and the solutions were diluted to 10 ml with high-purity water.
3. Results and discussion
3.1. UV–vis absorption spectra experiments
UV–vis absorption measurement is a simple and pertinent method that is used to investigate structural changes and to explore complex formations [34]. MIQ exhibited three evident peaks at220 nm, 270 nm, 356 nm and 400 nm (figure 1(a)).

Figure 1. Absorption spectrum of MIQ (cMIQ = 1.0 × 10⁻⁵ mol l−1) (a); effect of MIQ on UV absorption spectra of HSA (b) (T = 298 K, pH 7.4, cHSA = 8·10−6 mol l−1, cMIQ × 10−5 mol l−1, 1–6: 0, 0.1, 0.2, 0.5, 0.7, 1.0 (2–6—difference absorption spectrum between MIQ—HSA and MIQ).
Download figure:
Standard image High-resolution imageTo initially verify the quenching mechanism, the UV absorption spectra of (HSA) and ((HSA + MIQ) − MIQ) were measured and recorded. As shown in figure 1(b), HSA possessed two absorption peaks at 220 nm and 280 nm. The strong absorption peak at around 220 nm reflected the absorption of the backbone of HSA, while the weak absorption peak at around 280 nm resulted from the aromatic amino acids (Trp, Tyr and Phe). With the addition of MIQ, the intensity of the peak at 220 nm was changed with a redshift of about 2 nm, indicating disturbances to the microenvironment around the amide bonds in the protein. The results demonstrated the existence of an interaction between MIQ and HSA. The absorption spectrum at around 280 nm did not shift, indicating that the microenvironment around the aromatic acid residues was not exposed to any change upon HSA-MIQ complexation. Collectively, the fluorescence quenching of HSA by drugs was caused by the static quenching, which supported the HSA UV spectral shifts [35].
3.2. Fluorescence quenching spectra
Any process that decreases the fluorescence intensity of a sample is called fluorescence quenching. The basic principles, like excited state reactions, molecular rearrangements, energy transfer, ground state complex formation and collisional quenching involved in a molecular interaction, can result in quenching.
The interaction of MIQ with HSA was evaluated by monitoring the intrinsic fluorescence intensity changes of proteins upon addition of MIQ (figure 2). The emission of HSA was characterized by a broad emission band at 340 nm. HSA fluorescence intensity decreased remarkably as MIQ concentrations increased. MIQ produced ~50% quenching in HSA fluorescence intensity, which was accompanied by a 4 nm blueshift in the emission maximum at the same ligand concentration. The shift in the emission maximum of HSA towards a shorter wavelength suggested increased hydrophobicity in the microenvironment of the protein fluorophores upon interaction with this compound [36]. This indicated that MIQ could interact with HSA.
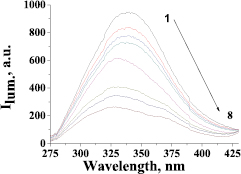
Figure 2. Fluorescence emission spectra of HSA in the presence of MIQ various amounts (cMIQ (µmol l−1), curves (1–8): 0, 0.81, 1.35, 1.89, 2.70, 5.40, 8.10, 10.8; pH 7.4, λex = 260 nm, λem = 340 nm, cHSA = 1·10−6 mol l−1, T = 298 K).
Download figure:
Standard image High-resolution imageAnalysis of the emission change in HSA with various amounts of MIQ was carried out with the Stern–Volmer equation:

where F0 and F are the fluorescence intensity in the absence and presence of the quencher, respectively, Q the quencher concentration, and kq the quenching rate constant for a biomolecular reaction, KSV the Stern–Volmer quenching constant and τ0 is the average lifetime for fluorophore in the absence of quencher evaluated at 10−8 s [37].
Figure 3 shows plots of F0/F versus MIQ concentrations at different temperatures. They exhibit good linear correlations. It is clear that plots in figure 3 are approximately consistent with the Stern–Volmer equation, from which the Stern–Volmer quenching constant KSV is derived, listed in table 1.
Table 1. Stern–Volmer quenching constant KSV, bimolecular quenching rate constant kq of the HSA-MIQ system at different temperatures, R represents the correlation coefficients of the plots, λex = 260 nm.
| T (K) | KSV·(×10−5 l·mol−1) | R | kq (×10−13 l·mol−1 s−1) |
|---|---|---|---|
| 298 | 2.68 | 0.9958 | 2.68 |
| 308 | 1.64 | 0.9993 | 1.64 |
| 313 | 1.46 | 0.9969 | 1.46 |
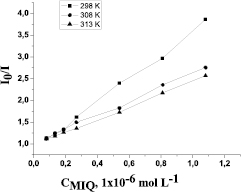
Figure 3. Stern–Volmer plots for quenching of HSA fluorescence by MIQ at different temperatures (pH 7.4, λex = 260 nm, λem = 340 nm, cHSA = 1 · 10−6 mol l−1).
Download figure:
Standard image High-resolution imageA quenching process can usually be induced by a collisional process and/or a formation of a complex between the quencher and fluorophore. The values for quenching rate constants in table 1 are of 1013 l × mol−1 s−1in magnitude. Obviously, the quenching rate constant kq for MIQ-HSA is greater than that of a scatter process. It may be attributed to a quenching process initiated by bio-active substances. So it shows that the above quenching was not initiated by dynamic collision but compound formation - it was static quenching. Furthermore, linear Stern–Volmer plots may either reveal the occurrence of just a binding site for quencher in the proximity of the fluorophore or indicate the existence of a single type of quenching [38].
When small molecules are bound independently to a set of equivalent sites on a macromolecule, the binding constant (KA) and sites (n) can be derived from equation (2) [20]:

where F0 and F are the fluorescence intensity in the absence and presence of bio-active substance, respectively.
They still display good linear correlations. The values for KA and n derived from plots in figure 3 according to equation (2) are collected in table 2.
Table 2. Binding constant KA, the number of binding sites n and distance between acceptor and donor r at different temperatures and thermodynamic parameters of MIQ-HSA interaction at pH 7.4 (λex = 260 nm).
| T (K) | KA · (×10−5 l · mol−1) | N | r | ΔH° (kJ · mol−1) | ΔG° (kJ · mol−1) | ΔS° (J · mol−1 · K−1) |
|---|---|---|---|---|---|---|
| 298 | 25.52 | 1.20 | 2.37 | −150.39 | −36.10 | −383.53 |
| 308 | 1.69 | 1.02 | 2.63 | −32.27 | ||
| 313 | 1.70 | 1.01 | 2.58 | −30.35 |
They indicate that the amount of MIQ will affect the pattern of MIQ binding to HSA. The influence of temperatures on the MIQ binding to HSA is significant. It is obvious that higher temperatures will lead to a rapid collision, whereas also resulting in a decrease in the binding strength. As a result, KA and n will decrease with raising temperature.
Furthermore, from the value for n close to one, we may infer that only one kind of binding site on HSA for MIQ binding exists.
3.3. Binding mode
There are several intermolecular forces causing small drug molecules to bind to proteins, such as hydrogen bonding, van der Waals, ionic, electrostatic and hydrophobic interactions, etc. The signs and magnitudes of thermodynamic parameters for protein reactions can be accounted for by the main forces contributing to protein stability. The values for the enthalpy change (ΔH°) and entropy change (ΔS°) will be derived from the van 't Hoff equation by considering ΔH° not varying significantly over the experimental temperature range:

where KA is the binding constant at a definite temperature T, and R is the gas constant. Consequently, the amount of free energy change ΔG° required for the binding is estimated from the following equation:

The data for ΔH° and ΔS° of MIQ binding to HSA are listed in table 2. With respect to recognized literature data on analogous systems [25, 39, 40], the negative values of ΔH° and ΔS° can be attributed in part to van der Waals forces and in part to the formation of hydrogen bonds.
3.4. Energy transfer from HSA to MIQ
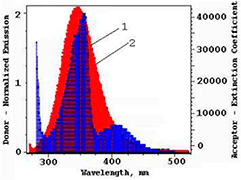
Fluorescence resonance energy transfer (FRET) is a distance–dependent interaction between the different electronic excited states of molecules. In this interaction, excitation energy is transferred from one molecule (donor) to another (acceptor) through direct electrodynamic interaction, without emission of a photon from the former molecular system [41]. Energy transfer may occur under the following conditions: when the donor can produce fluorescent light; when there is an overlap between the fluorescence emission spectrum of the donor and the absorbance spectrum of the acceptor; and when the distance between the donor and the acceptor is less than 8 nm. The efficiency of the energy transfer between MIQ and the HSA Trp214 residue could be used to evaluate the distance between the two using FRET. The overlap of the absorbance spectrum of MIQ with the fluorescence emission spectrum of HSA has been shown in figure 4.
Figure 4. Overlap of the absorption spectrum of MIQ (1) with the fluorescence emission spectrum of HSA (2) (cHSA/cMIQ = 1 : 1, 1 · 10−6 mol l−1; T = 298 K; pH 7.4; λex = 260 nm).
Download figure:
Standard image High-resolution image
According to Forster's non-radiative resonance energy transfer theory [42], energy transfer efficiency E is related not only to the distance (r) between the bound bio-active molecule (acceptor) and the protein residue (donor), but also to the critical energy transfer distance (R0). By Forster's theory, the efficiency of energy transfer (E) can be calculated according to the following equation:

where r is the distance between the acceptor (MIQ) and donor (HSA), and R0 is the critical distance when the transfer efficiency is 50%. The value of R0 is calculated using the following equation:

where K2 is the spatial orientation factor of the dipole; n is the refractive index of the medium; φ is the fluorescence quantum yield of donor; and J is the spectral overlap between the emission spectrum of the donor and the absorption spectrum of the acceptor (figure 4), given by:

where F(λ) is the normalized fluorescence intensity of the donor at a wavelength of λ, and ε(λ) is the molar absorption coefficient of the acceptor at a wavelength of λ. In the present case, K2 = 2/3, n = 1.336, and φ = 0.118 [43]. Hence, from equations (5)–(7), we couldcalculate the following parameters, which are listed in table 3. In conclusion, the distance (r) between HSA Trp214 and bound MIQ was much less than 8 nm, and accorded with the relationship 0.5R0 < r <1.5R0. This implied that the non-radiative energy transfer from HSA to MIQ occurred with a high possibility, which was in accordance with the occurrence of a static quenching mechanism. This result indicated that the binding obeyed the conditions of Forster's energy transfer. A comparison of the J, R0 and r values of different ligands bound to proteins is given in table 3.
Table 3. Comparative assessment of the MIQ (ligand) distance to proteins (HSA, BSA) measured by Forster's nonradiative energy transfer with other ligands bound to proteins (HSA, BSA).
| Ligand | Protein | J (cm3 l mol−1) | R0 (nm) | r (nm) | References |
|---|---|---|---|---|---|
| Mitoxantrone | HSA | 1.67 × 10⁻¹⁵ | 0.48 | 2.64 | [5] |
| Imidacloprid | HSA | 3.17 × 10⁻¹⁵ | 1.52 | 2.10 | [6] |
| Captopril | HSA | 1.09 × 10⁻¹⁸ | 2.37 | 1.05 | [7] |
| Bio-active 3-pyrazolyl-2-pyrazoline derivative | BSA | — | 1.60 | 2.00 | [8] |
| Bio-Active imidazole derivative | BSA | 2.37 × 10⁻¹⁵ | 2.41 | 2.44 | [9] |
| Eupatorin | BSA | 1.79 × 10⁻¹⁴ | 1.56 | 1.64 | [10] |
| Mangiferin | BSA | 3.54 × 10⁻¹⁴ | 5.20 | 5.20 | [11] |
| Erlotinib hydrochloride | BSA | 3.89 × 10⁻²¹ | 2.00 | 2.20 | [12] |
| Sanguinarine | BSA | 1.29 × 10⁻¹⁴ | 2.63 | 2.38 | [13] |
| Carbamazepine | BSA | 3.24 × 10⁻¹⁵ | 2.11 | 3.60 | [14] |
| Naringin | BSA | 3.24 × 10⁻¹⁵ | 2.32 | 3.25 | [16] |
| Thulium (III)–porphyrin complex | BSA | 3.36 × 10⁻¹⁴ | 4.53 | 4.36 | [15] |
| 3-carboxyphenoxathiin | BSA | 1.63 × 10⁻¹⁵ | 1.86 | 1.86 | [17] |
| Paclobutrazol | HSA | 1.35 × 10⁻¹⁴ | 2.58 | 4.41 | [18] |
| Morin | BSA | 1.91 × 10⁻¹⁴ | 2.73 | 3.06 | [19] |
| Pazufloxacin mesilate | BSA | 9.93 × 10⁻¹⁵ | 2.45 | 4.04 | [20] |
| Benzidine | Trypsin | 3.92 × 10⁻¹⁵ | 2.67 | 2.97 | [21] |
| Kaempferol-3-O-a-L-rhamnopyranosyl-(1–3)-a-L- rhamnopyranosyl-(1-6)-b-D-galacto-pyranoside | BSA | 1.79 × 10⁻¹⁴ | 2.78 | 4.22 | [22] |
| Nevadensin | Lysozyme | 8.17 × 10⁻¹⁵ | 2.41 | 2.28 | [23] |
| Riboflavin | BSA | 1.74 × 10⁻¹⁴ | 4.12 | 5.74 | [24] |
| Farrerol | Lysozyme | 5.19 × 10⁻¹⁴ | 2.07 | 2.67 | [25] |
| Fosfomycin | BSA | 1.87 × 10⁻¹⁴ | 2.83 | 4.99 | [30] |
| Sulfamethoxazole | HSA | 1.70 × 10⁻¹⁶ | 2.79 | 3.89 | [31] |
| Bio-active 6-(2-morpholin-4-yl-ethyl)-6H-indolo[2,3-b]quinoxaline hydrochloride (presented study) | HSA | 2.35 × 10⁻¹⁴ | 2.83 | 2.37 | This work |
4. Conclusions
In this work, the interaction between MIQ and serum albumin (HSA) has been investigated by a fluorescence method combined with UV–vis spectroscopy techniques under simulative physiological conditions. The experiment results indicate that MIQ quenches the intrinsic fluorescence of proteins through the static quenching mode of the MIQ-HSA system, which supported the HSA UV spectral shifts and the decreasing binding constant for MIQ and HSA complex with increasing temperatures indicating the decomposition of the system.
The values of the binding constant and the number of binding sites of the MIQ-HSA system are determined using the Stern–Volmer equation. The average binding distance between donor and acceptor molecules is found to be 2.37 nm for HAS-MIQ systems from the Forster non-radioactive resonance energy transfer theory.
Since, the pharmaceutical firms need standardized screens for protein binding in the first stepof new drug design, this kind of study of interactions between HSA with MIQ would be useful in the pharmaceutical industry and clinical medicine.
Acknowledgments
Funding: The funders had no role in study design, data collection and analysis, decision to publish, or preparation of the manuscript. The authors also acknowledge financial support from the National Academy of Sciences of Ukraine. Competing interests: The authors have declared that no competing interests exist.