


Abstract
Gelatin is utilised as a nitrogen source to synthesise nitrogen (N)-doped carbon nanotubes (CNTs). The N-doped CNT was prepared by mixing gelatin and CNT, followed by calcination at 500 °C and 800 °C under N2 atmosphere. X-ray diffraction analysis shows that the higher gelatin weight ratio results in a decrease of the crystallisation. X-ray photoelectron spectroscopy deconvolution analysis confirms that pyridinic-N and pyrrolic-N have appeared at the surface of the samples. The higher calcination temperature affects the surface properties of N-doped CNT which tend to shift the pyrrolic-N to the pyridinic-N. Cyclic voltammetry analysis reveals that the presences of pyridinic-N and graphitic-N configuration have higher oxygen reduction reaction (ORR) activity compared to the N-pyrrolic structure.
Export citation and abstract BibTeX RIS
1. Introduction
Over the past decades, fossil-derived energy has been used in human development in all fields. The depletion of fossil energy and climate change make people move to the development of renewable energy sources. In energy conversion and storage systems application, materials synthesis and nanotechnology play a significant role. Carbon nanotubes (CNTs) have been highlighted as a viable material for fuel cell applications in recent years due to their chemical stability, superior electric conductivity, and good mass transport capability [1–3]. Moreover, modifying these CNTs can improve their electrocatalytic activity, such as by doping CNT using nitrogen [4–8], sulfur [9, 10], oxygen [11], boron [12, 13], and phosphorus [14–16]. Nitrogen-doped carbon nanotubes (NCNTs) have gained more attention due to their superior electrocatalytic performance to Pt and act as a metal-free catalyst for oxygen reduction reaction (ORR) [17–19]. It is widely accepted that due to size similarity, nitrogen is easier to replace a carbon atom in the hexagonal structure, resulting in nitrogen-doped carbon. The disordered structure and higher surface polarity due to nitrogen insertion make the ORR electrocatalyst more efficient. Nitrogen sites, as a result, have a significant impact on ORR activity.
Although there are other methods for doping nitrogen into carbon, pyrolysing precursors with nitrogen sources appears to be a potential approach for producing N-doped carbon nanotubes (NCNTs). The commonly used nitrogen precursor to synthesise nitrogen-doped carbon materials is ammonia gas (NH3) [8, 20, 21]. The synthesis process includes heating carbon source and ammonia in high temperatures [20]. However, due to the high toxicity of ammonia gas, we are looking for a new method that is simple but effective to dope CNT by mixing carbon materials with non-toxic nitrogen precursors (molecules and/or polymers containing nitrogen), followed by heating at high temperatures. The pyrolysis of alternate nitrogen-containing precursors such as melamine [22, 23], urea [24, 25], and amide compound [26] has been conducted for synthesising nitrogen-doped carbon materials.
One of the nitrogen precursors in nature and readily available is gelatin. Gelatin is a mixture of proteins and peptides which can be extracted from various animal by-products. Nitrogen in gelatin is represented by the amine group as an active group that can react with organic and inorganic substances [27]. Due to its high availability and low cost, gelatin is one of the promising precursors for modifying surface properties of carbon materials [17, 28–30]. However, the study of gelatin as a precursor for nitrogen functionalisation that can be utilised to synthesise NCNT is still limited.
We synthesise nitrogen-doped carbon nanotubes (NCNTs) by combining CNT and gelatin as a nitrogen source in water as the solvent. The effect of gelatin composition and pyrolysis temperature on the characteristics of doping nitrogen species on carbon in CNT substrates was also investigated. X-ray photoelectron spectroscopy (XPS) analysis was done to gain a better knowledge of the surface properties of as-synthesised NCNT samples. The ORR active sites in NCNT can be determined by the nitrogen bond present in CNT structure [19, 31]. We used cyclic voltammetry to evaluate the electrochemical characteristics of N-doped CNT to investigate the relationship between nitrogen configuration and catalyst active sites.
2. Experimental
CNT was purchased from Sigma-Aldrich (cat. no. 773840, diameter about 10 nm, approximate length about 3–6 μm). Pristine CNT powder was mixed with commercial gelatin at various weight ratios (1:1, 1:5, and 1:10) in 2 ml distilled water, resulting in black coloured jelly. This jelly then undergoes heat treatment at 500 °C or 800 °C under N2 atmosphere at a heating rate of 10 °C min−1. The sample was kept for 1 h in the final temperature, resulting in NCNT (1:1)−500, NCNT (1:5)-500, NCNT (1:10)-500 and NCNT (1:10)-800. For comparison, commercial gelatin without mixing with CNT was directly pyrolysed under a similar condition for NCNT preparation at 500 °C and 800 °C and denoted as Gelatin-500 and Gelatin-800.
Thermal analysis of commercial gelatin was conducted by thermal gravimetric analyser (TGA, Q50). The measurement of weight loss and derivative weight during measurement was performed by heating the samples in N2 gas at a rate of 10 °C min−1 up to 800 °C. The crystallinity of the as-pyrolysed samples was examined by x-ray diffraction (XRD, PANalytical Empyrean) operating at 35 mA and 40 kV. BET specific surface area of the samples was measured using Micromeritics ASAP 2400 instrument. X-ray photoelectron spectroscopy (XPS, Thermo Scientific) was performed using x-ray source (Al-Kα ) to confirm the elemental surface characteristic and composition on NCNTs.
Electrochemical measurement was performed in a three-electrode cell system, using silver/silver chloride reference electrode and platinum as counter electrode. NCNT was dispersed in a mixture of ethanol, water, and nafion to form a homogenous ink solution. The working electrode was prepared by dropping the ink solution into glassy carbon. ORR activity was investigated using cyclic voltammetry (CV) technique using 0.1 M HClO4 solution as electrolyte and saturated with O2 and argon gas. All CV data derived in the aqueous electrolyte was obtained at a scan rate of 5 mV s−1 with a potential window of 0.15–1.0 V versus reversible hydrogen electrode (RHE).
3. Result and discussion
3.1. Effect of gelatin composition
Before the synthesis of nitrogen-doped carbon nanotube, the thermal properties of gelatin were examined using TGA, as shown in figure 1. A significant weight reduction can be observed at temperature range of 300 °C–500 °C, corresponding to gelatin decomposition. However, there is not much weight change above 500 °C, suggesting that the nitrogen doping using gelatin could be carried out well at 500 °C or above.

Figure 1. Thermal gravimetry analysis of gelatin.
Download figure:
Standard image High-resolution imageVarious synthetic conditions, including CNT to gelatin ratio and pyrolysis temperature, were analysed by XRD to examine the phase structure of the as-synthesised materials (figure 2). The XRD pattern of pristine CNT and pyrolysed gelatin only was also presented for comparison. Pyrolysing gelatin at different temperatures results in the difference in crystallinity. The Gelatin-800 shows higher crystallinity, with the presence of peaks between 2θ of 40°–50°. In a previous study by Seehra et al those peaks assigned for 2H and 3 R carbon phases were composed of multilayer graphene from ABAB and ABCA arrangements [32]. This suggests that heating carbon precursors at high temperatures may lead to the change of arrangement stacking of the graphene layer [33], indicating that different temperature treatments of gelatin may lead to different doping structures. Meanwhile, XRD patterns (figure 2(A)) of various CNT to gelatin ratios from 1:1 to 1:10 pyrolysed at 500 °C show a decreasing crystallinity trend with the increase of gelatin loading, as shown by the broader peaks at 2θ of 24.6°. This is likely related to the incomplete gelatin decomposition forming disordered amorphous carbon structure on the CNT surface, as suggested by the similarity to XRD patterns of Gelatin-500. At a pyrolysed temperature of 800 °C, the N-doped sample shows even higher crystallinity than NCNT-500 (figure 2(B)) with two apparent peaks at 2θ of 24.6° and 42° corresponding to (002) and (100) planes, respectively.
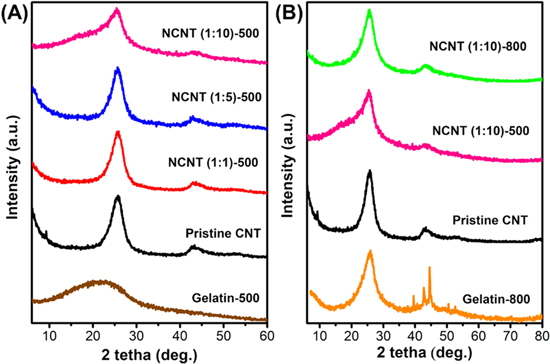
Figure 2. XRD patterns of the N-doped CNT in (A) different CNT:gelatin ratios and (B) different pyrolysis temperatures at CNT to gelatin ratio 1:10.
Download figure:
Standard image High-resolution image3.2. Effect of pyrolysis temperature
Specific surface area and SEM analysis were performed to better understand the morphology change at different pyrolysis temperatures. As reported in table 1, the specific surface area of NCNT (1:10) pyrolysed at 800 °C (183.35 m2 g−1) is larger than the specific surface area of NCNT (1:10)-500 (34.10 m2 g−1). While the measured pore volume of NCNT (1:10)-500 and NCNT (1:10)-800 is 0.07 cm3 g−1 and 0.23 cm3 g−1, respectively. The larger specific surface area, as shown from NCNT (1:10)-800, indicates that the increasing pyrolysis temperature may cause further decomposition of gelatin, resulting in higher specific surface area, hence opening larger pore volume. The compact structure of NCNT (1:10)-500 was validated by SEM image analysis (figure 3), which revealed incomplete gelatin degradation between the bundles of tubes. On the other hand, NCNT (1:10)-800 showed rather more apparent CNT bundles, indicating that the increasing pyrolysis temperature causes further decomposition of gelatin precursor.
Table 1. Specific surface area, pore-volume, and pore diameter analysis of pristine CNT and NCNT samples.
| Sample | Specific surface area (m2 g−1) | Pore volume (cm3 g−1) | Pore diameter (Å) |
|---|---|---|---|
| Pristine-CNT | 313.1 | 1.04 | 133.06 |
| NCNT (1:10)-500 | 34.1 | 0.07 | 87.03 |
| NCNT (1:10)-800 | 183.4 | 0.23 | 50.90 |

Figure 3. SEM image comparison of (A) pristine-CNT, (B) NCNT (1:10)-500, and (C) NCNT (1:10)-800.
Download figure:
Standard image High-resolution image3.3. XPS analysis of N-doped CNT composition
The three different samples (pristine CNT, NCNT (1:10)-500, and NCNT (1:10)-800) were analysed by XPS to examine the carbon, oxygen, and nitrogen content due to the pyrolysis temperature. Figure 4(A) shows a wide scan survey XPS of the sample NCNT (1:10)-500 and NCNT (1:10)-800. XPS of those sample shows three peaks in 285, 400, and 531 eV, which are the peaks of C1s, N1s, and O1s, respectively [34]. Meanwhile the pristine CNT samples only show peaks of C1s and O1s, without N1s peak.
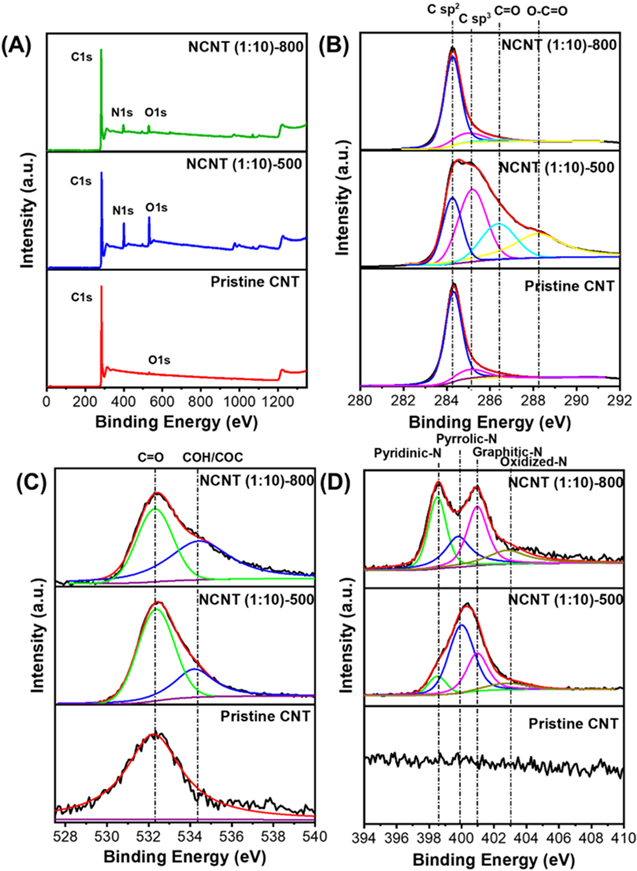
Figure 4. (A) Wide scan survey and high-resolution XPS spectra of the pristine CNT and NCNT at different pyrolysis temperatures. (B) the C1s spectrum of CNT, (C) O1s spectrum, and (D) N1s spectrum.
Download figure:
Standard image High-resolution imageC1s XPS spectra scan the changes on the CNT surface. Pristine CNT C1s peak consists of mainly C sp2 located at 284.3 eV. After nitrogen doping, we could see that NCNT (1:10)-500 shows additional peaks centered at 285.1 eV, 286.7 eV and 288.4 eV, attributed to sp3 hybridised amorphous carbon (C sp3) and oxygen functionalised carbon (C=O and O–C=O), respectively (figure 4(B)). This indicates that pyrolysing at 500 °C results in incomplete residual gelatin decomposition to form amorphous carbon with oxygen-rich structure. However, further heating at 800 °C shows a significant decrease in peaks related to C sp3 and C–O. Elemental analysis of CNT and NCNT has been tabulated in table 2. It is clearly shown that increasing the pyrolysis temperature results in smaller N and O-content. A decreasing amount of nitrogen and oxygen is caused by gelatin decomposition at higher temperatures, resulting in more stable nitrogen [35]. Figure 4(C) shows that NCNT (1:10)-500 has a peak at 531.4 eV, which is oxygen from the carboxylic group, on NCNT (1:10)-800 two peaks were detected at 531.4 eV and 534.1 eV corresponding to oxygen from the functional groups C=O and O–C=O, respectively [36].
Table 2. Elemental content based on XPS analysis.
| Sample | Elemental content (%) | ||
|---|---|---|---|
| C1s | N1s | O1s | |
| Pristine-CNT | 99.3 | — | 0.70 |
| NCNT (1:10)-500 | 79.67 | 11 | 8.97 |
| NCNT (1:10)-800 | 92.43 | 4.03 | 3.90 |
N-doped CNT sample consisted of four peaks at N1s spectrum area, namely pyridinic-N (398.5 eV), pyrrolic-N (399.9 eV), graphitic-N (401.0 eV), and oxidised-N (402.8 eV). Pyridinic-N has sp2-hybridised nitrogen connected to two carbon atoms, pyrrolic-N has pentagonal pyrrolic nitrogen, and graphitic-N has nitrogen substituting carbon atom in the carbon network [30]. From figure 4(D), the pristine sample shows no peak of nitrogen bond observed. Pyridinic-N, pyrrolic-N, and graphitic-N have all been observed in the pyrolysing sample at temperatures to 500 °C. This suggests that nitrogen might be introduced to the CNT structure. Further increasing temperature to 800 °C leads to the higher intensity of pyridinic-N peak and graphitic-N while decreasing pyrrolic-N. This shows that more N bonds were introduced to the CNT structure as we proposed in the mechanism in figure 5. The XPS spectra results have shown that the doping process by gelatin decomposition has been successfully achieved.

Figure 5. N-doped CNT different pyrolysis temperature mechanism. Green, blue and pink represent pyridinic-N, pyrrolic-N, and graphitic-N.
Download figure:
Standard image High-resolution imageIn their research of synthesising 3D N-doped graphene, Lin et al pointed out that calcination of precursor N mixed with graphene precursor above 500 °C could transform pyrrolic-N to pyridinic-N and graphitic-N [37]. Guo et al explained that active sites of N-carbon doped materials are from carbon atoms with a Lewis base adjacent to pyridinic-N [38]. Due to lone pair electron with sp2 hybridisation, the presence of pyridinic-N also enhances electron-donating capability and effectively weakens the oxygen bond during oxygen reduction reaction [17]. Nam et al reported the use of glycine for nitrogen doping agent of ketjenblack at various annealing temperatures (800 °C, 900 °C, and 1000 °C). They found a similar trend, where the N-content would decrease, and the ORR activity would increase with the increasing annealing temperature [30].
Raman analysis of pristine and doped CNTs was carried out to study the defective structures of the samples (figure 6). Several peaks can be observed from the fitting (deconvolution) analysis from the Raman spectra. The peaks at ∼1350 and 1580 cm−1 represent D-band and G-band, respectively. The D-band is correlated to the A1g in-plane breathing vibration mode occurring at the edges of sp2-hybridised carbon domains. This band can be explained as a disordered-induced feature due to defects in graphene sheets [39]. The G-band is referred to the sp2-hybridised carbon atoms within the graphite layers due to the graphite lattice's E2g in-plane vibration mode. In addition, a small peak at 1500 cm−1 is referred to as the Gamorph-band, related to the presence of amorphous carbon which contributes to broadening peak in both G and D bands [40].
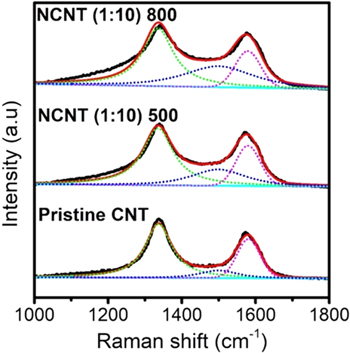
Figure 6. Raman spectra analysis of the pristine CNT and NCNT samples.
Download figure:
Standard image High-resolution imageBy doping nitrogen using gelatin, we can observe the ID/IG ratio changes. Pristine-CNT, NCNT (1:10)−500, and NCNT (1:10)-800 have ID/IG ratio of 2.3, 2.7, and 2.9, respectively. This indicates that N-doped CNTs have more defective structures than pristine CNTs. As can be seen in the proposed mechanism in figure 6, the defectiveness in the graphene layer is caused by more nitrogen structure doped in disrupted graphene framework. In addition, the decomposition of N-graphitic framework in N-CNTs at higher temperature can lead to N-pyridinic formation, which increased the structure defectiveness in the graphene layer as the lateral dimension decreased.
CV at voltage range of 0.15–1.0 V was performed to get better understanding of the role of nitrogen doping for oxygen reduction activity (figure 7). Three different CNTs were analysed, and the voltammogram data suggests that NCNT (1:10)-800 has the best oxygen reduction activity compared to pristine CNT and NCNT (1:10)-500. The similarity in ORR performance between pristine-CNT and NCN (1:10)-500 suggests that the active site for the ORR is likely related to the presence of the pyridinic-N, confirming that the N-content is not entirely related to the catalytic activity.

Figure 7. CV analysis of N-doped CNT different pyrolysis temperature mechanism (the black and red lines represent CV conducted under Ar and O2 saturated, respectively).
Download figure:
Standard image High-resolution image
4. Conclusion
Preparation of nitrogen-doped CNT was conducted by pyrolysing a mixture of CNT and gelatin in water solvents. The sample CNT to gelatin ratio of 1:10 at the pyrolysis temperature of 500 °C results in combinations of spectra between pristine CNT and Gelatin-500. Nitrogen-doped on CNT causes a decrease in specific surface area of 313.05 m2 g−1 (pristine-CNT) to 34.10 (NCNT (1:10)-500) and 183.35 m2 g−1 (NCNT (1:10)-800). High temperature treatment results in a decrease of nitrogen doped in CNTs with a composition of 11% in NCNT (1:10)-500 and 4.03% in NCNT (1:10)-800. N-doped CNT NCNT (1:10)-500 produces graphitic-N and pyrrolic-N configurations, while NCNT (1:10)-800 produces nitrogen configurations in graphitic-N and pyridinic-N configurations. It indicates that different annealing treatments affect the surface structure of the as-synthesised N-doped CNTs. Increasing the annealing temperatures tends to remove the basal hexagonal carbon, thus promoting the formation of pyridinic-N over the graphitic-N bond and resulting in a higher defect structure of CNT. Nitrogen in graphitic and pyridinic configuration, which is present at the higher pyrolysis temperature, has higher ORR electrocatalyst activity.
Acknowledgments
We would like to gratefully acknowledge all staff of the Chemical Engineering Laboratory of Universitas Pertamina and Physical Chemistry Laboratory of Universitas Gadjah Mada. This work was funded by the Hibah Tahunan Universitas Pertamina.