


Abstract
In this study, Fe2TiO5-TiO2 heterostructured composites (FTO-Ti) were synthesised via a simple combination of the sol-gel and hydrothermal methods in a neutral medium of water. Various techniques were used to investigate the characteristics of the FTO-Ti samples, including X-ray diffraction (XRD), Raman spectroscopy, Fourier transform infrared spectroscopy (FTIR), Brunauer-Emmett-Teller adsorption (BET), scanning electron microscopy (SEM), transmission electron microscopy (TEM), UV-Vis diffuse reflectance spectroscopy (DRS), and point of zero charges (PZC). Compared to TiO2, the combination of FTO and TiO2 significantly reduces crystal and particle size and increases surface area six-fold, while simultaneously reducing the band gap energy of the catalyst and extending the region of photon absorption zone toward visible wavelengths (407 versus 395 nm). The photocatalytic activity of the FTO-Ti samples was studied using the batch method for the photodegradation of cinnamic acid (CA). The FTO content was found to strongly influence the photocatalytic performance of the FTO-Ti composites. Of the samples studied, 10% FTO-TiO2 nanocomposite exhibits the highest activity for CA decomposition. In the optimum conditions, its maximum 90 min CA conversion reaches 89.0%, which is much higher than both bare Fe2TiO5 (8.5%) and TiO2 (74.8%). Moreover, the catalyst can easily be recovered and reused for at least eight reaction cycles. The results show that hybridising the small band gap Fe2TiO5 pseudobrookite with a large band gap TiO2 semiconductor is a promising approach for the fabrication of highly active photocatalysts.
Export citation and abstract BibTeX RIS
1. Introduction
The presence of persistent organic pollutants (POPs) in water is a severe issue of major concern. POPs are usually aromatic cyclic hydrocarbons, polycyclic condensing compounds, and organic chlorides that are highly toxic to organisms and humans. Phenolic acids are a group of POPs that are resistant to biological treatment, making them pollutants of particular concern [1]. These compounds are difficult to degrade and are toxic for most of the micro-organisms present in water [2]. Cinnamic acid (CA) is as an ideal substrate to use in place of the major constituents of agricultural products and industrial effluents, particularly from the oil and chemical industries. The effluent from these industries tends to be non-toxic but highly polluting [3].
The removal of phenolic acids, including CA, by chemical and biological means has been investigated extensively [4]. Among chemical methods, advanced oxidation processes (AOPs) stand out as a practical technology for stimulating oxidation, virtually eliminating POPs in the aqueous phase, with high efficiency even in small concentrations [5]. The effectiveness of AOPs depends on the generation of reactive free radicals. Free radical species are atoms or molecules that are capable of independent existence and possess one or more unpaired electrons, such as a superoxide radical ( ), hydroperoxyl radical (
 ), hydroxyl radical (·OH), and alkoxyl radical (RO·). Of these various radicals, the hydroxyl radical (·OH) is thought to play a central role in AOPs for wastewater treatment [5]. Among UV-based AOPs, photocatalysis is seen as an attractive technology in POP removal [6]. It can degrade organic species at room temperature, does not incur high operational costs, is highly effective in processing low-concentration contaminants, and can exploit the abundance of energy from sunlight. Given these advantages, photocatalysis warrants study and has the potential to be applied widely.
TiO2 is the best choice for commercial photocatalysts because of its high level of photocatalytic activity under UV irradiation, as well as its chemical and thermal stability, non-toxicity, appropriate band gap energy, ready availability, and low cost [7–9]. In our previous publication [10], TiO2 was prepared in different media: acidic, neutral, and basic. The results have been reflected in rules to control the composition, properties, and photocatalytic activity of TiO2 catalysts. Research results show that in the most favourable conditions (acidic environment of pH 3.8), the photocatalytic oxidation of CA with various kinds of TiO2 was in the order TiO2 (acid) > TiO2 (neutral) > TiO2 (base). A TiO2 sample prepared in a neutral medium of water has lower activity than the samples prepared in acid medium because of its pure anatase phase composition, smaller surface area (13.8 m2 g−1), and higher PZC value (7.14). However, this TiO2 sample is of interest because of its environmentally friendly preparation method. To use this kind of TiO2 as a photocatalyst, it is necessary to develop modified TiO2-based materials which absorb UV-visible light and prevent electron hole recombination.
As shown by Tu et al in [11], the band gap of semiconductors such as TiO2 can be modified by using variable valence transition metal ions. The visible light absorption of TiO2 can be enhanced by doping this wide band gap semiconductor with a narrow band gap semiconductor, such as vanadium oxide [12], tungsten trioxide (WO3) [13], or iron-oxide(s) [14, 15]. TiO2 doped with V2O5 nanocrystals has a very low band gap (1.96 eV), which is less than un-doped V2O5 (2.2 eV). This is believed to be related to lattice expansion by the Ti ion and formation of oxygen vacancies within the band gap, which act as intermediate energy states and reduce the optical band gap. Tungsten is a suitable dopant for TiO2 thanks to its low band gap (2.75 eV) [13] and its ionic radii being nearly equal to those of Ti (IV), easing substitution. Furthermore, W acts as an electron trap [16], which separates the excited electron-pair, prohibiting pair recombination. Moreover, the presence of W6+ ions introduces a new energy level to the catalyst, which may lead to expansion of the absorption edge to the visible zone [17], critically improving the visible light photodegradation of 2-chlorophenol [18].
Fe oxides have been used as TiO2 dopants because of their small band gap (2.2 eV for α-Fe2O3) [19, 20], low cost, and non-toxicity, as reported in previous studies [21, 22]. The research results show that doping TiO2 with FeOx is an effective way of reducing band gap energy, with a redshift in photon absorption and increased visible light absorption compared to bare TiO2, leading to an acceleration in the degradation of p-xylene in the gas phase [23] and of humic acid [24], phenol [25], and 4-chlorophenol [26] in water.
Iron(iii) titanates are considered highly promising broadband light converters because they have smaller optical band gaps than TiO2 because of the incorporation of Fe 3d orbitals that locate at lower energy than Ti 3d orbitals while maintaining similar effective carrier masses to TiO2. Among iron(iii) titanates, Fe2TiO5 is expected to be a highly promising material [27]. Fe2TiO5, a hybrid of TiO2 and Fe2O3, has a narrow band gap (Eg approx. 2.0–2.2 eV) that absorbs light in the visible spectrum, like Fe2O3 [28–31]. Fe2TiO5 exhibits intermediate behaviour with a desirable optical band gap compared to α-Fe2O3 and electronic transport compared to anatase TiO2 [32]. It is thus expected to be an excellent substitute for TiO2 in many potential applications, including photodegradation [33]. These highly promising features can help overcome the drawbacks of low carrier mobility and poor solar absorptivity of hematite (Fe2O3) and anatase TiO2, respectively [33]. Also, Fe2TiO5 is an inexpensive, non-toxic material with high chemical stability that is available in nature and suitable for research into practical applications in wastewater treatment technology on an industrial scale. Furthermore, Fe2TiO5 has unique magnetic properties, making it easy to recover and reuse catalysts, leading to cost savings when using photocatalysts. Compared to TiO2, Fe2TiO5 can minimise the recombination of photonic electron holes in photocatalytic photo-oxidation [34], and can make use of the energy of the visible photon region to activate and increase migration to the surface of photosynthetic electron holes [35]. However, photocatalytic activity in the removal of POPs by pure Fe2TiO5 is relatively low, so modification of Fe2TiO5 needs to be considered [36].
To address these issues, one approach is to create a heterostructure catalyst based on TiO2. The electronic and atomic structures of Fe2TiO5 are a good match with TiO2 [37–39], allowing separation of the photogenerated hole carriers; thus, recombination of photogenerated electrons and holes can be suppressed, facilitating transport to hydroxyl groups on the particle surface [40].
Lou et al. [36] studied the heterostructure of hollow nanospheres of Fe2TiO5-TiO2 in the photodegradation of rhodamine B (RhB) under illumination with visible light. A catalyst content of 40 wt% of Fe2TiO5 combined with P25 (FT4) was found to have the highest activity, with RhB decomposition efficiency much higher than that of pure P25 or Fe2TiO5. The enhanced activity is the result of excellent crystalline compatibility, small grain size, single-layer distribution, and the greater band alignment of TiO2 and Fe2TiO5.
Thus, the Fe2TiO5-TiO2 (FTO-Ti) hybrid system is highly promising; however, there have been few studies of the synthesis of such systems, especially in environmentally friendly conditions and with use as a photocatalyst for POP degradation. In this study, Fe2TiO5-TiO2 heterostructured nanocomposites with different ratios were prepared by combining the sol-gel and hydrothermal methods to overcome the weaknesses and promote the advantages of both bare catalysts. Furthermore, the medium used in the synthesis of hybrid materials was water, giving it an environmental advantage. The physico-chemical characteristics of the catalysts were studied and catalytic activity was investigated with cinnamic acid photodegradation, a typical persistent POP.
2. Experimental
Pseudobrookite Fe2TiO5 was synthesised using a sol-gel method, as follows: first, 4.04 grams of Fe(NO3)3.9H2O (Xilong, >98.5%) and 2.10 grams of C6H8O7.H2O (Aldrich, >99%) were dissolved in 5 mL of ethanol (Prolabo, >95%) with stirring at 300 rpm and maintained for 1 hour to form a homogeneous mixture. Next, 3 ml of Ti(OC3H7)4 (Aldrich, >97%) was added drop-by-drop with stirring for 1 hour to form a transparent gel mixture. In this step, the whole system was placed in a closed chamber and made inert by blowing nitrogen gas at a flow rate of 24 l h−1. The synthetic gel was dried at 60 °C for 24 hours. Finally, the dry gel was heated at 700 °C for 2 hours to obtain a Fe2TiO5 sample, denoted as FTO.
The hybrid Fe2TiO5-TiO2 materials in different ratios were synthesised according to the following procedure: 3 ml of Ti(OC3H7)4 was added drop-by-drop to the distilled water with stirring for 30 min at 300 rpm; this step was also performed in an inert and closed chamber. Next, milligrams of Fe2TiO5 synthesised in the above process was added into the solution. The mixture was then hydrated in a steel-lined Teflon container at 160 °C for 12 hours. The solids were then filtered and washed 3 times with distilled water and ethanol. Subsequently, the solids were dried at 60 °C for 12 hours to obtain Fe2TiO5-TiO2 in different ratios. The catalysts were denoted as xFTO-Ti, representing the FTO content of the hybrid catalysts; x = 10, 20, 30, and 40 wt%.
The physical-chemical characteristics of the samples were studied using the different methods detailed in our previous study [41], including: X-ray diffraction on a Bruker D2 Phaser X-Ray diffractometer with Cu Kα radiation and recorded in 2θ = 10–80°; Raman spectra on a laser Raman spectrometer (Invia, Renishaw, UK); nitrogen adsorption-desorption isotherms on a Nova 2200e instrument; field emission scanning electron microscopy on a Hitachi S4800 instrument; EDX spectrum on a JEOL JST-IT 200 instrument; transmission electron microscopy on a JEOL JEM 1400 instrument; Fourier transform infrared spectrum on a Tensor 27 Bruker instrument with a range of 400 to 4000 cm–1; UV-Vis spectrum on a Jasco V-550 instrument with a range of 200 to 1200 nm; and point of zero charge (PZC) by the salt addition method.
The photocatalytic activity of the samples was studied by the batch method in the photo-decomposition of CA (Aldrich, >99.9%) as described in our previous study [42]. The 250 ml of CA solution (50 mg l−1) was stirred in the dark for 40 min with analysis of the catalyst content in order to reach adsorption-desorption equilibrium. Subsequently, the mixture was irradiated by 36 UV-A Engin LZ1-00 U600 lamps concentrated at a light wave of 365 nm. The reaction solution was separated by filtration and analysed using a UV-visible spectrophotometer (UV-1800, Shimadzu) at 272 nm. The influence of the operation parameters was investigated, including FTO/TiO2 ratios (10/90, 20/80, 30/70, 40/60); airflow rate (0.0, 0.1, 0.3, and 0.5 l min−1); catalyst dosage (0.50, 0.75, 1.00, and 1.25 g l−1); and initial pH of the solution (3.0, 3.8, 5.0, 7.0, and 9.0). The recyclability of catalysts was tested at the optimised conditions in 10 reaction batches. The CA solution was removed at the end of each batch and replaced by a fresh CA solution to test the photocatalytic reactions.
3. Results and discussion
3.1. Characterisation of the catalysts
The XRD pattern of the FTO samples (figure 1(a)) shows diffraction peaks of pseudobrookite Fe2TiO5 that appear at 2θ = 18.2°; 25.7°; 27.6°; 32.7°; 37.5°; 40.6°; 46.3°; 49.0°; 52.5°; and 60.1° (JCPDS#41-1432). The peaks at 18.2°; 25.7°; 27.6°; 32.7°; 37.5°; 52.5°; and 60.1° correspond to the (200), (101), (230), (131), (060) and (531) lattice directions of the pseudobrookite Fe2TiO5 structure, respectively. Figure 1 shows the appearance of peaks of the TiO2 anatase phase at 2θ = 25.5°; 36.7°; and 49.3° (JCPDS#21-1272) and the rutile phase at 2θ = 27.3°; 36.1°; 41.5°; 54.5°; 56.4°; 61.9°; 62.7°; 68.4°; and 69.6° (JCPDS#21-1276), but no peaks of Fe2O3 were observed. Meanwhile the composition of TiO2 (w) synthesised in a water medium is pure anatase (2θ = 25.6°, 38.2°, 48.3° and 54.7°) with a crystal size of 34.8 nm, as shown in previous research [10]. For the FTO-Ti samples, XRD analysis shows that the Fe2TiO5 peaks appear with the strongest intensity at 2θ = 25.1°, the TiO2 anatase peak at 25.5°, and the very weak intensity peaks of the rutile phase at 27.2° and 36.3°. There are slightly right peak shifts for the Fe2TiO5 pseudobrookite phase in the hybrid sample compared with the pure Fe2TiO5, which shows that in general, the crystal structures of TiO2 and FTO are conserved in the hybrid system and there is only a weak interaction between them.
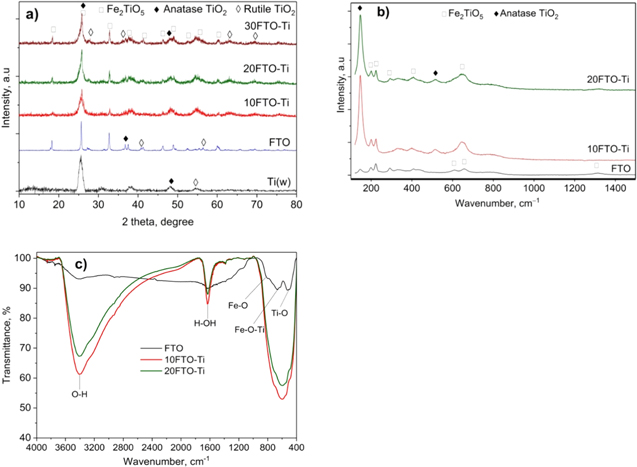
Figure 1. (a) XRD patterns, (b) Raman spectra, (c) and FT-IR spectra of FTO-Ti catalysts.
Download figure:
Standard image High-resolution imageThe intensity of the peaks for FTO and TiO2 in the composite is much weaker than for the parent FTO and TiO2, which shows that when adding FTO in combination with TiO2, the crystallisation of both TiO2 and FTO is poor. However, as can be seen in figure 1, with increasing FTO content, the intensity of the characteristic peaks of FTO increases; this indicates that the FTO crystals exist independently in the sample but are split into small particles by TiO2 crystals. This result matches a previous report [32] when assuming that Fe2TiO5 is maintained when combined with TiO2. The reduction in crystallisation of the anatase phase in the heterostructured samples is often accompanied by an increase in defects, which is beneficial to obstructing the recombination of photogenerated charges [43].
On the XRD pattern, the most intensive peaks of TiO2 anatase (25.5°) and FTO (25.7°) almost overlap, and so the existence of TiO2 anatase phase cannot be confirmed. Additional information regarding the crystalline structure was obtained through Raman spectroscopy (figure 1(b)), which shows the characteristic peaks for the anatase phase at wave numbers 147, 200, 395, 514, and 647 cm–1 [44]. These vertices include the Eg peaks at 147, 200, and 647 cm–1, Ag at 514 cm–1, and B1g at 395 cm–1. Asymmetric stretching oscillations are noted as Eg , while asymmetrical and symmetrical flexural vibrations are seen as peaks B1g and Ag . Meanwhile, on the Raman spectrum of the Fe2TiO5 sample, a characteristic peak for TiO2 in the rutile phase appears weakly at 612 cm–1 [45]. In addition, several Raman peaks characteristic of Fe2TiO5 could be observed at 200, 223, 330, 407 and 657 cm–1 (ID R140974 spectra from the RRUFF database) [46, 47]. No peak for FeTiO3 appears in the Raman spectroscopy, showing that Fe in catalysis exists solely as pseudobrookite. It can therefore be concluded that during the synthesis of pseudobrookite, most of the anatase remains, but some is transformed to rutile, confirming the XRD analysis.
The FTIR spectra of the catalysts (figure 1(c)) exhibit fluctuations at 3406 cm–1 for the surface OH group and at about 1633 cm– 1 for the H-OH group. In addition, two absorption bands at 818 cm–1 and 518 cm–1 could be attributed to vibrations in the (FeO6) octahedra [27]. The absorption band of the oscillation of the Ti-O bond can be seen at 675 cm–1. The absorption peak at around 432 cm−1 could be due to the vertically aligned Ti–O stretching vibrations of the (TiO6) octahedra [48]. All the results confirm the presence of TiO2 and pseudobrookite Fe2TiO5 in the catalyst [49]. In addition, the signal strength of the OH and H-OH groups as well as the Fe-O and Ti-O bonds of the Fe2TiO5-TiO2 hybrid samples is much stronger compared to pure Fe2TiO5. As is known, the surface hydroxyl groups and adsorbed water could be trapped by the photogenerated holes to form hydroxyl radicals and minimise the electron hole recombination that enhances photocatalytic activity. Therefore, it is likely that the hybrid catalyst will exhibit higher activity in CA photodegradation.
The Raman, XRD and FTIR analysis results confirm the existence of TiO2 anatase and Fe2TiO5 phases; however, their crystallinity is poor compared with single-component samples. In the hybrid samples, the Fe2TiO5 and TiO2 crystals are interlaced and divided from each other to form highly dispersed particles. Indeed, the crystal size of TiO2 anatase decreases from 34.8 nm in the pure TiO2 sample to 28.5–31.5 nm in the hybrid sample. The crystal size of FTO follows the same trend, decreasing from 31.6 nm in pure FTO to 26.4–27.1 nm in FTO-Ti catalyst, as shown in table 1. The general trend that can be seen in table 1 is that the crystal sizes of both the TiO2 anatase and Fe2TiO5 phases increase as the FTO content in the composite increases. Specifically, the crystal sizes of TiO2 are 28.5, 29.7 and 31.5 nm, and the FTO crystal sizes are 26.4, 26.9 and 27.1 nm, respectively, for the 10FTO-Ti, 20FTO-Ti, and 30FTO-Ti samples.
Table 1. Characteristics of the catalysts: Values of surface specific area (SBET), pore volume (Vpore), average pore diameter (dpore), anatase TiO2 crystal size calculated at 2θ = 25.8o (dTi) and Fe2TiO5 at 2θ = 32.7° (dFTO), band gap energy (Eg ) and absorbable wavelength (λ).
| Samples | SBET, m2 g−1 | Vpore, ml g−1 | dpore, Å | dTi, nm | dFTO, nm | Eg , eV | λ, nm |
|---|---|---|---|---|---|---|---|
| Ti(w) [10] | 13.8 | 0.010 | 22.4 | 34.8 | — | 3.14 | 395 |
| FTO | 11.5 | 0.007 | 18.0 | — | 31.6 | 1.9 | 653 |
| 10FTO-Ti | 96.0 | 0.059 | 19.6 | 28.5 | 26.4 | 3.05 | 407 |
| 20FTO-Ti | 86.3 | 0.053 | 20.0 | 29.7 | 26.9 | 3.05 | 407 |
All the samples, including the hybrid catalysts, are single-pore mesoporous materials with pore diameters ranging from 10 to 60 nm, as confirmed from pore size distribution analysis (figure S1 (available online at stacks.iop.org/ANSN/12/045015/mmedia)). The average pore diameter of the hybrid sample is approximately 20 nm, slightly smaller than that of TiO2 (22.4 nm) but slightly larger than that of FTO (18 nm). This property proves that the heterostructure material consists of tightly connected FTO and TiO2 particles that form a unified system. The similarity in structural properties of Fe2TiO5 and TiO2 facilitates the growth of the lattice-matched Fe2TiO5 on TiO2 [37]. The pore size of the catalysts is larger than the molecular size of cinnamic acid (0.499 nm × 0.945 nm) [50], and this enables CA diffusion deep into the pores.
The SEM images (figure S2) show that the distribution of the catalysts is relatively uniform. The rhombic shape nanoparticles of the Fe2TiO5 sample are about 20 nm in size. Agglomerates of different sizes consisting of smaller particles can be observed in SEM (figure S2) and HRTEM images (figure 2). The bright-field image in figure 2(a) indicates that the FTO sample consists of three or four closely accumulated planes. In addition, HRTEM shows some other crystals with larger sizes, possibly of TiO2 anatase, and rutile.

Figure 2. HRTEM images of (a) FTO and (b) 10FTO-Ti composite.
Download figure:
Standard image High-resolution imageWith the Fe2TiO5-TiO2 samples, the particles become more porous and discrete, with sizes ranging from 20 to 35 nm, as can be seen in the SEM images (figure S2). This phenomenon could be due to the coalescence of small particles of Fe2TiO5 and TiO2 into agglomerates [51]. The morphology is confirmed by HRTEM (figure 2(b)), which shows that the Fe2TiO5 and TiO2 particles are closely intermingled in agglomerates. The HRTEM image of the 10FTO-Ti sample indicates the formation of anatase, rutile, and Fe2TiO5 phases (figure 2(b)). The inset in figure 2(b) demonstrates that TiO2 has three (101), (200), and (004) planes of structured anatase with d-spacings of 0.35, 0.31, and 0.33 nm, respectively. The particle size of anatase is estimated to be in the range 10–15 nm. The (111) plane is the majority in the structure of rutile TiO2 with a d-spacing of 0.29 nm, reaching 15–20 nm in nanoparticle size. In addition, the HRTEM images indicate that the formation of particles of Fe2TiO5 was exposed to anatase and rutile of TiO2. The estimated d-spacings of 0.25 and 0.21 nm are assigned to (111) and (023) crystal planes, respectively, of the Fe2TiO5 phase in the 10FTO-Ti sample. The particle size of Fe2TiO5 is estimated to be in the range of 8–10 nm. The surface morphology results from the HRTEM method of the catalyst are fairly well matched with the XRD spectrum of the catalysts. The particle size of TiO2 and Fe2TiO5 inferred from HRTEM images was nearly two times smaller than their crystal size, as determined from the XRD pattern. This result confirms the previous observation that there is a random distribution of TiO2 and FTO particles, leading to the shredding of their crystals. The displacement of Ti4+ ions by Fe3+ ions reduces the overall positive charge in the Fe2TiO5 crystal structure. The O2− negative ions decrease accordingly to compensate for the lost positive charge; the oxygen sites will then be absent, resulting in a loss of Fe-O bonds. This decrease will reduce the overall size of the lattice, thereby significantly reducing the particle size. The HRTEM results confirm the close intermixing distribution of TiO2 and Fe2TiO5 particles in the nanocomposite. Furthermore, HRTEM images demonstrate the existence of Fe2TiO5, anatase, and rutile TiO2 phases in this composite material.
The specific surface area and pore volume of pure TiO2 and FTO samples are low, at 11.5 m2 g−1 and 0.007 cm3 g−1 (as shown in table 1), respectively, for FTO, and 13.8 m2 g−1 and 0.01 cm3 g−1 for pure TiO2. An approximate specific surface value of 11.8 m2 g−1 for Fe2TiO5 was reported by Vasiljevic et al. [52]. By combining FTO with TiO2, these parameters are enhanced significantly. The parameters for the 10FTO-Ti and 20FTO-Ti samples are not very different. Their specific surface area is 96.0 and 86.3 m2 g−1, while the pore volume reaches 0.059 and 0.053 cm3 g−1, respectively (6–8 times higher than the precursors). The sharp increase in specific surface area may be associated with a decrease in crystal size and heterostructure of the hybrid catalyst. The large specific surface area is also beneficial in improving the photocatalytic activity of the semiconductor [36] as there are more active sites on the surface for the reactants.
The elemental composition of FTO and FTO-Ti was determined by EDS analysis. The EDS spectrum of FTO is shown in figure S3(a). The mass percentage of elements Fe, Ti, and O of FTO identified from the EDS spectrum is 43.9%, 28.6%, and 27.6%, respectively, and is consistent with the theoretical mass ratio of Fe2TiO5 (46.7%, 20.0%, 33.3%). The Ti mass composition of the FTO sample is a little higher relative to the theoretical value, and this is attributed to the small amounts of TiO2 anatase and rutile in the sample, as shown by the XRD patterns and Raman spectra. The mass compositions of Fe, Ti, and O in 10FTO-Ti sample of 2.1%, 59.0%, and 38.9%, respectively, are also shown by the EDS spectrum (figure S3(b)). This result is also relatively consistent with the theoretical mass ratio of 4.6%, 56.0% and 39.4%. The results confirm the formation of heterostructured composites.
The UV-Vis absorption spectra of the samples are in figure 3. The band gap energy (Eg ) of semiconductors in general, and the FTO-Ti samples in particular, is calculated using the popular method based on a Tauc plot [53]. The light wavelength threshold can be determined by the following equation:

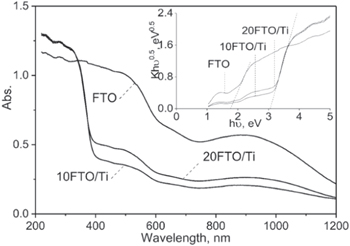
Figure 3. UV-Vis diffuse reflectance spectra and the Tauc plots of the catalysts.
Download figure:
Standard image High-resolution imageThe absorption wavelength (λ) of pure FTO was identified from the Tauc plot as 653 nm, which corresponds to band gap energy (Eg ) at 1.9 eV and is close to the results reported in various studies (Eg approx. 2.1) [27, 52, 54].
The Tauc plot of samples of catalysts indicates that the EG of the 10FTO-Ti and 20FTO-Ti samples is alike at 3.05 eV. Further, the absorption wavelength corresponds to 407 nm. The EG of the FTO-Ti samples is higher than that of the pure FTO sample but lower than that of pure TiO2 (3.14 eV), leading to the extension of the region of higher photon absorption. The effect of the Fe dopant can be explained by enhancement of the O−2p4 → Fe−3d5 electronic transition (t2g) [55]. Unlike the FeOx–TiO2 bi-functional compound, whose UV-VIS spectrum has two light absorption maxima at 382 nm and 526 nm [56], the UV-Vis spectrum of the hybrid material has only one absorption peak with a maximum at 407 nm. This proves that in this study, a uniform heterostructure was formed. The shift of the band of TiO2 to longer wavelengths with the addition of FeOx involves the incorporation of Fe(III) into the TiO2 through Ti–Fe charge transfer bands [56].
From the zeta potential versus the pH of the different solutions indicated in figure S4, the PZC of the 10FTO-Ti composite material was determined to be 6.42, which is lower than that of TiO2(w) (PZC = 7.24) [10] and equal to the PZC of ATO-Ti (6.4) [41].
3.2. Performance of nanocomposites in the photodegradation of cinnamic acid solution
Figure S5 shows that the removal efficiency of CA by the catalysts increased over time. It can be inferred from figure 4 that TiO2 is much more active than FTO. With pure TiO2, the 60 min degradation of CA reaches 67.1% (and X90 = 74.8%); with pure FTO this value is only 5.0% (X90 = 8.5%). However, when replacing 10% TiO2 with FTO, a hybrid catalyst 10FTO-Ti is created which possesses superior activity. All the hybrid catalysts exhibit higher activity than FTO, and the two catalysts containing 10% and 20% FTO show higher activity than TiO2. These results underline the effectiveness of the hybridisation of FTO and TiO2. The heterostructure catalyst offers outstanding features, such as small crystal size, high specific surface area and pore volume, low band gap energy, and suppression of the recombination of photo-generated electrons and holes [40] to enhance photocatalytic activity. However, the catalytic activity of composite catalysts rises with increasing TiO2 mass, which is the highly active ingredient for CA degradation by the hybrid catalyst. Specifically, when reducing the TiO2 content in the FTO-Ti samples from 90% to 80%, 70% and 60%, CA removal efficiency reduces: the 60 min conversion of CA (X60) reduces from 76.4% to 69.9%, 57.7% and 47.1%, and the 90 min removal efficiency (X90) decreases from 89.0% to 61.0%, as shown in figures 4 and S5. Therefore, 10FTO-Ti is the best catalyst to explore further in the next section. The higher activity of the 10FTO-Ti catalyst is most likely due to the smallest crystal size, largest specific surface area and pore volume, highest density of the –OH group and adsorbed water, as well as low band gap energy among the hybrid catalysts.

Figure 4. CA removal efficiency for 60 min (X60) in a photocatalytic reaction on the synthesised catalysts at pH = 3.8, Ccat = 0.75 g l−1, Qair = 0.3 L min−1, and T = 25 °C.
Download figure:
Standard image High-resolution imageFigure 5(a) shows that the conversion of CA increases significantly when the air flow rate is increased from 0.0 to 0.3 l min−1; and 90 min CA conversion increases from 70.6% to 89.0%. However, when increasing air flow rate up to 0.5 l min−1, the CA conversion is reduced to 69.4%. Dissolved oxygen plays an important role in the photocatalytic reaction by ensuring that there are sufficient electron scavengers present to trap the excited conduction-band electrons from the recombination [57]. However, at high air velocity, foaming occurs, and this impedes the absorption of light by the catalyst particles; also, catalyst particles move to the liquid surface and are dispersed in the bubbles. It was found that less of the catalyst participated in the reaction, and this reduced catalytic efficiency [58, 59]. Hence, an air flow rate value of 0.3 l min−1 is the most suitable for CA photodegradation.

Figure 5. The effects of the conditions for the photocatalytic degradation of CA on 10FTO-Ti nanocomposite at T = 25°C: (a) Effect of the airflow rate (pH = 3.8, Ccat = 0.75 g l‒1; (b) the catalyst dosage (pH = 3.8, Qair = 0.3 L min‒1); and (c) the initial pH solution (Ccat = 0.75 g L‒1, Qair = 0.3 l min‒1).
Download figure:
Standard image High-resolution imageAs can be seen from figure 5(b), when the catalyst dosage increases from 0.5 g l−1 to 0.75 g l−1, CA conversion at all durations increases significantly, and the CA conversion after 90 min increases from 77.3% to 89.0%. In fact, the efficiency of photodegradation is improved with an increase in catalyst concentration. This improvement can be attributed to increasing active sites by providing more catalyst, which is the semiconductor in the reaction [60]. Consequently, the formation of electron hole pairs on the surface of semiconductors and the high reactive hydroxyl radicals increases, which can deeply oxidise all of the organic molecules adsorbed on the surface of a semiconductor to non-toxic species such as CO2 and H2O [61]. However, increasing the catalyst dosage further to 1.0 g l−1, the 90 min conversion of CA is almost unchanged and then decreases to 85.2% as the catalyst content reaches 1.25 g l−1. The lower degradation efficiency at higher catalyst dosage is attributed to the high turbidity of the solution. When the amount of catalyst increases above a saturation level, the excess FTO-Ti particles have a light-screening effect that reduces the catalyst surface area exposed to light illumination and the efficiency of photodegradation [62, 63]. Thus, FTO-Ti content of 0.75 g l−1 was chosen as the most suitable.
The value of X90 gradually decreases from 89.0% to 15.9% as the initial pH of the reaction solution gradually increases from 3.8 to 9.0 (figure 5(c)). Chen et al. [64] reported that an acidic environment is more suitable for photooxidation, and this can be explained based on the results of the point of zero charges of the 10FTO-Ti catalyst (being 6.42). At a solution pH that is less than the PZC, the catalytic surface will be positively charged with H+ ions, which should be able to combine with O2- radicals to generate  radicals [65, 66]. On the other hand, according to the authors [67], an alkaline environment with a high pH significantly reduces the transmission capacity of ions in the reactive solution and reduces the possibility of beneficial free radicals forming. Thus, a pH value of 3.8 supports photodegradation with the 10FTO-Ti catalyst. In summary, the optimum conditions for the 10FTO-Ti catalyst in degrading CA comprised an initial solution pH of 3.8, an air flow rate of 0.3 l min−1, and a catalyst dosage of 0.75 g l−1. In these conditions, 89.0% of the CA is converted after 90 min.
The activity of the 10FTO-Ti catalyst in the photocatalytic degradation of CA gradually decreases in successive reaction batches (figure 6). During the first eight cycles, CA conversion decreased by several percentage points each cycle, and X90 decreased in total by 18.8%, from 89.0% to 70.2% after the first eight cycles. However, in the last two cycles, the value of X90 dropped to 61.1%. The decrease in catalytic activity is due to the adsorption of the agents and the byproducts of the photochemical process onto the catalyst surface [68]. These surfaces become covered, reducing the adsorption of the substances as well as the potential for exposure to the activated photons required for the reaction. The XRD results of the spent catalyst (figure S6) after the reaction show that the crystalline phases of FTO and TiO2 anatase still exist. However, the crystallinity and intensity of this sample are lower than those of the fresh catalyst.

Figure 6. The recyclability of 10FTO-Ti catalyst in CA photodegradation.
Download figure:
Standard image High-resolution image
To date, few publications have considered the activity of titanate-TiO2 composite for the photodegradation of POPs in water. In our previous studies, heterostructure Al2TiO5-TiO2 catalysts were synthesised by a sol-gel-based hydrothermal method in acidic (ATO-Ti(a)) [42] and neutral conditions (ATO-Ti(w)) [41] with different TiO2 contents. Compared with the corresponding bare titanium oxide (TiO2) as well as with Al2TiO5 (ATO), the hybrid catalysts of optimal composition [33ATO-Ti(a) and 67ATO-Ti(w)] were found to exhibit enhanced photocatalytic activity in CA decomposition under ultraviolet light. In the most favourable conditions, the CA removal efficiency of 33ATO-Ti(a) and 67ATO-Ti(w) is 88.5% and 70.1% after 60 min, respectively, which is much higher than the corresponding Al2TiO5 samples (30.4% and 38.0%, respectively) and comparable to the corresponding TiO2 (90.9% and 67.1%). The hybrid catalyst prepared in a neutral medium [67ATO-Ti(w)] has slightly lower activity than the catalyst fabricated in an acid medium [33ATO-Ti(a)]; however, the use of water as the medium in the synthesis of hybrid materials ATO-Ti has an environmental benefit. Compared with the 67ATO-Ti(w) sample [41], which was also prepared in a neutral aqueous medium, the 10FTO-Ti sample was more active, with a 60 min CA conversion of 76.4% compared with 70.1% in favourable conditions for the 67ATO-Ti(w) and 10FTO-Ti samples. Yunchan Park et al. [69] synthesised Al2TiO5-TiO2 using a nanoparticle deposition system; when combining two catalysts with a composition of 50:50, the conversion rate for methylene blue photodegradation efficiency was found to be about 90% after 7 hours of ultraviolet (UV) irradiation. The highest decolonisation efficiency of rhodamine B (RhB) in visible light in the presence of a catalyst 40 wt% of Fe2TiO5 combined with P25 is about 96% after 60 min [36]; however, it should be noted that in this paper, catalytic activity in the mineralisation of RhB was not evaluated.
4. Conclusion
A highly active photocatalyst was fabricated by hybridising small band gap pseudobrookite Fe2TiO5 with TiO2 via a simple and environmentally friendly method. The heterostructure catalyst FTO-Ti offers outstanding features, such as a six-time higher specific surface area and pore volume, small crystal size, and low band gap energy. It also suppresses the recombination of photogenerated electrons and holes that enhance the photocatalytic performance of the TiO2 catalyst, while the structure and phase composition of the components remain unchanged. The research showed that FTO concentration has a significant influence on the performance of hybrid photocatalyst in CA photodecomposition. The highest degradation rate catalyst comprised 10 wt% FTO-Ti. In the optimum conditions (airflow of 0.3 l min−1, catalyst concentration of 0.75 g l−1, and initial pH solution of 3.8) the maximum CA conversion after 90 min is 89.0%, which is much higher than the values for FTO (8.5%) or TiO2 (74.8%). Furthermore, the hybrid catalyst is easily recovered and reused.
Acknowledgments
This research was supported by Vietnam Academy of Science and Technology under the grant No. DLTE00.09/20-21.