

Abstract
This paper presents a summary of our results on studies of synthesis and biomedical application of optical nanoparticles. Gold, dye-doped silica based and core–shell multifunctional multilayer (SiO2/Au, Fe3O4/SiO2, Fe3O4/SiO2/Au) water-monodispersed nanoparticles were synthesized by chemical route and surface modified with proteins and biocompatible chemical reagents. The particles were conjugated with antibody or aptamer for specific detecting and imaging bacteria and cancer cells. The photothermal effects of gold nanoshells (SiO2/Au and Fe3O4/SiO2/Au) on cells and tissues were investigated. The nano silver substrates were developed for surface enhanced Raman scattering (SERS) spectroscopy to detect melamine.
Export citation and abstract BibTeX RIS

Original content from this work may be used under the terms of the Creative Commons Attribution 3.0 licence. Any further distribution of this work must maintain attribution to the author(s) and the title of the work, journal citation and DOI.
1. Introduction
Nanoparticles (quantum dots [1–3], upconverting nanophosphors [4–6], polymeric [7–9], metallic [10–26] and magnetic [27, 28]) have attracted significant attention in the field of biomedical applications over recent decades, triggering numerous research interests in evaluating their biological sensing [10, 13], drug delivery [12, 13], cancer therapy [12, 16–20], and molecular imaging abilities [10, 14–17, 29]. Among the various kinds of available nanoparticles (NPs), metallic nanoparticles (mainly gold) have attracted great scientific and technological interest due to their ease of synthesis, chemical stability, and unique optical properties related with the localized surface plasmon resonance (LSPR). The technology of gold [30–32] and silver [33] NPs synthesis has developed rapidly in the last 10–15 years, beginning from the well-known colloidal gold nanospheres, nanorods, or silica/gold nanoshells, and ending with different morphologies such as nanorice, nanostars, or nanocages [34, 35], having many advantages for biosensing, imaging, and controlled release. Newly, multifunctional compact hybrid gold nanoshells, ranging from 'hard' semiconductor quantum dots, to superparamagnetic NPs, to 'soft' liposomes, are in the process of development. This new generation of nanoplasmonic probes provides promising strategic agents to efficiently diagnose and treat cancers due to their low photobleaching, tunable surface plasmon resonance properties, strong absorption in near-infrared (NIR) region, and high photothermal energy conversion efficiency. The strong NIR light absorption characteristics provide for gold nanoparticles (AuNPs) a great potential application in photothermal therapy (PTT) with high selectivity, excellent efficacy. The possibility to combine the diagnosis and therapy creates the new health care modality named as theranostics that may offer great advantages in disease management and prognosis.
One of the criteria for nano biological probes is being non-toxic. However, many nano probes have long-term toxicity issues that obstruct the progress of their efficiency for long-term use in vivo. Recently, interest has been generated in the use of new silica-based nanoparticles for different bioapplications. Silica and silica-based nanoparticles have several attributes that facilitate their use as a platform for an ideal nanoprobe [36–41]. The silica-based nanoparticles can be easily synthesized in a cost-effective manner, using microemulsion medium and ambient conditions. These materials are inert, optically transparent, non-antigenic, resistant to bioenvironment and can be conjugated with any fluorophore type, leading to the generation of robust, fluorescent nanoparticles [4, 5, 38]. The surface of silica particles facilitates different methods of surface modifications and allows conjugation of various biomolecules such as proteins and nucleic acids. In recent years, silica-based nanoparticles doped with organic dyes have been widely used in many applications such as gene delivery, photodynamic therapy, and other photonics areas [31, 42–47]. Actually, the silica-based nanoparticles conjugated with a NIR fluorophore DY776 and radiolabelled with iodine-124 (124I), also with multiple NIR fluorofores for both flow cytometry and in vivo imaging were fabricated. The biodistribution demonstrates the use of these NIR dyes and 124I conjugated silica-based nanoparticles as promising probes for safe in vivo bioimaging. These nanoparticles facilitate optical bioimaging in the NIR window, with maximum tissue penetration of light and minimum background signal [44, 47]. The in vivo studies indicate that these novel silica based nanoparticles are biocompatible and not toxic to whole organisms, and have potential for the development of in vivo and long-term applications [47].
Herein we present our resent research results on studies of synthesis and biomedical application of optical nanoparticles. Water-monodispersed gold, multilayer and dye-doped silica-based fluorescent nanoparticles were synthesized by wet-chemical route and surface modified with proteins and biocompatible chemical reagents. The particles were conjugated with antibody or aptamer for specifically detecting and imaging bacteria and cancer cells. The photothermal effects of gold nanoshells (SiO2/Au and Fe3O4/SiO2/Au) on cells and tissues were investigated. The nano silver substrates were developed for surface enhanced Raman scattering (SERS) spectroscopy to detect melamine.
2. Gold nanoparticles
2.1. Synthesis
The colloidal nano golds were synthesized from metal precursor chloroauric acid (HAuCl4) using trisodium citrate dehydrate (C6H5O7Na3) as reducing and stabilizing agents. The obtained gold nanoparticles (AuNPs) are spherical uniform and well water-monodispersible with the diameter varied from 15–35 nm and optical density (OD) changing from 0.2 to 3.0 (figure 1) [21–25]. The synthesized AuNPs are characterized by UV–vis spectroscopy and transmission electron microscopy (TEM) (figure 2).

Figure 1. Images of fabricated gold nanoparticles (AuNPs): (a) of different concentrations, (b) scanning electron microscopy (SEM) image, (c) size distribution of as-prepared AuNPs, (d) UV–vis absorption spectra of AuNPs newly fabricated (red line, t = 0 m) and after six months of storage (dotted blue line, t = 6 m).
Download figure:
Standard image High-resolution image
Figure 2. (a) UV–vis spectra of colloidal AuNPs (black line) and Au@PEG NPs (red line). (b) Absorbance of Au@PEG-NPs versus PEG concentration at pH = 4. Inset: transmission electron microscope (TEM) image of Au@PEG-NPs, scale bar is 20 nm [21].
Download figure:
Standard image High-resolution image2.2. Biofunctionalization
2.2.1. Protein conjugation
Depending on the following application, AuNPs will be conjugated with different proteins such as: bovine serum albumin (BSA), streptavidin or antibodies, and also heterobiofunctionalized thiol polyethylene glycol acid (HS-PEG-COOH). The minimum amount of protein and PEG required to stabilize AuNPs was determined by applying the surface plasmon resonance absorption assay [21].
2.2.2. Aptamer conjugation
To prepare the aptamer oligonucleotide-coated gold nanoparticles, 7 μM of aptamer oligonucleotide was reduced with DTT (dithiothreitol, Pierce Chemical) for 30 min and added to 0.5 mL of 20 nm colloidal gold nanoparticles (3.5 × 10¹² AuNPs per mL). The conjugate was aged at 4 °C for 24 h, then blocked by PEG. The unreacted residues were removed from the aptamer oligonucleotide-coated gold nanoparticles by centrifugation at 10 000 r m−1 for 5 min. The obtained conjugate was dispersed in tris HCl pH8 buffer. The detailed oligonucleotide coating process is described in another work. The Au aptamer-conjugated NPs are used as signaling probes.
2.3. Toxicological studies
The fabricated BSA and HS-PEG-COOH capped AuNPs were introduced in mice to study their toxicity and availability in the liver. The nano golds did not produce any mortality or any gross behavioral changes in mice at the doses studied, which are 1.16, 2.32, 3.52, 4.68 and 5.84 mg kg−1 in the period of eight days (figure 3). The accumulation of BSA capped AuNPs in liver organs after intravenous multi-injection did not also produce any changes in cell morphology [25].

Figure 3. Weight development of certain mice groups (circles indicate the injection days). Data are presented as mean ±SD [25].
Download figure:
Standard image High-resolution image2.4. Application for diagnostic
2.4.1. Imaging
The aptamers used for cell imaging had following sequence: 5'-AGCCGCGAGGGGAGGGAUAGGGUAGGGCGCGGCU{3'/Thiol Mod C3 S-S}-3'. These aptamers was conjugated with AuNPs to form AptHER2@AuNPs as described above.
The breast cancer cells labeled by specific-HER2 oligonucleotide-colloidal gold conjugate (AptHER2@AuNPs) were efficiently optically imaged (figure 4). Human breast cancer cell line BT-474 and HCT116 cervical cancer cell line (control cells) were provided by Centre for Cancer Applied Research, College of Science (VNUH). Living cells (3.105 CFU) were treated with PEG-coated AuNPs and AptHER2@AuNPs blocked with PEG for 24 h. These cells were then fixed with 4% paraformaldehyde fixative and mounting medium (Invitrogen). Cells were imaged by Nikon Ti-E inverted microscope in dark field mode, objective ×10. Figure 4(a) exhibits the light scattering images of BT-474 and HCT116 cancer cells. Two types of cells have round shapes, some areas within the cells display dim spots due to scattering from the organelles that are distributed in the cells' cytoplasms and membranes. For BT-474 cells, no significant differences between the scattering images of cells in the absence and presence of PEG-coated AuNPs (figures 4(a) and (c), upper panel). Only small and faint dots occurred within the cells, indicating that no or light aggregation occurred in those cells. After incubation with the AptHER2@AuNPs, the incorporated NPs led to the appearance of spotted patterns within the cytoplasms of the cells. Aggregation of the AptHER2@AuNPs resulted in bright scattered spots that allow the ready identification of individual cells (figure 4(b)). BT-474 cells are human breast cancer cell line strongly overexpress c-ErbB-2 protein, so this aggregation of the AptHER2@AuNPs occurred mainly as a result of specific binding through cross-linking with the HER2 antigen receptors present in the cytoplasm of the cells. For the control experiment, no significant differences between the scattering images of HCT116 cells in the absence and presence of PEG-coated AuNPs, also incubated with AptHER2@AuNPs (figure 4 lower panel). This finding suggests that specific interactions occurred between the AptHER2@AuNPs and the HER2 receptors.

Figure 4. Dark field microscope images of BT-474 (upper panel) and HCT116 (lower panel) cancer cells cultured a) in the absence of AptHER2@AuNPs, and in the presence of b) AptHER2@AuNPs and c) Au@PEG-NPs (control) for 24 h. Nikon Ti-E inverted microscope, objective ×20.
Download figure:
Standard image High-resolution image2.4.2. Strip sensor
A strip sandwich type DNA sensor for breast cancer cells detecting was realized using Au-aptamer conjugate as signaling probes. Combining the unique optical properties of gold nanoparticles and the high efficiency of chromatographic separation, sandwich type DNA hybridization reactions were realized on the lateral flow strips. A pair of aptamers capable of specifically binding breast cancer cells is used to prepare the strip sensor. A thiolated short aptamer (Thiol-S2) was immobilized on the AuNPs (Thiol-S2@AuNPs) and sequenced with the specific HER2 complementary aptamer S1(HER2-S1) to form the complex HER2-S1 + Thiol-S2@AuNPs. The biotinylated aptamers (Biotin-TT and Biotin-CR) were immobilized on the test and control zone of the strip. Breast cancer cells interact with aptamer probes of the HER2-S1 + Thiol-S2@AuNPs conjugates to pull out the Thiol-S2@AuNPs from the HER2-S1. The pulled off Thiol-S2@AuNPs continue to migrate along the strip. The captured Thiol-S2@AuNPs conjugation probes on the test zone and control zone of the biosensor produce the characteristic red bands, enabling visual detection of breast cancer antigen samples without instrumentation (figure 5). The aptamers selected to prepare the strip sensor had the following sequence:

Figure 5. Images of test strips using DNA-AuNP signaling probes specific for HER2 receptors. Test strips using DNA-AuNPs signaling probes specific for HER2 receptors. Positive test is BT474 cells at concentration 10 000 cells mL−1 (a). Negative control is HEK293 cells at concentration 10 000 cells mL−1 (b).
Download figure:
Standard image High-resolution imageHER2-S1: 5'-GAGTCAGCCGCGAGGGGAGGGAUAGGGUAGGGCGCGGCU-3',
Thiol-S2: 5'-SH-CGCGGCTGACTC-3',
Biotin-TT: 5'-Biotin-AAAAAGAGTCAGCCGCG-3',
Biotin-CR: 5'-Biotin-AAAAAAGCCGCGCCCT-3'.
The Au-Aptamer conjugate specific to HER2 antigen can be a potential biomarker in a lateral flow biosensor for detecting breast cancer cell.
3. Multilayer multifunctional nanoparticles
3.1. Gold based nanoshells
3.1.1. Synthesis
Multilayer multifunctional gold nanoshells SiO2/Au and magnetic gold nanoshells Fe3O4/SiO2/Au were synthesized by gold ion plating on hydrophilic-functionalized silica or magnetic iron oxide embedded in silica core, using formaldehyde as a reducing reagent.
Gold nanoshells SiO2/Au have silica core size from 40 to 180 nm and gold shell thickness of 10–20 nm, giving a surface plasmon resonance absorption ranging from 550 to 1000 nm. Magnetic gold nanoshells Fe3O4/SiO2/Au size 80–140 nm with silica coated single- or multi-domain superparamagnetic Fe3O4 core and gold shell of 10–20 nm thickness, have surface plasmon resonance absorption variable from 600 to 900 nm (figure 6).

Figure 6. TEM image of core/shells nanoparticles: (a) Fe3O4/SiO2, (b) Fe3O4/SiO2/Au and (c) SiO2/Au. (d) UV–vis absorption spectrum and (e) magnetization curves of Fe3O4/SiO2/Au NPs.
Download figure:
Standard image High-resolution image3.1.2. Theranostic application
3.1.2.1. Imaging
The SiO2/Au gold nanoshells and Fe3O4/SiO2/Au magnetic gold nanoshells were conjugated with monoclonal anti-HER2 antibody to obtain the conjugate nanoparticle@antibody SiO2/Au@HER2 and Fe3 O4/SiO2/Au@HER2. The conjugates SiO2/Au@HER2 and Fe3O4/SiO2/Au@HER2 were used for for specific recognition of breast cancer cells type BT-474 by imaging. The experiment was prepared as described above in paragraph 2.4.1, but the AptHER2@Au conjugates were replaced by SiO2/Au@HER2 and Fe3O4/SiO2/Au@HER2. Figure 7 presents the light scattering images of BT-474. As shown in figure 7(a), the individual BT-474 cells are well imaged by bright scattered spots resulting from the aggregation of the Fe3O4/SiO2/Au@HER2 conjugates, in contrast with the control cells displaying dim spots due to scattering from the organelles (figure 7(b)).

Figure 7. Dark field microscope images of BT- 474 cancer cells cultured (a) in the presence and (b) absence of Fe3O4/SiO2/Au@HER2 conjugates. Nikon Ti-E inverted microscope, objective ×20.
Download figure:
Standard image High-resolution image3.1.2.2. Photothermal effects
The study of the photothermal effect of Fe3O4/SiO2/Au and SiO2/Au nanoshells (NSs) in chicken tissue under near-infrared radiation demonstrates that both nanoshells have a high photothermal transduction efficiency. The temperature of chicken tissue samples reach 48 °C, 46 °C in the presence and 30 °C in the absence of the nanoshells when illuminated by 808 nm laser at power density I = 7.3 W cm−2. The BT-474 cells are destroyed after 20 min irradiation at 808 nm and I = 7.3 W cm−2 (figure 8). The heat transduction efficiency of nanoshells deduced from experimental data was 16% and 22% for Fe3O4/SiO2/Au and SiO2/Au nanoshells, respectively.

Figure 8. (a) Experimental setup for measurements of temperature in the chicken tissue, (b) UV–vis absorption spectrum obtained from aqueous suspensions of SiO2/Au and Fe3O4/SiO2/Au NSs. (c) Temperature variations of chicken tissue samples with and without AuNSs solutions under the illumination of the laser light at a power density I = 7.3 W cm−2 as function of time. Note that the injected NSs solution has the same optical density. (d) Light microscope image of BT474 cells stained with trypan blue (d): after 20 min irradiation at 808 nm and I = 7.3 W cm−2 (right part of image) and non-irradiated (left part of image). The dead cells have dark color.
Download figure:
Standard image High-resolution imageThe results show the ability of multilayer multifunctional SiO2/Au and Fe3O4/SiO2/Au nanoparticles to work for theranostic applications: they can be used simultaneously as biomarkers and also as therapeutic agents.
3.2. Silver-coated nanospheres
3.2.1. Synthesis
Water-monodispered silica SiO2 nanospheres size varied from 100 to 1000 nm were synthesized by Stober method using triethoxysilane (TEOS) and aminopropyl triethoxysilane (APTEOS) as precursors, ethanol or isopropanol as solvent. Silver nanoparticles of size variable 15–100 nm were reduced onto functionalized silica-spheres surface from silver nitrate with sodium nitrate as reduction agent and stabilizer. The obtained silver-coated nanospheres SiO2@Ag are the silica spheres with the silver nanoparticles attached on their surface, having a broadband plasmon absorption spectra in region 400–700 nm with peak positioned around 500 nm (figure 9). The silver nanoparticle surface can absorb various small organic molecules and can achieve as surface enhancement Raman scattering (SERS) encoded spheres for multi-analysis.

Figure 9. SEM images of (a) silica spheres sized 1000 nm and (b) silver-coated silica 1000 nm spheres; (c) UV–vis absorption spectra of SiO2@Ag nanospheres of different sizes.
Download figure:
Standard image High-resolution image3.2.2. Surface enhanced Raman scattering (SERS) application
The as-prepared nanospheres SiO2@Ag were used as SERS substrates for the detection of melamine in solution at low concentration. Raman spectra were measured for melamine powder and solution at different concentrations. The melamine at different concentration in water was mixed with SiO2@Ag spheres. The obtained solutions then were dispersed onto the glass substrates. These substrates were used to measure the Raman spectra of melamine using laser He-Ne 633 nm as excitation source. As shown in figure 10, melamine solution of 10−7 M L−1 has almost no background SERS interference from 600 to 1000 cm−1. The 687 cm−1 peak, which belongs to the in-plane deformation vibration of triazine ring, increases with increasing amounts of melamine. This peak is consistent with the characteristic band of melamine reported in the literature on silver substrates. It can be seen from figure 10 that melamine at concentration 10−6 M L−1 can be detected by this technique. This work may provide a potential technique in applications to detect low concentration analyte.

Figure 10. SERS spectra of melamine solution at different concentrations: (1) 10−4 M, (2) 10−6 M, (3) 10−7 M recorded using SiO2@Ag as substrate, (4) the response of melamine solution 10−2 M without SiO2@Ag nanospheres.
Download figure:
Standard image High-resolution image3.3. Gold/silver nanostars
The gold/silver bimetallic star shape NPs of size 50–70 nm were synthesized by mixing aqueous HAuCl4 with AgNO3, and then adding a suitable amount of reducing agent, ascorbic acid. The shape of the NPs is controlled by altering the ratio of gold to silver precursors (figure 11). Changing the molar ratio of HAuCl4:AgNO3 led to the star-shaped nanoparticles with reduced thorns and irregularly quasi-spherical gold nanoparticles. The detail results on synthesis and theranostic application of theses NPs will be presented in another work.

Figure 11. Absorption spectra of gold/silver nanostars of different molar ratio of HAuCl4/AgNO3 changing from 9.5 to 10.8 (a) and SEM image of nanostars with molar ratio of HAuCl4/AgNO3 = 10.5 (b).
Download figure:
Standard image High-resolution image4. Silica dye-doped fluorescent nanoparticles
4.1. Synthesis
Rhodamine B (RB), rhodamine 6 G (R6G), coumarin and fluorescein isothiocyanate (FITC) dye-doped silica based NPs synthesized by microemultion and Stober method using alkoxit silic precursors such as methyltriethoxysilane (MTEOS), aminopropyl triethoxysilane (APTEOS). The nanoparticles are uniform highly mono-dispersed spheres with diameters in the range of 20–90 nm The surface of NPs was modified with functional groups such as amine-NH2, thiol-SH or carboxyl-COOH using co-hydrolysis of organosilanes with the methyltrimethoxysilicate, propanthioltrimethoxysilyl or disodium 3-[dihydroxy(oxido)silyl]propanoate (DDOS). The synthesized and surface modified DDNPs are watermonodispersed and stable in different biological buffers such as 2-(N-morpholino)ethanesulfonic acid (MES), tris(hydroxymethyl)methylamine (Tris) or phosphate buffered saline (PBS). The photophysical properties of the dyes inside nanoparticles such as photostability, brightness, lifetime and bioenvironmental stability are improved in comparison with those of bare dyes in water. The number of dye molecules is 3940 molecules in 90 nm particles with brightness about 5600 times higher than that of free dye due to the improvement of lifetime of dyes encapsulated in nanoparticles. Figure 12 shows a TEM image of FITC dye-doped silica NPs, the change of emission intensities of RB in water and in NPs at different times.

Figure 12. (a) TEM image of FITC dye-doped silica NPs, (b) emission intensity of RB in water and in NPs versus time. Excitation by He–Ne laser at 543 nm, 3.2 mW cm−2.
Download figure:
Standard image High-resolution image4.2. Biofunctionalization
4.2.1. By proteins
As the AuNPs case, DDNPs will be conjugated with different protein such as bovine serum albumin (BSA), streptavidin or antibodies (Ab) and antibodies. The minimum amount of protein required to stabilize DDNPs was determined by employing the fluorescence assay (figure 13).
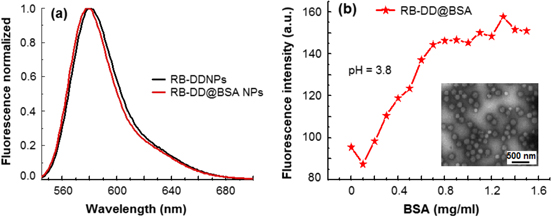
Figure 13. (a) Fluorescence spectra of 80 nm RB-DDNPs and RB-DD@BSA NPs at pH = 6.4. (b) Fluorescence spectra of RB-DD@BSA NPs versus BSA concentration at pH = 3.8. The minimum amount of protein BSA necessary to overcoat the DDNPs is about 0.8 mg mL−1, which is deduced graphically from the concentration at which the fluorescence intensity at pH ∼ 4 becomes nearly constant. Inset: TEM image of RB-DD@BSA NPs, scale bar is 500 nm [37].
Download figure:
Standard image High-resolution image4.2.2. By aptamer
Aptamer-DDNP conjugate (ANPC) has been realized for streptavidin coated FITC doped NPs. Streptavidin coated NPs were conjugated with 5'-Biotin modified breast cancer cells type Erb2B oligonucleotides. The details of conjugation are presented in other work. The RNA oligonucleotides were purchased from Aptagen LLC (USA) having the sequence as follows:
{5'/Biotin}-AGCCGCGAGGGGAGGGAUAGGGUAGGGCGCGGCU-3'
The HER2aptamer-DDNP conjugate was used as fluorescent probe.
4.3. Application
4.3.1. Imaging and quantitative detecting Ecoli 0157:H7 bacteria
The dye-doped silica-based nanoparticles were used for immunolabeling the bacteria E. coli O157:H7 (figure 14). The results show that due to the brightness of nanoparticles, the fluorescence microscope signal of bacteria is amplified. A spectrofluorometer method for rapid quantitative detection of bacteria was proposed.
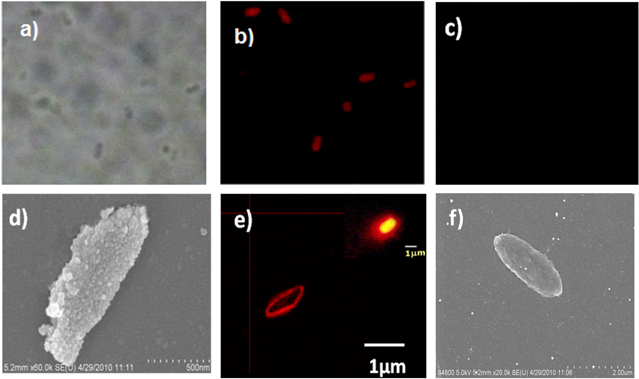
Figure 14. Images of E. coli O157:H7 bacterial cells Transmission (a) and fluorescence (b) microscope images of cells after being incubated with antibody-conjugated nanoparticles and fluorescence microscope image of cells before being incubated with antibody-conjugated nanoparticles (c). The size of images is 46 μm × 46 μm. Scanning electron microscope image of cell incubated with DDONP-Ab complex (d). Fluorescence confocal microscope image of bacterial cell after incubation with DDONP-Ab complex (e). The nanoparticle-based fluorescence signal amplification can be easily seen in a fluorescent image ((e) inset). The bacterial size after (d) is much larger than that before (f) incubation, due to the bound nanoparticles [37].
Download figure:
Standard image High-resolution imageAs is shown in figure 15, the fluorescence intensity of samples is proportional to the number of bacteria in the sample. The curve of fluorescence intensity versus bacterial number can be used as a calibration curve to determine the bacterial number in the sample under analysis. The total time needed for this quantitative analysis is about 3–4 h.

Figure 15. (a) The fluorescence spectra of different bacterial concentration samples; (b) the fluorescence intensity versus the bacterial number (red curve) and fit line (blue line) [24].
Download figure:
Standard image High-resolution image4.3.2. Breast cancer cells imaging and detecting
4.3.2.1. Imaging
The breast cancer cells labeled by anti-HER2 monoclonal antibody–NP conjugates were efficiently optically imaged (figure 16). Humain breast cancer cell line KPL-4, BT-474 and HeLa cervical cancer cell line were provided by Centre for Cancer Applied Research, College of Science (VNUH). Living cells (3.105 CFU) were treated with BSA coated-DDNPs and HER2@DDNPs of 60 nm size (300 μL, 1 μg mL−1) for different period times: 1.5, 3, 6 and 16.5 h at 37 °C. These cells were then fixed with 4% paraformaldehyde fixative and mounting medium (invitrogen). The nucleus was counterstained with Hoechst 33 342 (invitrogen). The multicellular BT-474 spheroids created by hanging drop method (4000 cells/droplets cultured for 8 days) were used to study the ability to penetrate and distribution of nanoparticles targeted system through the cell layer of the spheroid. The BT-474 cells and spheroids were incubated with HER2@DDNPs (2.1010 particles/well) for the time of 6 h, 12 h.

Figure 16. Confocal image of KPL4 living cell treated with (A) BSA@ DDNPs, (B) HER2@DDNPs. (C): Hela cell treated with HER2@DDNPs. The upper panel shows the transmission image and the lower panel shows both the transmission and fluorescence images. Image size: 4.6 μm. Fluorescence images were taken using a Zeiss LSM 510 confocal microscope with an oil immersion ×40 objective lens [36].
Download figure:
Standard image High-resolution imageIt could be clearly seen from the fluorescence imaging that the KPL4 cells labeled with DDNPs emit bright red fluorescence, while all the cellular nuclei stained by DAPI emit blue fluorescence, and DDNPs appeared as bright dots in the membrane and nuclear area of the cells (figure 16(B) lower panel). In contrast, the KPL4 cells treated by DDNPs only and HER2@DDNPs treated Hela cells have quite weak fluorescence images (figures 16(A) and (C) lower panel).
Figure 17 represents the image of cross-section at the different depths of multicellular BT-474 cancer cells spheroids. It can be seen clearly that silica nanoparticles penetrated deep and distributed in different structural classes of multicellular spheroids: at a depth of 82.6 μm, which is equivalent to the thickness of more than 5 cell layers, fluorescence signal was clearly observed with intensity homogeneously distributed from the outer to the core of the spheroid. However, in the deeper layers cut (141.6 μm, 200.6 μm), the fluorescence signal of silica nanoparticles was still observed in a clear and uniform distribution. Even in slices of 141.6 μm, the signal of HER2@DDNPs is still very clear at the border and inside the core of the spheroid BT-474. This proves the ability of HER2@DDNPs to penetrate well into the different cell layers of the multicellular BT-474 spheroids. So the HER2@DDNPs are well suited for the study of the endocytosis of nanoparticles. The DDNPs can be used as the biomarkers for the study of the drug delivery into the spheroids as well as in the cancer tumor.

Figure 17. Transmission (a) and fluorescent images (b)–(e) of a sphere cut layer line BT-474 3D incubated with HER2@DDNPs in 16 h (figure left corner indicates the depth slices). Fluorescence images were taken using a Zeiss LSM 510 confocal microscope with a ×20 objective lens.
Download figure:
Standard image High-resolution image4.3.2.2. Flow cytometry experiments
The ability of specific recognition of KPL4 cells in the mixing of KPL4 (target) and HeLa cell (negative cells) lines was performed by flow cytometry. The results are shown in figure 18. As shown in figures 18(A) and (B), the signal curves from the NPs incubated with either negative or target cells, but in the absence of antibodies, are almost the same and can be considered as background lines with intensities are about 2.5 × 10³. The signal curves of the mixture of Hela/ KPL4 cells in the ratio 1:1 and 5:1, incubated with HER2@AF546 (antibodies HER2 conjugated with alexa fluor 546 (AF546) goat anti-mouse conjugated second antibody (Sigma-Aldrich), are similar to the background, having the intensity about 3.5 and 3.0 × 10³, respectively (figures 18(C) and (D)). Antibodies HER2 conjugated with AF546 goat anti-mouse conjugated second antibody (HER2@AF546).

Figure 18. Flow cytometry analyses using BSA@DDNPs, HER2@DDNPs and HER2@AF546. The curves represent: (A) mixture of Hela and KPL4 cells in the ratio 1:1 only, and incubated with (B) BSA@DDNPs, (C) HER2@AF546 and E) HER2@DDNPs. Mixture of ratio 5:1 incubated with D) HER2@AF546 and F) HER2@DDNPs [36].
Download figure:
Standard image High-resolution imageThis intensity is only slightly higher than that of background, implying that by using the label AF546, it is difficult to specifically discriminate the KPL4 cells from HeLa cells at those concentration ratios. The fluorescence curves of the mixture incubated with HER2@DDNPs have a large enhancement in intensity, about 2 × 10⁴ and 6 × 10³ for the ratios 1:1 and 5:1, respectively. These results show that the KPL4 cells can be specifically detected by using the DDNPs markers, even when the percentage of KPL4 cells is five times less than for Hela cells.
4.3.2.3. Labeling with aptamer-conjugated FITC- DDNPs
The BT-474 cells were incubated with HER2aptamer-DDNP conjugates (2.1010 particles/well) for the time of 6 h, 12 h. The Hela cells were also incubated with the above probes and used as control. BT474 cells were imaged using FITC-doped silica nanoparticles as the vector and HER2-aptamer as the recognition element (figure 19). The cell nuclear was stained with Hoescht 33 342 (Invitrogen).

Figure 19. Fluorescence microscope image of cells incubated with HER2aptamer-DDNP conjugates: (a) BT-474 cells and (b) Hela cells. Image size: 4.6 μm.
Download figure:
Standard image High-resolution image
As shown in figure 19, BT-474 cells incubated with probes exhibit significant green fluorescence of nanoparticles not only on the cell membrane but in cytoplasm surrounding the cell nucleus region. This proves that the HER2aptamer-DDNP conjugates penetrated deep into the cytoplasm of the cell lines that express HER2 receptor. The control shows no labeling of cells, which indicates no nonspecific binding between the cells and NPs. These results show the ability of HER2aptamer-DDNP conjugates to work as probes for fluorescence bioimaging.
5. Conclusion
Three types of water-monodispersed nanoparticles: gold, multilayer and dye-doped silica-based fluorescent, were synthesized by wet-chemical route. The colloidal gold nanoparticles with high concentration size 15–40 nm were synthesized from metal precursor HAuCl4. The dye-doped silica-based size 20–90 nm nanoparticles were synthesized by Stober method using alkoxit silic precursors. The NPs were biofunctionalized by proteins (BSA, SA) and polymer PEG and biocompatible chemical reagents that allow them to function as biomarkers. A simple procedure to determine the minimum amount of BSA and HS-PEG-COOH necessary to coat gold colloidal or dye-doped silica-based NPs was carried-out.
Fabricated BSA and HS-PEG-COOH capped AuNPs were studied for toxicity in vitro and in vivo. The nano golds did not produce any mortality or any gross behavioral changes in cells and mice at the doses studied. The AuNPs were bioconjugated with specific breast cancer antibodies and aptamers-oligonucleotides. The breast cancer cells labeled by anti-HER2 oligonucleotide-coated gold nanoparticles were efficiently optically imaged. An aptamer-based strip sensor was realized for rapidly detecting the breast cancer cells.
Multilayer multifunctional gold nanoshells SiO2/Au and magnetic gold nanoshells Fe3O4/SiO2/Au size 40–180 nm were synthesized by gold ion plating on hydrophilic-functionalized silica or magnetic iron oxide embedded in silica core to form the shell of 10–20 nm thickness. The nanoshells have the surface plasmon resonance absorption ranging from 550 to 1000 nm. The BT-474 breast cancer cells were effectively imaged by complex-probes nanoshell-HER2antibody. These cells also were destroyed after 20 min irradiation at 808 nm with power density I = 7.3 W cm−2. The heat transduction efficiency of nanoshells deduced from experimental data was 16% and 22% for Fe3O4/SiO2/Au and SiO2/Au nanoshells, respectively. The nanoshells show their capability to be used in theranostic bioapplications.
The silver-coated nanospheres SiO2@Ag with size varied from 100 to 1000 nm are the silica spheres with the silver nanoparticles size 15–100 nm attached on their surface, giving a broadband plasmon absorption spectra in region 400–700 nm with peak positioned around 500 nm. The melamine in solution at concentration 10−6 M L−1 was detected using the nanospheres SiO2@Ag as SERS substrates. The results may provide a potential technique in application to detect low concentration analyte.
High-intensity fluorescent dye-doped NPs were combined with specific bacterial, breast cancer antibodies and aptamers-oligonucleotides to form the conjugates-probes. The probes-antibody-conjugated nanoparticles can identify the bacteria E.coli O157:H7. A spectrofluorometer method for rapid quantitative detection of bacteria was proposed. The breast cancer cells labeled by anti-HER2 monoclonal antibody and aptamer-nanoparticles conjugates were efficiently optically imaged and detected with much higher sensibility than by antibody-free dyes. The ability of the dye-doped silica NPs to penetrate well into the different cell layers of the multicellular BT-474 spheroids demonstrates the potential to use them as biomarkers for the study of drug delivery into the spheroids as well as in the cancer tumor. The dye doped silica-based nanoparticles show their capability to work as markers for different bioapplications.
In conclusion, we can say that all three types of optical nanoparticles in this research: dye-doped silica nanoparticles, gold nanoparticles and gold-based nanoshells have the potential to be used as biomarkers for nano-diagnostics and analysis. In particular, the nanoshells are the candidate for theranostic applications. On other hand, the silver-coated nanospheres are the promising substrate for SERS technique in low concentration analysis and single molecule detection.
Acknowledgments
This work was supported by National Project No 01/2/2011/HDD-NCCBUD