
Abstract
A series of Au-doped TiO2 nanoparticles with different Au concentrations were prepared by the sol–gel method using titanium (IV) isopropoxide and tetrachloroaurate (III) trihydrate as precursors. The framework substitution of Au in TiO2 nanoparticles was established by x-ray diffraction (XRD) and Fourier transform infrared (FT-IR) techniques. X-ray diffraction (XRD) and transmission electron microscopy (TEM) image results confirmed the anatase phase and nanocrystalline nature of TiO2–Au. The optical properties revealed an extended tailing of the absorption edge toward the visible region upon Au doping. The incorporation of Au in TiO2 was also confirmed by fluorescence quenching. The increase in Au doping enhanced the 'red-shift' in the UV-Vis absorption spectra. The spectral and nonlinear optical properties were studied using fluence-dependent transmittance measurements in order to reveal the optical limiting mechanism. The nonlinear optical response and optical limiting effects of TiO2–Au nanocomposites dispersed in ethylene glycol were studied at 532 nm using 5 ns Nd:YAG laser pulses. Effective three-photon absorption mechanisms play a major role for good optical limiting characteristics in these nanoparticles and it is seen that the optical nonlinearity enhances with lower threshold as the volume fraction of the Au concentration increased.
Export citation and abstract BibTeX RIS

Content from this work may be used under the terms of the Creative Commons Attribution-NonCommercial-ShareAlike 3.0 licence. Any further distribution of this work must maintain attribution to the author(s) and the title of the work, journal citation and DOI.
1. Introduction
Interest in the development of materials for nonlinear absorption processes has increased during the last decade. These materials with different nonlinear absorption processes (such as saturable absorption, reverse saturable absorption, two-photon absorption and multi-photon absorption) are promising for different applications of science and technology [1–4]. Studies of two-photon absorption (2PA) have been manifested in many important areas, such as frequency-upconverted lasing [5], two-photon photodynamic cancer therapy [6] and optical power limiting [7–9]. The use of higher-order nonlinear absorption processes has been proposed to further improve spatial resolution and light penetration for a given application [10–16]. In this direction, three- and four-photon absorption (3PA and 4PA) processes have been demonstrated for optical power limiting [10, 11] and fluorescence imaging [12–15]. Among the nonlinear optical (NLO) behavior optical limiting, a new research area of applied nonlinear optics is one of the most promising for practical applications, and it is used to protect the human eye and optical sensors from damage caused by intense laser radiation. The basic requirement for a good nonlinear optical material is that it should exhibit high optical quality with large and stable optical nonlinearity in the solid state.
A wide range of materials with various nonlinear optical mechanisms contributing to optical limiting and nonlinear absorption have been investigated [17]. Of the various materials investigated, titanium (IV) oxide (TiO 2) seems to be a suitable material for these application since it exhibits quite interesting properties and is also transparent over a large spectral range with its band gap being around E g =3.2 eV. Potential applications of different nonlinear optical properties of Au nanoparticles (Nps) have attracted the attention of several scientific researchers due to their overwhelming magnitude and fast response. The synthesis of semiconductor-metal nanoparticles has provided a new way to tailor the optical and electronic properties of semiconductor or metal nanoparticles [18]. In this direction, the study of Au nanoparticles embedded in TiO 2 matrix becomes very attractive because TiO 2 presents a high refractive index, and pure TiO 2 exhibits a fast and reasonably large nonlinear optical response [19]. Francois et al [20] studied the effect of particle size on the optical-limiting behavior of gold nanoparticles at 530 nm using picosecond laser pulses. They observed that the threshold of the optical-limiting effect decreased with increasing particle size. Two-photon absorption (2PA) in semiconductor nanoparticles has been widely investigated, but research efforts on their three-photon absorption (3PA) has been limited.
The present paper reports on the observation of nonlinear absorption and optical limiting performance investigated through fluence-dependent transmittance in Au-doped TiO 2 nanoparticles dispersed in ethylene glycol prepared by a sol–gel method using nanosecond laser pulses at a wavelength of 532 nm. In the low fluence region, large particles show relatively better optical limiting compared with smaller ones.
2. Experimental
2.1. Materials and methods
Special grade reagents titanium (IV) isopropoxide (Aldrich Chemicals Ltd, USA), tetrachloroaurate (III) trihydrate (99.99% Aldrich Chemical Company, USA) and glacial acetic acid (SISCO Research Laboratories, India) were used. All chemicals were reagent grade and used without further purification. Ultra pure deionized water was used in all of the preparations.
The typical synthesis procedure for the preparation of Au-doped TiO 2 nanoparticles with different Au (0.1, 0.3, 0.5 and 1.0 mol%) ratios prepared by the sol–gel method [21] is as follows. Initially, 18.6 ml titanium (IV) isopropoxide was hydrolyzed by 35.8 ml glacial acetic acid at 0 °C. 395 ml water was added dropwise under vigorous stirring for 1 h and ultrasonicated for 15 min. To the solution, tetrachloroaurate (III) trihydrate was added and stirring was continued for a further 5 h. The prepared solution was kept in the dark for 24 h for nucleation. After that period, the solution was placed in an oven at 70 °C for 12 h for gelation and aging. The gel was then dried at 100 °C and subsequently the product was crushed into fine powder for further characterization.
During the sol–gel synthesis of Au-doped TiO 2 nanoparticles, a high water ratio was maintained to enhance the nucleophilic attack of water on titanium (IV) isopropoxide and to suppress the fast condensation of titanium (IV) isopropoxide species to yield TiO 2 nanocrystals.
2.2. Characterization
UV-Vis absorption spectra were obtained using a Perkin Elmer Lambda 35 spectrophotometer equipped with an integrating sphere. Fluorescence spectra were recorded using a FluoroMax-2 SPEX spectrofluorometer. FT-IR spectra of the samples were recorded on an FT-IR spectrometer (Nicolet Avatar 360). Energy dispersive x-ray analysis (EDX) studies were carried with a Hitachi S-3400. TEM images were obtained by a JEOL JEM-3010 electron microscope, using an accelerating voltage of 300 kV. The magnifying powers used were 600 and 800 000 times.
2.3. NLO property measurements
Optical limiting properties were investigated from open aperture z-scan experiments with 5 ns laser pulses at 532 nm from a frequency-doubled, Q-switched Nd:YAG laser (Minilite Continuum Inc.). The standard z-scan shown in figure 1 is a widely used technique developed by Sheik-Bahae et al [22] to measure the optical nonlinearity of materials. Samples were prepared by dispersing the nanoparticles in ethylene glycol and the solution was placed in a 1 mm cuvette. The sample remained stable for a long period of time even after exposure to laser pulses. The laser pulses were plane polarized with a Gaussian spatial profile that was focused using a lens and passed through the samples. The beam's propagation direction was taken as the z-axis, and the focal point as z=0. At each position z, the sample experienced a different laser intensity, and the position-dependent (i.e. intensity-dependent) transmission was measured using an energy meter placed after the sample. Laser pulses were fired at a repetition rate of 1 Hz, and data acquisition was automated. The low repetition rate was chosen to avoid thermal accumulation in the samples during measurement. The pulse energy reaching the sample was approximately 100 μJ.

Figure 1 Schematic of the open aperture z-scan experiment.
3. Results and discussion
3.1. UV-Vis absorption spectra
The room temperature absorption spectra of the Au-doped TiO 2 nanoparticles are shown in figure 2. All of the Au-doped TiO 2 exhibited larger absorption in the visible light region with an onset absorption band at 380–400 nm and it showed shoulder peaks in the wavelength range of 450–750 nm. The absorption spectrum of TiO 2 at 400 nm is due to the charge transfer from the valence band (mainly formed by 2p orbitals of the oxide anions) to the conduction band (mainly formed by 3d t 2g orbitals of the Ti 4+ cations) [23]. The shoulder peaks are probably due to the absorption induced by surface plasmon resonance, because the surface plasmon absorption band (SPA) lies in the 630 nm regions for a gold nanocolloid. The broad peaks are due to the large Au particles. The nanoparticles exhibit both semiconductor and metallic behavior. The absorption spectra of the nanocomposites show a red shift slightly as the volume fraction of the Au concentration increases over which a surface plasmon resonance is superimposed. This shift of SPR is due to the change in local dielectric environments.
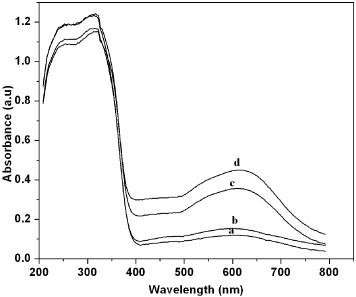
Figure 2 UV-DRS spectra of Au-doped TiO 2 nanoparticles: (a) 0.1, (b) 0.3, (c) 0.5 and (d) 1.0 mol% Au.
The indirect band gap of Au-doped TiO 2 nanoparticles (figure 3) is estimated from the graph of hv versus (αhν)1/2 for the absorption coefficient α.The absorption coefficient α is related to the bandgap Eg as
where hv is the incident photon energy and A is a constant. The energy band gap Eg of the nanoparticles is determined as 3.2 eV (samples a and b) and 3.15 eV (samples c and d) from the above expression. The optical bandgap (Eg ) is found to be composition and there is a decrease in the bandgap of the semiconductor with increase in dopant concentration. Within the range of compositions studied the bandgap is tunable. The doping of various transitional metal ions into TiO 2 could shift its optical absorption edge from the UV into the visible light range, but no prominent change in the TiO 2 band gap was observed [24].

Figure 3 Optical band gap of Au-doped TiO 2 nanoparticles: (a) 0.1 (b) 0.3, (c) 0.5 and (d) 1.0 mol% Au.
3.2. X-ray diffraction
The powder XRD patterns of the Au-doped TiO 2 nanoparticles prepared by homogenous hydrolysis of titanium (IV) isopropoxide are shown in figure 4. All of the patterns are indexed as a single phase of anatase. No diffraction peaks of other polymorphs of titania are observed. All of the nanoparticles give similar patterns without any peak due to the doping of Au. Hence at these loadings, Au particles become uniformly dispersed and therefore do not have adequate dimensions to produce their characteristic patterns. The presence of Au content influences the particle size and with increases in Au the particle size increases. The observed crystallite size of Au-doped TiO 2 nanoparticles calculated from the XRD line broadening were found to be 10, 12.3, 12.8 and 13.6 nm.

Figure 4 XRD patterns of Au-doped TiO 2 nanoparticles: (a) 0.1 (b) 0.3 (c) 0.5 and (d) 1.0 mol% Au.
3.3. EDAX
The quantitative compositional analysis of the Au-doped TiO 2 nanoparticles is analyzed using energy dispersive x-ray (EDAX) spectroscopy measurements. The spectra confirm the presence of Au in the structure, as shown in figure 5. The spectra were recorded from a single nanostructure TiO 2 crystal. From the measurements, it is enumerated that the Au-doped TiO 2 nanoparticles are nearly stoichiometric.

Figure 5 EDAX spectra of Au-doped TiO 2 nanoparticles: (a) 0.1 (b) 0.3 (c) 0.5 and (d) 1.0 mol% Au.
3.4. Fluorescence spectra
Figure 6 shows fluorescence spectra of Au-doped TiO 2 nanoparticles excited at an excitation wavelength of 280 nm measured at room temperature. The spectra show four distinct peaks at about 383, 398, 483 and 494 nm. The first emissions at 383 and 398 nm are attributed to the direct transition from the conduction band to the valence band [25], whereas the latter two at 483 and 494 nm are emission signals originating from the charge transfer transition from an oxygen vacancy trapped electron [26, 27]. For 0.3 and 0.5 mol% Au-doped TiO 2 nanoparticles, the weight % and atomic % of Au are nearly equal, as confirmed by elemental analysis, and hence at these concentrations there is no appreciable change in the observed fluorescence intensity. The intensity of the spectrum decreased as the volume fraction of Au increased from 0.1 and 1.0 mol%. This is because the photoluminescence (PL) emission is the result of radiative recombination of excited electrons and holes, and the lower PL intensity of the Au-doped sample clearly implies a lower recombination rate.

Figure 6 Emission of Au-doped TiO 2 nanoparticles: (a) 0.1 (b) 0.3, (c) 0.5 and (d) 1.0 mol% Au.
3.5. FT-IR Spectra
FT-IR spectra of 0.1, 0.3, 0.5 and 1.0 mol% Au-doped TiO 2 samples are shown in figure 7. It is believed that the absorption peak at 3441 cm −1 is attributed to the O–H stretching vibration and its corresponding O–H bending vibration occurs at 1636 cm −1 due to the chemically adsorbed water molecules [28]. The broad intense band below 1200 cm −1 is due to Ti–O–Ti vibrations. These peaks appear unsymmetrical, which is assigned to the framework of Ti–O–Au vibration. In addition, the surface hydroxyl groups in TiO 2 increase with increasing Au loading, which is confirmed by increasing intensity of the corresponding peaks.

Figure 7 FT-IR spectra of TiO 2 Au-doped TiO 2 nanoparticles: (a) 0.1 (b) 0.3, (c) 0.5 and (d) 1.0 mol% Au.
3.6. Transmission electron microscope
The transmission electron microscopic analysis was carried out to confirm the size of the particles, growth pattern and distribution of the crystallites. A representative TEM image in figure 8(a) shows that most of the particles are well distributed with little concentration of aggregates. The aggregates seen in the picture are composed of fine primary and secondary particles. In general, TiO 2 particles have a strong tendency to agglomerate into larger particles. However, here the agglomeration is somewhat reduced to a small extent, as seen in the TEM images. Figure 8(b) shows the high-resolution TEM image for an individual Au-doped TiO 2 nanoparticles. It is obvious that these samples consist of structurally uniform and highly crystalline areas of nanosized titania. The uniform fringes with lattice spacings of 0.35 nm, corresponding to the (101) anatase phase, were observed over the particle, which clearly endorses that each nanoparticle consists of single anatase grain. The fringes of the doped anatase lattice are expanded and show considerable waviness (indicated by the arrow). These defects are possibly due to electric stress that may exist from metal doping. The particle size of the samples estimated from the TEM micrographs was nearly 8–13 nm. The degree of crystallization of the anatase phase could be confirmed by both the TEM images and the XRD patterns.

Figure 8 TEM micrograph of 0.5 mol% Au-doped TiO 2 nanoparticles.
3.7. Nonlinear optical measurements
Open aperture z-scan measurements were performed on Au-doped TiO 2 nanoparticles to calculate their nonlinear absorption coefficients. Interestingly, the nonlinear transmissions are found to be effectively of the fifth order as it fits to three-photon absorption (3PA) processes. The curve exhibits a normalized transmittance valley, indicating the presence of induced absorption in the colloids. The z-scan measurements of the nanoparticles show reverse saturable absorption (RSA) behaviour, and the transmittance of the sample decreases with increasing laser intensity and reaches the minimum as the sample moves into the beam focus symmetric about the focus (z=0), which indicates that the higher-order nonlinear processes are involved, as seen in the inlet figure 9.

Figure 9 Normalized transmission curves of Au-doped TiO
2 nanoparticles. Insets show open aperture z-scan curves. Circles are data points while solid curves are numerical fits using equation (
The obtained nonlinear behavior was numerically confirmed by fitting the data to the appropriate nonlinear transmission equation given by
where R is the surface reflectivity, p0 is given by 2γ (1−R)2 I0 2 L, γ is the three-photon absorption co-efficient and I0 is the on-axis peak intensity. α is the linear absorption coefficient. A comparison of the theoretical curve with experimental results shows that they are in reasonable coincidence. So, we conclude that the obtained nonlinear behavior is due to effective three-photon absorption in these particles. It can be seen that the absorption nonlinearity remarkably increases by increasing the concentration of Au. The best fit values obtained for γ are 4.39×10⁻²⁴, 7.60×10⁻²⁴, 7.29×10⁻²⁴ and 10.79×10⁻²⁴ m 3 W −2. The enhancement of the measured effective 3PA of Au-doped TiO 2 nanoparticles is a result of the presence of surface plasmon resonance (SPR) in the Au particle. The SPR enhancement is related to the metal dielectric constant, solvent dielectric constant, excitation wavelength and metal particle size.
To study the nonlinear optical (NLO) response and to examine the viability of Au-doped TiO 2 nanoparticles as optical limiters, fluence-dependent light transmission measurements were conducted on the samples. Using the values of the linear and nonlinear (three-photon) absorption coefficients, we obtained the dependences of the normalized transmittance on the intensity of the laser radiation. Figure 9 shows the plots of the normalized transmittance against input fluence for the Au-doped TiO 2 nanoparticles studied at 532 nm. The energy transmittances of these particles remains almost the same at low input fluences and with increasing fluence rate the transmittance begins to decrease continuously. An important term in the optical limiting measurement is the limiting threshold. It is obvious that the lower the optical threshold, the better the optical limiting. Particle size has a significant effect on the limiting performance of TiO 2 colloids. With an increase in particle diameter, the degree of optical limiting is enhanced and the limiting threshold is reduced. From the measured values of γ for the colloids, it can be found that a composite with a larger concentration of Au has a better nonlinear absorber and hence a good optical limiter.
4. Conclusion
The spectral and nonlinear optical properties of Au-doped TiO 2 nanoparticles prepared by sol–gel are investigated. HRTEM studies reveal that the particles are 8–13 nm in size, which is also confirmed by phase analysis using XRD. The nonlinear optical response of these samples using 5 ns laser pulses at 532 nm wavelength shows the existence of an effective three-photon absorption behavior in the observed nonlinearity. It is found that the optical limiting performances of these nanoparticles are greatly enhanced with an increased volume ratio of Au. Increasing the concentration of the Au dopant lowers the limiting threshold and enhances the optical limiting performance. The optical power limiting due to RSA makes Au-doped TiO 2 nanoparticles a potential candidate for the application of broadband optical limiters.
Acknowledgments
The authors would like to thank Dr Reji Philip and Lakshmi N B of the LAMP Group, Raman Research Institute, Bangalore (India), for offering the facility for NLO measurements.