


ABSTRACT
We present the first successful simulation of a neutrino-driven supernova explosion in three dimensions (3D), using the Prometheus-Vertex code with an axis-free Yin–Yang grid and a sophisticated treatment of three-flavor, energy-dependent neutrino transport. The progenitor is a nonrotating, zero-metallicity 9.6  star with an iron core. While in spherical symmetry outward shock acceleration sets in later than 300 ms after bounce, a successful explosion starts at ∼130 ms postbounce in two dimensions (2D). The 3D model explodes at about the same time but with faster shock expansion than in 2D and a more quickly increasing and roughly 10% higher explosion energy of >1050 erg. The more favorable explosion conditions in 3D are explained by lower temperatures and thus reduced neutrino emission in the cooling layer below the gain radius. This moves the gain radius inward and leads to a bigger mass in the gain layer, whose larger recombination energy boosts the explosion energy in 3D. These differences are caused by less coherent, less massive, and less rapid convective downdrafts associated with postshock convection in 3D. The less violent impact of these accretion downflows in the cooling layer produces less shock heating and therefore diminishes energy losses by neutrino emission. We thus have, for the first time, identified a reduced mass accretion rate, lower infall velocities, and a smaller surface filling factor of convective downdrafts as consequences of 3D postshock turbulence that facilitate neutrino-driven explosions and strengthen them compared to the 2D case.
Export citation and abstract BibTeX RIS
1. INTRODUCTION
Modeling the core-collapse supernova (SN) mechanism in three dimensions (3D) is still in its infancy. Generalization from spherical symmetry (1D) to axial symmetry (2D) introduces nonradial flows and hydrodynamic instabilities like convection and the standing accretion shock instability (Blondin et al. 2003) in the neutrino-heated postshock layer, which have been recognized as helpful for the explosion due to improved neutrino-heating conditions and buoyancy or turbulent pressure behind the shock (e.g., Herant et al. 1994; Burrows et al. 1995; Janka & Müller 1996; Murphy & Burrows 2008; Marek & Janka 2009; Müller et al. 2012a, 2012b; Müller et al. 2013; Bruenn et al. 2013, 2014; Murphy et al. 2013; Suwa et al. 2013; Couch & Ott 2014; Müller & Janka 2014a, 2014b; Takiwaki et al. 2014).
Explosions of 2D models, however, start late and their energies tend to be fairly low (except for those of Bruenn et al. 2013, 2014, whose results still need better explanation and confirmation by detailed comparisons with other recent simulations). 3D effects were hoped to improve the situation, but a first optimistic report based on parametrically triggered neutrino-driven explosions by Nordhaus et al. (2010) was not supported by subsequent works (Hanke et al. 2012; Takiwaki et al. 2012, 2014; Couch 2013; Couch & O'Connor 2014; Mezzacappa et al. 2015). Dolence et al. (2013) and Burrows et al. (2012) confessed an error in Nordhaus et al. (2010), nevertheless they still claimed a remaining positive effect in 3D. Turbulent fragmentation by energy cascading from large to small scales, however, seems to disfavor and delay explosions in 3D, because it destroys the biggest convective plumes, which were recognized as helful for 2D explosions (Hanke et al. 2012; Couch 2013; Dolence et al. 2013; Couch & O'Connor 2014). Therefore Abdikamalov et al. (2014) are worried about even less favorable explosion conditions when resolution shortcomings of all current 3D models can be overcome, and Couch & Ott (2013, 2014) advocate pre-collapse progenitor-core asymmetries as possible solution of the dilemma.
Here we present the first successful 3D simulation of a neutrino-driven SN explosion of a 9.6  iron-core star computed fully self-consistently with the neutrino-hydrodynamics code Prometheus-Vertex. We identify, for the first time, consequences of 3D turbulence in the convective gain layer that enhance the explosion energy and accelerate shock expansion in 3D relative to 2D. While so far in more massive progenitors 3D turbulence appears less supportive for the initiation of explosions than 2D flows (cf. references above and Hanke et al. 2013; Tamborra et al. 2014 for 11.2, 20, 27
  models), we investigate here whether 3D can strengthen the explosion after the onset of shock runaway. The considered 9.6
  model offers an ideal case for this study because it explodes at the same time in 2D and 3D. We briefly describe our numerical approach in Section 2, discuss our results in Section 3, and conclude in Section 4.
2. NUMERICAL SETUP AND PROGENITOR MODEL
We performed 1D, 2D, and full (4π) 3D simulations of a nonrotating, zero-metallicity 9.6  , iron-core progenitor provided by A. Heger (2012, private communication), (Woosley & Heger 2015) and previously investigated in 2D by Müller et al. (2013).
We used the Prometheus-Vertex hydrodynamics code with three-flavor, energy-dependent, ray-by-ray-plus (RbR+) neutrino transport including the full set of neutrino reactions and microphysics (Rampp & Janka 2002; Buras et al. 2006) applied in 3D also by Hanke et al. (2013) and Tamborra et al. (2014), in particular the high-density equation of state of Lattimer & Swesty (1991) with a nuclear incompressibility of K = 220 MeV. Our simulations were conducted with a 1D gravity potential (which is unproblematic for nearly spherical explosions) including general relativistic corrections (Marek et al. 2006). For the first time we employed the newly implemented axis-free Yin–Yang grid (Kageyama & Sato 2004). The implementation followed Wongwathanarat et al. (2010) and posed no particular problems for the RbR+ transport. Conservation laws are globally fulfilled with an accuracy of ∼10−3 over several 100 ms for our angular resolution of 2°. The radial grid had a reflecting boundary condition at the coordinate center and an inflow condition at the outer boundary of 109 cm. It had 400 nonequidistant zones initially and was refined in steps up to >600 zones, providing an increasingly better resolution of Δ r/r ∼ 0.01 ... 0.004 around the gain radius. For the neutrino transport 12 geometrically spaced energy bins with an upper bound of 380 MeV were used.
3. SIMULATION RESULTS
The relatively steep density gradient above the iron core enables a neutrino-driven explosion of the 9.6  star at roughly 300 ms after bounce even in 1D (left panels in Figure 3), similar to (but more delayed than) oxygen–neon–magnesium-core progenitors exploding as "electron-capture SNe" (Kitaura et al. 2006; Janka et al. 2008; Fischer et al. 2010). The energy of such a late explosion, however, remains low, only
  erg (Figure 3), because it is provided mainly by the recombination of free nucleons to α-particles and iron-group nuclei in the gain layer (see Scheck et al. 2006) and the corresponding mass at
  ms is only 2.2
  in 1D. Of course, the subsequent neutrino-driven wind from the proto-neutron star (PNS) will increase the power of the explosion. Eexpl denotes the instantaneous "diagnostic energy," which is defined by

Here, ρ is the density, and the volume integration is performed over the postshock region where the total specific energy,

is positive, with e,  , and Φ being the specific internal, kinetic, and (Newtonian) gravitational energies. The bracketed term expresses the difference between the nuclear binding energies per unit mass of all nucleons finally recombined to iron-group nuclei and for the nuclear composition at a given time. It therefore accounts for the maximum release of nuclear binding energy and corresponds to an upper limit of Eexp, while omitting this term yields a lower bound on Eexp (red and blue lines, respectively, in bottom left panel of Figure 3). The binding energy of the stellar layers ahead of the shock plays only a minor role in the energy budget of the explosion because at
  ms it is only −3.5 × 1048 erg in the 1D simulation and even only −9.5 × 1047 erg in our multi-dimensional simulations.
3.1. Explosion Dynamics and Properties: 2D Versus 3D
In 3D convective overturn in the neutrino-heated postshock layer develops at  70 ms, showing the well-known Rayleigh–Taylor mushrooms (Figure 1, left) and increasing nonradial velocities (colors in Figure 2). The postshock convection reaches its maximum activity between about 100 ms and 200 ms after bounce with a prominent maximum at ∼120 ms, at which time the shock starts its accelerated expansion (cf. Figures 2 and 3) and the postshock flow becomes highly turbulent (Figure 1, middle). At
  200 ms the shock and postshock matter expand with ∼25,000 km s−1, and the ejecta attain a nearly self-similar structure (Figure 1, right). This is the time when convection and turbulence behind the shock become weaker again (less intense red in Figure 2) and mass shells leaving the PNS surface indicate that the compact remnant begins to lose material in the low-density, high-entropy baryonic wind driven by neutrino heating above the neutrinosphere.

Figure 1. 3D iso-entropy surfaces at 90, 170, and 350 ms after bounce. Colors represent radial velocities. The supernova shock is visible by a thin surrounding line, the proto-neutron star by a whitish iso-density surface of 1011 g cm−3. The yardstick indicates the rapidly growing volume.
Download figure:
Standard image High-resolution image
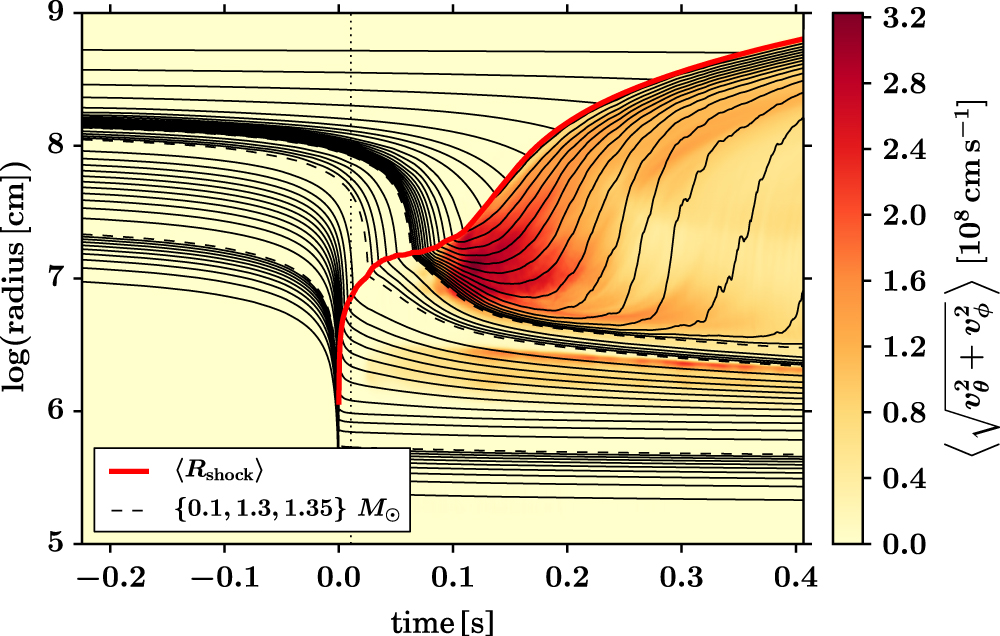
Figure 2. Mass-shell (radii for chosen enclosed masses) evolution of the 3D explosion with colors showing rms values of the nonradial velocity. The red solid line marks the angle-averaged shock radius, the dashed lines separate regions with mass spacings of 0.01, 0.1, 0.01, and 0.001  (from inside outwards). The 3D simulation was started from a 1D model at ∼10 ms after bounce (vertical dotted line).
Download figure:
Standard image High-resolution image
Figure 3. Explosion parameters as functions of post-bounce time. 1D results are displayed by dotted lines, 2D by thin solid lines, and 3D by thick solid lines. Angle-averaged shock radii (upper left); explosion energies with upper limits in red, lower limits in blue (see text) and 3D–2D differences with dashed lines (bottom left); kinetic energies of non-radial mass motions in the gain (red) and cooling layers (blue; upper middle); average specific internal energies in the cooling layer (lower middle); total net neutrino-heating rates in the gain (red) and cooling layers (blue) and neutrino-heating efficiencies (dashed, scaled by a factor of 10; top right); masses in the heating (red) and cooling layers (blue) and difference of angle-averaged gain radii, 
 (dashed; bottom right).
Download figure:
Standard image High-resolution imageIn our multi-dimensional simulations the shock stagnates only for ∼120–130 ms and then expands to  km at 400 ms postbounce (p.b.) compared to only ∼2000 km in the 1D case (Figure 3). Angle-averaged quantities X(r) are computed according to

Positive total energies in the postshock layer develop only shortly after the onset of outward shock acceleration. Interestingly, in 3D the shock expands faster and the explosion energy increases more steeply and to a higher value than in 2D. At  ms the diagnostic energy reaches

in 3D with an increase at a rate of ∼(0.75 ... 1.25) × 1050 erg s−1 due to the PNS wind for the cases of minimal and maximal energy, respectively, whereas it is only ∼(0.67 ... 0.92) × 1050 erg in 2D with a similar growth rate by the PNS-wind power as in 3D.4
While the onset of the explosion in multi-dimensions is aided by buoyant convection, the steeper rise of the explosion energy in 3D can be understood by a smaller net energy-loss rate,  , in the neutrino-cooling layer during 100 ms
  ms (Figure 3).
  is evaluated between the mean gain radius, Rgain, and an inner radius
  , which is (somewhat arbitrarily) defined at an optical depth of 3 for
  (all quantities are evaluated on angle-averaged profiles). In contrast, the integrated net neutrino-heating rate in the gain layer,
  , and the heating efficiency,
  (with
(with  being the direction-averaged luminosities of
  and
and  ), do not exhibit any significant 3D–2D differences (Figure 3).
The reduced energy-loss rate in the cooling layer for 100 ms  ms is associated with a systematically lower specific internal energy,
  , averaged over the cooling-layer mass
  (Figure 3). This suggests lower temperatures in the cooling layer, less efficient neutrino emission, and therefore an inward shift of the gain radius in 3D compared to 2D:
  (Figure 3).
Consequently, the mass of the gain layer,  , is larger and, correspondingly, the mass in the cooling layer,
  , smaller in 3D. While the 3D–2D difference of Mcool varies with time because the definition of R0 depends on model-specific details, the gain-mass difference grows to
  between 100 and 200 ms and remains essentially constant afterwards. The nuclear recombination energy of this mass difference,

for 
 erg g−1 (depending on whether free nucleons recombine to α-particles or iron-group elements) can easily account for the 3D–2D differences of the explosion energy in Figure 3.
Turbulent pressure in the gain layer is understood to be supportive for the onset of neutrino-driven explosions (Murphy et al. 2013; Couch & Ott 2014; Müller & Janka 2014b). However, for our low-mass SN progenitor this effect cannot be crucial for the observed 2D–3D difference. Despite the faster and more energetic explosion, the 3D model exhibits a lower turbulent kinetic energy in the gain layer during the crucial period 100 ms  ms, visible by the nonradial contribution
  in Figure 3. Taking into account the larger mass in the gain layer, it means that the nonradial fluid motions are much less vigorous in the 3D case.
In contrast, the nonradial kinetic energy in the cooling layer,  , is smaller in the 2D simulation despite the higher mass of this layer in 2D. This suggests that nonradial motions are much more efficiently damped by dissipation in stronger deceleration shocks and due to symmetry constraints (reflective axis boundaries) in the cooling layer of the 2D model.
3.2. Detailed Analysis of 2D–3D Flow Differences
The reason for more favorable explosion conditions in 3D becomes clearer through radial profiles of the turbulent accretion flow in the gain and cooling layers (Figures 4 and 5). Here, angular averages of quantities X(r) over infalling matter, i.e., over regions with radial velocity vr < 0, are computed according to

where Θ(x) is the heaviside function with Θ(x) = 1 for  and Θ(x) = 0 otherwise.

Figure 4. Profiles of angle-averaged radial velocities of infalling (vr < 0) matter, outgoing shock (sharp blue–white discontinuity), mean gain radius, Rgain, and inner boundary of cooling layer, R0, as functions of post-bounce time for 2D (top left) and 3D models (bottom left). Time-averaged (over 0.1 s s) radial profiles of angle-averaged downflow velocities,
  , (i.e., of matter with vr < 0; upper middle); mass-infall rates in downflows,
  (bottom middle); "surface filling factors" of downflows,
  (upper right); and angle-averaged specific net neutrino-heating/cooling rates,
  , and 3D–2D temperature difference,
  (bottom right). Thin solid lines show 2D, thick solid lines 3D results, the vertical dotted lines indicate the time-averaged gain radius in 3D.
Download figure:
Standard image High-resolution imageRadial velocity profiles of vr, angle-averaged over convective downdrafts in the postshock accretion layer, exhibit stronger local variations with higher extrema and pronounced intermittency-like behavior in 2D, whereas the angle-averaged infall velocities in the 3D model appear smoother and show less extreme fluctuations (Figure 4, left). This points to a larger number of smaller-scale convective structures, thus reducing the statistical variance, and suggests less vigorous radial mass motions in the 3D model, which is compatible with the lower nonradial kinetic energy in the gain layer between 100 and 200 ms p.b. (cf. Figure 3).
This conclusion is supported by cross-sectional cuts (Figure 5), where narrow convective downflows in 2D possess higher velocities, in agreement with radial profiles of vr averaged over inflows and time-averaged over 100 ms  ms (Figure 4). The higher infall velocities in 2D in the gain layer and a fair part of the cooling layer are associated with a greater mass-accretion rate around the gain radius (Figure 4). Moreover, in 2D a larger fraction of the sphere in the gain layer is subtended by downflows, which is expressed by the "downflow filling factor,"

in Figure 4. In contrast, in the cooling layer  . All these findings are in line with higher kinetic energies of radial and nonradial flows in the gain layer and slightly lower nonradial kinetic energy in the cooling layer for the 2D model (Figure 3).

Figure 5. Cross-sectional cuts with radial velocities in the x–z plane at 0.16 s (left) and 0.18 s after bounce (right) for 2D (left semi-panels) and 3D models (right semi-panels). The mean gain radius, Rgain, is marked by a dashed circle. For better visibility different color scales are used outside and inside of Rgain (left and right color bar, respectively).
Download figure:
Standard image High-resolution imageAt first glance, the higher mass-accretion rate around Rgain in 2D seems to contradict the 2D–3D differences of the flow geometry visible in Figure 5: in 2D one counts one or two prominent convective downdrafts, consistent with a convective cell pattern characterized by low spherical-harmonics modes, i.e., large-scale structures with few downflows. In contrast, many more downflow funnels exist in 3D, although with smaller infall velocities. Nevertheless, the 2D model channels more mass per time through the gain radius. Obviously, the total volume of toroidal "sheets" formed by axi-symmetric (2D) downflows is bigger than the volume encompassed by 3D accretion funnels. Exactly this is expressed by the larger  in the gain layer, which, together with bigger infall velocities, accounts for the higher mass-accretion rate in 2D.
3.3. 3D Turbulence Facilitating Explosion
The reduced rate and less powerful infall of mass through the gain radius is therefore the fundamental reason for more favorable explosion conditions in 3D. Higher downflow velocities in 2D lead to more violent deceleration of the accretion downdrafts in shocks as they penetrate into the cooling layer (see Figure 5 and the more dramatic decrease of  in 2D in Figure 4). On the one hand this causes stronger gravity-wave activity below Rgain, which can be recognized by larger angular variations of vr for the 2D model in this region in Figure 5. On the other hand the impact of downflows dissipates kinetic energy, for which reason the 2D simulation shows a lower kinetic energy of nonradial mass motions in the cooling layer despite its higher nonradial kinetic energy in the heating layer (Figure 3). More important, however, is the enhanced shock heating of the cooling layer, which leads to higher temperatures in this region in 2D (Figure 4). Estimates confirm that this difference of the angle-averaged temperature of several 109 K (or several percent of the local angle-averaged temperature) is responsible for the larger net cooling rate of the 2D model just below Rgain (Figure 4), because local temperature fluctuations are considerably bigger than the relative differences of the angular averages and neutrino emission rates by e±-captures and e+e−-pair annihilation scale with T 6 and T 9, respectively. Consequently, one finds
  during 170 ms
  220 ms (Figure 4, bottom left). Since the temperature in the gain layer is only marginally higher in 3D, the net heating rates between Rgain and shock are hardly distinguishable for 2D and 3D (Figure 4, bottom right).
The 2D–3D differences in the convective postshock layer, in particular higher downflow velocities and larger mass-infall rate in 2D, can be attributed to well-known differences of 2D and 3D turbulence discussed previously (e.g., Burrows et al. 2012; Hanke et al. 2012; Couch 2013; Dolence et al. 2013; Abdikamalov et al. 2014; Couch & O'Connor 2014): turbulent energy cascading leads to fragmentation of large-scale flows to smaller-scale vortices in 3D, whereas the inverse energy cascade in 2D tends to enhance kinetic energy on the largest possible scales. The turbulent fragmentation (e.g., through Kelvin–Helmholtz instability) of the postshock accretion flow affects the flow characteristics most strongly near the gain radius, for which reason 2D–3D differences of  increase as the infalling gas approaches Rgain (Figure 4). Because of enhanced turbulent energy in small-scale vortices, the 3D flow becomes less coherent, and turbulent small-scale structures keep mass in the gain layer and reduce
  , while in 2D the mass-infall rate continues to grow all the way toward Rgain.
4. CONCLUSIONS
Performing simulations of neutrino-driven explosions for a 9.6  star with the Prometheus-Vertex code in 1D and multi-D, we found significant 2D–3D differences of the accretion flow in the convective postshock layer. Turbulent fragmentation to small-scale vortices keeps more matter in the gain layer in 3D and decreases the rate and velocity of mass accretion into the cooling layer. This reduces the dissipation of kinetic energy in the cooling region, lowers the temperature there and decreases the energy loss by neutrino emission. The corresponding inward shift of the gain radius leads to an increase of the mass in the gain layer, whose higher nucleon recombination energy accelerates shock expansion in 3D and boosts the explosion energy by ≳10% to >1050 erg with a steeper rise at the beginning of the explosion.
We thus presented the first successful neutrino-driven explosion in a fully self-consistent 3D simulation and, for the first time, identified effects that foster and strengthen neutrino-driven explosions in 3D compared to 2D. In contrast to the unfavorable influence of 3D turbulence observed in previous studies of more massive stars (e.g., Hanke et al. 2012; Takiwaki et al. 2012, 2014; Couch 2013; Abdikamalov et al. 2014; Couch & O'Connor 2014), the decrease of the mass inflow rate through the gain radius and reduced neutrino-energy loss in the cooling layer below Rgain have a healthy influence on the explosion in our 9.6  progenitor in 3D.
It is difficult to speculate whether these effects could play an important role also for more massive stars, in particular when convection dominates the postshock dynamics (Burrows et al. 2012; Murphy et al. 2013) and current numerical resolution deficiencies (see, e.g., discussions by Hanke et al. 2012; Abdikamalov et al. 2014; Radice et al. 2015) have been overcome. We emphasize that our present grid resolution is insufficient to achieve convergence and to capture fully developed turbulence. However, we attribute our 2D–3D differences to generic differences of convective downflow dynamics, which are likely to remain valid even for higher resolution. We have identified turbulent fragmentation of 3D flows in the gain layer as helpful for stronger explosions than in 2D, in sharp contrast to disadvantageous consequences of 3D effects for the onset of explosions reported for more massive progenitors in previous works. Higher resolution might even enhance our described effects and their explosion-facilitating consequences rather than endangering them.
We thank R. Bollig, J. von Groote, F. Hanke, B. Müller, E. Müller, A. Wongwathanarat, E. Erastova, and M. Rampp for support and discussions and J. Guilet for careful reading and comments. Funding by Deutsche Forschungsgemeinschaft through grants SFB/TR7 and EXC 153 and by the European Union through grant ERC-AdG No. 341157-COCO2CASA and computing time from the European PRACE Initiative on SuperMUC (GCS@LRZ, Germany) and CURIE (GENCI@CEA, France) are acknowledged. Postprocessing was done on Hydra of Rechenzentrum Garching.
Footnotes
- 4
Tests with doubled angular resolution and different seed perturbations revealed ∼4% variations of
 .
.
