


ABSTRACT
We study a confined eruption accompanied by an M1.1 flare in solar active region (AR) NOAA 10767 on 2005 May 27, where a pre-eruptive magnetic flux rope was reported in a nonlinear force-free field (NLFFF) extrapolation. The observations show a strong writhing motion of the erupting structure, suggesting that a flux rope was indeed present and converted some of its twist into writhe in the course of the eruption. Using the NLFFF extrapolation, we calculate the twist of the pre-eruptive flux rope and find that it is in very good agreement with thresholds of the helical kink instability found in numerical simulations. We conclude that the activation and rise of the flux rope were triggered and driven by the instability. Using a potential field extrapolation, we also estimate the height distribution of the decay index of the external magnetic field in the AR 1 hr prior to the eruption. We find that the decay index stays below the threshold for the torus instability for a significant height range above the erupting flux rope. This provides a possible explanation for the confinement of the eruption to the low corona.
Export citation and abstract BibTeX RIS
1. INTRODUCTION
Filament (or prominence) eruptions, coronal mass ejections (CMEs), and flares are different manifestations of large-scale explosive energy release events in the corona (Priest & Forbes 2002). They are closely related to each other, which becomes clear from the magnetic nature of these phenomena. A highly sheared magnetic field or a magnetic flux rope is a favorite configuration both for the support of filament material and for the pre-eruptive phase of CMEs and flares (Antiochos et al. 1994; Török & Kliem 2005; Fan & Gibson 2007). The eruption of this core field is usually traced by filament eruptions, and it stretches the overlying envelope field and forms a current sheet below it (Moore et al. 2001). Magnetic reconnection in the current sheet converts the magnetic energy into kinetic and thermal energies of plasma and particles, which propagate along the reconnected field lines below the reconnection site and generate flare ribbons and "post-flare" loops. Above the reconnection site, a magnetic flux rope is ejected, propels plasma into the interplanetary space, and forms CMEs.
Although filament eruptions, CMEs, and flares are often simultaneously observed, solar eruptions can occur without significant flaring (if the magnetic field in their source region is weak), without a filament (if none has formed in the core field prior to the eruption), or both. Additionally, there are cases where the eruption does not evolve into a CME, so-called confined (or failed) eruptions. It is believed that an eruption is confined if the overlying field is too strong (Moore et al. 2001) or does not drop sufficiently fast with height above the photosphere (Török & Kliem 2005).
While this general scenario for solar eruptions is now widely accepted, there are still some unresolved problems, in particular it is not yet well understood how eruptions are initiated and driven. Accordingly, a variety of physical mechanisms have been suggested and a large number of theoretical models have been developed (for a recent review see, e.g., Aulanier et al. 2010). Although these models have been successful in reproducing essential features of solar eruptions, they mostly still lack quantitative initiation thresholds that could be tested against observations. A noticeable exception are models based on ideal magnetohydrodynamic (MHD) flux rope instabilities. Although thresholds provided by these models are not unique, but depend on the details of the considered configuration, they typically lie within a relatively narrow range, making a comparison with observations or coronal magnetic field extrapolations meaningful.
The helical kink instability (hereafter KI) has been suggested as an initiation mechanism early on, based on the often observed helical deformation of erupting prominences (Sakurai 1976). It requires the presence of a flux rope prior to eruption and occurs if the rope twist exceeds a certain threshold, yielding a helical deformation of the rope by converting some of its twist into writhe (e.g., Török et al. 2010). The critical twist is typically of the order of 1–2 field line windings. For a line-tied, cylindrically symmetric flux rope model, a critical twist angle of 2.5π (1.25 field line windings) has been found analytically by Hood & Priest (1981). For arched flux rope models, being more realistic for the solar corona, Fan & Gibson (2003) and Török et al. (2004) found values of 3.0π and 3.5π, respectively, in numerical simulations. Estimations of magnetic twist exceeding these thresholds were indeed reported for unstable prominences by Vršnak et al. (1991) and Romano et al. (2003). Further evidence for the KI triggering eruptions has been observed for both confined eruptions (e.g., Ji et al. 2003) and CMEs (e.g., Williams et al. 2005).
Although the KI can yield an upward acceleration of a coronal flux rope (Fan & Gibson 2003; Török et al. 2004), it is unlikely to account for the huge expansion of CMEs, i.e., for a full eruption. Based on this limitation and on the fact that the majority of erupting prominences do not exhibit a significant helical deformation, Kliem & Török (2006) suggested the torus instability (hereafter TI) as the main driver of CMEs in their rapid acceleration phase. The instability is driven by the hoop force (or Lorentz self-force) of a bent flux rope. It occurs if the restoring force due to the interaction of the flux rope current with an external magnetic field Bex (the field produces by sources other than the flux rope current) decreases faster during the expansion of the rope than the hoop force itself. The instability threshold is therefore determined by the slope of Bex, which can be quantified by the "decay index,"

where R is the flux rope major radius. The exact threshold depends on a number of factors, but is (if non-circular flux rope shapes are considered as well) expected to lie in the range 1.1 ≲ nc ≲ 2 (Bateman 1978; Kliem & Török 2006; Schrijver et al. 2008; Démoulin & Aulanier 2010). Values of ≈1.5 and ≈1.9 have been found in numerical simulations of the TI for line-tied flux ropes (Török & Kliem 2007; Aulanier et al. 2010, and Fan & Gibson 2007, respectively).
In this Letter, we check the theoretically predicted eruption thresholds for both instabilities in a confined eruption that was accompanied by an M-class flare, using models of the pre-eruptive coronal magnetic field. Such analysis has been done so far only separately for the KI (e.g., Savcheva & van Ballegooijen 2009) and the TI (Liu 2008). A magnetic flux rope present in the source region shortly before the eruption has been found in a nonlinear force-free field (NLFFF) extrapolation by Guo et al. (2010). We use this model to estimate the flux rope twist, and we use a potential field extrapolation to estimate the decay index of the external magnetic field. In the following, we present the observations and describe our analysis in Section 2. Our results are given in Section 3, and we draw our conclusions in Section 4.
2. OBSERVATIONS AND DATA ANALYSIS
The event we study here took place on 2005 May 27 in active region (AR) NOAA 10767. An M1.1 flare occurred between about 11:53 and 12:40 UT (peaked at 12:30 UT). The flare was fully covered by TRACE (Handy et al. 1999) in the 1600 Å band, which is sensitive to temperatures of (4.0–10.0) × 103 K, with a cadence of ∼30 s (Figure 1). The region contained a filament that was observed prior to the flare by THEMIS/MTR (Bommier et al. 2007) as shown in Figure 1(e). Observations of the Stokes profile for the Fe 6302.5 Å line by the same instrument were used by Guo et al. (2010) to derive the vector magnetic field of the region at 10:17 UT, which was then used to perform an NLFFF extrapolation, employing the optimization method (Wheatland et al. 2000; Wiegelmann 2004). The extrapolation revealed the presence of a magnetic flux rope which coincided with the eastern part of the filament (Figure 1(f)), while an arcade configuration was found for the western part of the filament. We refer to Guo et al. (2010) for further details on the extrapolation.

Figure 1. (a)–(c) TRACE 1600 Å images on 2005 May 27 (the gray scale is reversed). Solid, dashed, and dash-dotted contours denote positive and negative polarities, and the polarity inversion line of the line-of-sight magnetic field observed by THEMIS/MTR, respectively. The contours were rotated to the respective times of the TRACE images. R1 and R2 in panel (b) denote the two flare ribbons. (d) The same TRACE image as in panel (c), with the contrast in the top part of the erupting structure being enhanced. The arrows indicate the apparent direction of rotation. (e) The filament observed in the THEMIS/MTR Hα line at 10:17 UT. (f) Magnetic flux rope and some overlying arcade field lines (orange) from the NLFFF extrapolation, overlaid on the Hα image.(An animation and a color version of this figure are available in the online journal.)
Download figure:
Standard image High-resolution imageThe AR started to brighten from the east to the west as shown in Figures 1(a)–(c). We identify two flare ribbons in Figure 1(b). The early brightening region at 12:07 UT (Figure 1(a)) coincided with the location of the extrapolated flux rope. Afterward, the eruption displayed an ascending and helically deforming rope-like structure, whose top part was located in the western part of the AR (Figures 1(c) and (d)). The morphological evolution is a characteristic of the KI, thus supporting the existence of the flux rope found in the NLFFF extrapolation. The apex of the observed rope rotated counterclockwise about the direction of ascent, corresponding to left-handed twist (e.g., Green et al. 2007), which is in agreement with the sign of twist found in the extrapolated flux rope (Guo et al. 2010).
It is apparent that the final position of the top part of the observed rope-like structure was located significantly to the west of the location of the extrapolated flux rope. This may be explained by asymmetries in the overlying field, yielding a strongly nonradial rise of the rope, or by a growth of the flux rope length due to reconnection of sheared arcade fields in the west of the AR during the 2 hr between the extrapolation and the end of the eruption.
The observations suggest that the rise of the flux rope terminated at a relatively low height in the corona, i.e., that the eruption was confined (see the TRACE animation in the online version of the journal, Figure 1). In order to check this, we looked at SOHO/LASCO (Brueckner et al. 1995) data. Two CMEs were observed close to the time of the flare, appearing in the LASCO/C2 field of view at 11:50 and 16:06 UT, respectively. The first one appears somewhat too early to be in line with the flare, and the second one is too late. Furthermore, the apparent angular widths of the two CMEs were 48° and 38°, respectively, while the flare occurred very close to the disk center (located at S08E04), which indicates that the two relatively narrow CMEs did not originate from the flare region. However, it is possible that a CME originating from the disk center is missed by a coronagraph (e.g., Zhang et al. 2010). We therefore also looked at SOHO/EIT (Delaboudinière et al. 1995) data. Unfortunately, the limited data sets available for the day of the flare did not allow clear conclusions. We found no indications for a CME related to the flare in the data available.
In order to check whether the eruption might have been triggered by the KI, we compute the twist of the extrapolated flux rope. Since the rope has no simple symmetry, the commonly used expression for the twist angle of a cylindrically symmetric flux rope is not appropriate here. We therefore use expressions for arbitrary shaped field lines from Berger & Prior (2006). For a smooth axis curve, x, with arbitrary geometry and no self-intersection, the twist density of a secondary curve, y, about the axis is defined by
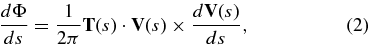
where s is the arc length from an arbitrary starting point on the axis curve, T(s) is a unit vector tangent to x(s), and V(s) is a unit vector normal to T(s) and pointing from x(s) to a point, y(s), on the secondary curve. The twist angle follows from integration along the curve.
In order to study the conditions for the occurrence of the TI, we consider a larger volume of the magnetic field above the AR. To this end, we compute the potential field in a volume of size 635'' × 635'' × 635'', using the Greens function method (Chiu & Hilton 1977). As boundary condition we use the line-of-sight magnetogram observed by SOHO/MDI (Scherrer et al. 1995) at 11:11 UT. Following Fan & Gibson (2007) and Aulanier et al. (2010), we use the potential field (Bp) as a proxy for the external field (Bex), since the latter cannot be straightforwardly derived from the total magnetic field provided by the NLFFF extrapolation.
Figure 2(a) displays the full field of view of the extrapolated potential field, which shows some trans-equatorial field lines connecting NOAA 10767 with NOAA 10766 in the northern hemisphere. Selected field lines from a smaller field of view are overlaid on a TRACE 171 Å image at 11:10 UT in Figure 2(b). The filament can be seen as the dark feature at x ∈ [ − 110'', − 40''], y ∈ [ − 140'', − 100''], constrained by overlying arcade field lines. The potential field lines match the bright TRACE loops well, except for some highly sheared loops in the core of the AR.

Figure 2. (a) Line-of-sight magnetogram obtained by SOHO/MDI. The white magnetic field lines depict the extrapolated potential field. The black rectangle denotes the field of view of panel (b). (b) The TRACE 171 Å image observed at 11:10 UT overlaid with selected field lines.
Download figure:
Standard image High-resolution image3. RESULTS
In order to measure the twist of the extrapolated flux rope, we first have to locate its axis. For this, we assume that the part of the rope between points 1 and 3 in Figure 3(a) is oriented horizontally and tangent to the polarity inversion line. An objective function is defined to evaluate how well these assumptions are fulfilled:
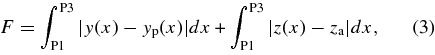
where y(x) and z(x) are the Cartesian coordinates of the projection of a field line on the xy-plane and xz-plane, respectively, yp(x) is the y-component of the polarity inversion line, and za is the average height of a field line. The integration is performed between points 1 and 3. The first term measures how close the projection of a field line on the xy-plane is to the polarity inversion line. The second one measures how close a field line is to its average height. The smaller the F, the better the above assumptions are fulfilled. We calculate 80 × 80 field lines, uniformly distributed over a 2'' × 2'' vertical square that is perpendicular to the polarity inversion line at the approximate center of the flux rope (point 2). We then define the axis as the field line for which F is minimal (shown in black in Figures 3(b)–(d)). The two integrands in Equation (3) are shown for some sample field lines in Figures 3(c) and (d), respectively.

Figure 3. (a) Third-order polynomial (solid curve) fitted to the polarity inversion line (dash-dotted curve) between points 1 and 3. The line segment perpendicular to the polynomial at point 2 represents the projection of a 2'' × 2'' square, which is perpendicular to the bottom surface (for better visuality we stretched the line segment by a factor of 2.5). (b) Sample field lines of the flux rope. The black line depicts the computed axis. (c) Distance along y-direction from the selected field lines to the polarity inversion line. The distribution is only plotted between points 1 and 3. (d) Distance along z-direction from the selected field lines to their average heights.
Download figure:
Standard image High-resolution imageOnce the axis is determined, the twist of a field line about the axis can be calculated by integrating Equation (2) along the axis. We average the twist of the field lines which pass through the 2'' × 2'' square and which are longer than the axis, to quantify the twist of the rope. This average twist is ∼1.8 turns (3.6π in radian). The individual twist of some selected field lines is noted in Figure 3(b). The average twist is comparable to the critical twists for kink-unstable coronal flux ropes of 1.5 and 1.75 turns found by Fan & Gibson (2003) and Török et al. (2004), respectively.
Next, we estimate the onset criterion for the TI. As in previous studies of line-tied flux ropes, we approximate R in Equation (1) by the height above the photosphere, h (see also Török & Kliem 2007; Fan & Gibson 2007; Aulanier et al. 2010). The height distributions of the approximated decay index, ∂ ln Bp/∂ ln h, are plotted in Figure 4 up to a height of 160'', starting from five selected origins at the photosphere which are shown in Figure 1(e). For all locations, the decay index first increases and then decreases with height, reaching a local maximum at h ≈ 40'', before it starts to increase again almost linearly from h ≈ 60''–90''. It can be seen that it stays always below the critical slope of nc ≈ 1.9 found by Fan & Gibson (2007) for all points, and always below nc ≈ 1.5, found by Török & Kliem (2007) and Aulanier et al. (2010), for points 3–5, i.e., in the western part of the AR, where the top part of the erupting structure was observed. Since we do not know the height the erupting structure has reached, we roughly estimate the maximum height required for an erupting flux rope in our event to be susceptible for the TI. This height is reached when the ascending rope has obtained a semi-circular shape (Chen & Krall 2003; Kliem & Török 2006). To do so, we conservatively assume that the pre-eruptive flux rope spanned over the whole area covered by the flare ribbons, which is about 100'' (between R1 and R2 in Figure 1(b)). This yields a maximum height of 50'', far smaller than the height range shown in Figure 4.

Figure 4. Height distributions of the magnetic field decay index, −∂ ln Bp/∂ ln h, from five selected origins as shown in Figure 1(e). The magnetic field is from the potential field extrapolation at 11:11 UT.
Download figure:
Standard image High-resolution image
4. DISCUSSION AND CONCLUSIONS
We investigated the possible roles of ideal MHD flux rope instabilities in a confined eruption, using magnetic field extrapolations obtained from photospheric data taken shortly before the event. The flux rope present in the NLFFF extrapolation had a twist of about 1.8 turns, comparable to threshold values of the KI found in numerical simulations. The decay index of the external magnetic field stayed below the TI threshold found in numerical simulations up to heights of ≈140'' in the area where the erupting structure ascended.
These results indicate the following. First, the eruption was triggered, and initially driven, by the KI. This is supported by the observed rope-like shape of the erupting structure and by its writhing motion. Second, the rising flux rope did not reach a height at which the TI could have been triggered, and therefore did not evolve into a CME. This is supported by the observed confinement of the erupting structure to the low corona. Our results thus support the KI and TI models, but do, of course, not rule out other physical eruption mechanisms which would need to be tested separately.
However, the results presented here should be taken with some caution. First, the instability thresholds are not unique, but lie within certain ranges and can hence vary from event to event. Second, direct measurements of the relevant quantities (flux rope twist and decay index of the external field) are still not available, so that one has to use model approximations of the magnetic field, which are not fully reliable (e.g., DeRosa et al. 2009). For example, in the NLFFF extrapolation used here, the lack of flux-balanced boundary data poses difficulties for the optimization method. As a consequence, the physical elevation of flux rope field lines is different for different vertical grid resolutions, such that the rope is always resolved by only about five grid points in height (see Guo et al. 2010). Therefore, we computed the flux rope twist for different resolutions and always found a value close to the one presented here. We plan to address this problem in a future study, including a comparison with a different extrapolation method.
Despite such limitations, we believe that studies like the one presented here are essential to better constrain the large number of theoretical eruption models, since they confront these models with observations in a quantitative way. Given the continuous advance of observational capabilities and coronal magnetic field modeling, they can be expected to contribute to solve the long-standing problem of how solar eruptions are triggered and driven.
The authors thank G. Valori, P. Démoulin, and G. Aulanier for inspiring discussions. THEMIS is a French–Italian telescope operated by the CNRS and CNR on the island of Tenerife in the Spanish Observatorio del Teide of the Instituto de Astrofísica de Canarias. TRACE is supported by contract NAS5-38099 from NASA to LMATC. SOHO is a project of international cooperation between ESA and NASA. Y.G. and M.D.D. are supported by NSFC under grants 10828306 and 10933003, and by NKBRSF under grant 2011CB811402. Financial support by the European Commission through the FP6 SOLAIRE network (MTRM-CT-2006-035484) is acknowledged. The research leading to these results has received funding from the European Commissions Seventh Framework Programme (FP7/2007-2013) under the grant agreement No. 218816 (SOTERIA project, www.soteria-space.eu). H.L. is supported by NSFC under grants 10873038 and 10833007. T.T. is partially supported by the NASA HTP and LWS programs. T.W. is supported by DLR-grant 50 OC 0501.