Abstract
The photon statistics of spontaneous parametric down-conversion (SPDC) exhibit dependencies on wavelength, pump power, and coincidence time. Notably, the average photon numbers were found to asymmetrically increase with increasing pump power around the degenerate wavelength of emission. We employ a four-detector Hanbury Brown and Twiss interferometer to study the photon statistics of the signal beam. Coupling the detection scheme to a spectrometer enabled the dynamic probing of different bandwidths within the broadband emission. Spectrally resolving the photon statistics revealed that shorter wavelengths increased nonlinearly with pump power, while longer wavelengths showed more linear behavior, indicating a wavelength-dependent efficiency in the generation of the SPDC. The detection and characterization of complex light sources has wide ranging applications in the fields of quantum metrology, quantum communications, and quantum computing, more specifically, a system that is sensitive to wavelength and photon number distribution.

Original content from this work may be used under the terms of the Creative Commons Attribution 4.0 license. Any further distribution of this work must maintain attribution to the author(s) and the title of the work, journal citation and DOI.
Post-Publication Change (made 23 September 2025). A temporary link in the data availability statement was removed.
1. Introduction
Sources of higher-order photon states have been of great interest in the fields of quantum communications [1], metrology [2], and sensing [3]. In communications, these states offer the ability to enhance security and information capacity [4]. In metrology and sensing, quantum (sub-Poissonian) states of light allows for operation below the shot-noise limit, as is well known, and this effect can be pushed further with higher-order photon states toward the Heisenberg limit [2]. However, the generation/manufacturing and detection of these states can be experimentally cumbersome [5, 6].
One common source for the generation of quantum states of light is spontaneous parametric down-conversion (SPDC) [7–9]. SPDC is a nonlinear process by which a pump photon interacting with a nonlinear crystal can spontaneously decay into two entangled photons (signal and idler) [10]. The SPDC photons posses a number of degrees of freedom in their generation, including frequency, polarization, time, and space [11]. While the polarization aspect is still widely studied [12–14], exploiting the spatial and temporal correlations between the down converted beams has shown to have the capability of providing higher degrees of entanglement than that of only using their polarization [15]. There are many experimental factors that influence the properties of SPDC, such as the transverse pump beam modes [7, 16], pump focusing conditions [17–19], collection optics [20–22], crystal parameters [23, 24], and spatial filtering of the SPDC [25]. Since these correlations have been studied rigorously, the design parameters of the SPDC can be finely tuned, for example, maximizing the purity and/or generation rate of the down-conversion [26, 27]. When the conversion efficiency is increased, there comes a turning point where multiple pairs of entangled photons are generated at the same time [28]. Depending on the application, the highest single pair generation rate may be of interest, or the multi-photon conversions may be suppressed or enhanced [29, 30].
As previously demonstrated [31], there are different factors which can influence the photon statistics of the SPDC beams. For example, the spectral modes [31], spatial modes [32], temporal modes [33], and pump statistics [34] dependencies have been investigated for different configurations of SPDC. Depending on the application and designed experiment, the observed statistics can range from sub-Poissonian [35], which is typically exhibited by a quantum light source [36], to super-Poissonian [37], which is typically exhibited by a thermal or chaotic source. Furthermore, depending on the modes present, multi-mode down-conversion can tend to a Poissonian, as the convolution of multiple thermal modes produces a Poissonian, or can lie in between a Poissonian and super-Poissonian [31, 33, 38] (see supplemental section 1.2).
While the photon statistics of SPDC light have been studied in many cases [35, 39–46], more specifically, the joint photon counting statistics have been shown to described by a Poissonian distribution [47–50], while the signal (or idler) alone can exhibit a thermal distribution if the measurement time scale is less than the coherence time [51–54]. Since most times the detection time does not meet this requirement, spectral filtering can also cause the statistics to shift anywhere between these two extreme cases [31, 40, 53].
The foundational work of Hanbury Brown and Twiss (HBT) [55] provides the basis for photon counting experiments to study the coherence properties of light in the absence of photon number-resolving detectors, known as the HBT interferometer [56]. Regarding SPDC, this work was further developed in the examination of different interference and bunching effects with SPDC [57], such as four-photon interference with a beam splitter [58]. Extending the foundational HBT allows for the effective simulation of photon number-resolving detectors, as shown in [59]. The extended HBT has been commonly employed, for example, [60] examines the higher-order coherence of the phase-dependent squeezed state based on an extended HBT, and showed that the extension to the higher-order coherence provides more robust against background noise and detection efficiency. Furthermore, [61] theoretically examines and measures the higher-order correlations of the thermal state using an extended HBT as well. While the extended HBT is a common employment for photon counting experiments, we aim to leverage the advantages of employing a fiber-based extended HBT coupled with a spectrometer for dynamic probing of the present spectral modes within the emission bandwidth of different light sources.
In the present work, the optimized parameter of the SPDC emission is the overall rate detected by the setup, such that the ability to detect up to three-fold coincidence events is utilized and the higher-order statistics can be examined. We aim to characterize the average photon number of the signal beam as functions of wavelength, pump power, and coincidence time. The idler beam is not measured in the present work, but has the capability of being utilized in future applications. With the capability of counting photon states up to n = 3 without the use of number-resolving detectors, this work serves to lay the ground work for characterizing more complex states, providing valuable information where the use of number-resolving detectors is not a major factor. Moreover, being able to characterize the photon number as functions of various parameters can prove useful in quantum sensing and quantum imaging, particularly in a system sensitive to wavelength and photon number distribution. Characterization of the photon number as functions of the studied parameters can also prove vital for the design and optimization of future complex non-classical light sources.
2. Methods
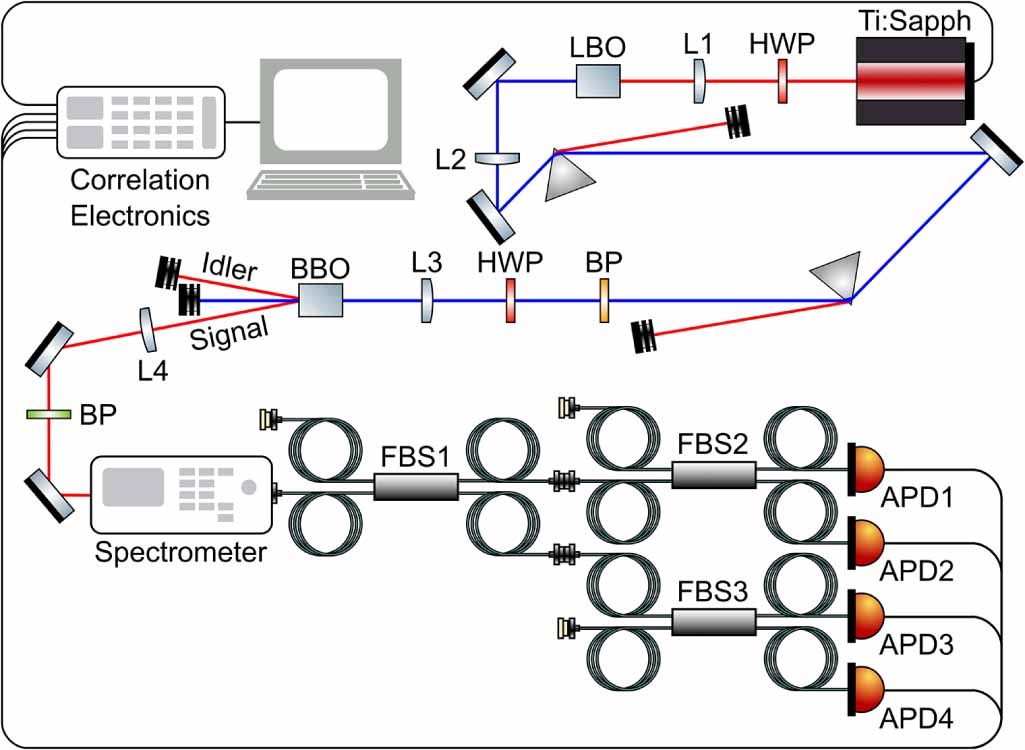
The experimental setup is shown in figure 1. The SPDC is generated from a 1 mm thick β-BBO crystal, which is mounted on a rotational stage to optimize phase matching and a translational stage to optimize the focusing of the pump beam. Since the crystal is type-I ( ), the signal and idler photons will have the same polarization, that is, perpendicular to the pump polarization. The signal and idler are spatially separated by means of non-collinear phase matching, so that they form a cone around the pump beam.
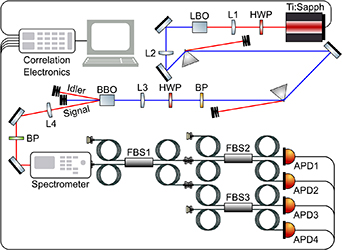
Figure 1. Experimental setup for measuring the photon statistics of SPDC coming from the β-BBO crystal. The time dynamics are investigated by synchronizing the APD events with the excitation laser in time-correlated single photon counting (TCSPC) fashion via an FPGA based correlation board. The spectral dependence is studied by the use of the spectrometer before the HBT where the grating can be used to select the wavelength range coupled into the input fiber of the HBT. APD avalanche photodiode, HWP half-wave plate, BP band-pass filter, FBS fiber beam splitter (50:50 ratio), L lens.
Download figure:
Standard image High-resolution imageThe pump beam (400 nm) used is generated by frequency doubling (second harmonic generation) the output of a pulsed (250 kHz, 270 fs) Ti:Sapph laser. The SHG is focused into the β-BBO crystal with lens of focal length (f) f3 = 100 mm which had a beam waist (W) of  µm measured at full width at half maximum (FWHM). Here, we are interested in studying around the degenerate emission, meaning
 nm, so a band pass filter (800 nm center wavelength, 40 nm FWHM) is used. The pump beam is also spatially blocked, as shown in figure 1. The signal beam is then collected by an f4 = 100 mm lens (
 µm FWHM) and directed into a spectrometer in order to study the spectral dependence of the photon statistics.
To measure photon statistics, a four-detector (avalanche photodiodes) graded index (GRIN) multi-mode fiber-based HBT [55] is used, enabling the counting of photon events up to n = 3. Since there are possibilities of all four detectors recording an event at the same time, there are recorded n = 4 events, which are treated as  , as the detectors are not number-resolving. The measurements are taken in a time-correlated single photon counting (TCSPC) fashion, so low-voltage transistor–transistor logic signals from the avalanche photodiodes (APDs) and excitation laser (called reference pulses) are recorded and time-tagged by an FPGA correlation board.
To investigate the spectral dependence of the statistics, the input lead of the fiber HBT is numerical aperture matched to the output of a spectrometer. The spectrometer used contains a 50 lines mm−1 grating (1.6 nm minimum resolution), the central wavelength of which is varied in order to change the portion of the SPDC spectrum that is coupled into the HBT setup. The entrance slit width is also set to 50 µm for the measurements. The ranges of wavelengths (λ) studied goes from 783 nm to 819 nm in steps of 4 nm, so a total of ten wavelengths are measured for each pump power. While grating-type spectrometers often require care to be taken in regards to their polarization selectivity, here since the SPDC is type-I, the polarization should be the same across the measured wavelengths. The losses incurred by the grating are considered to be accurately measured in the detection efficiency ( ) calculation detailed later in this section. The average pump power is varied by use of ND filters, and the measured average powers used were approximately 39 mW (156 nJ), 33 mW (132 nJ), 25 mW (100 nJ), and 14 mW (56 nJ). The SPDC signal started to be on the same order as the noise level at the tested powers lower than 14 mW.
During the analysis process, the individual detector histograms are centered on a common point to ensure accurate coincidence counting, which compensates for delays in the detector signals arriving at the correlation board, such as differences in cable lengths. The relative time difference between successive signal photon events ( ) is then used to count coincidence detections within the same reference pulse. By default, the condition to count a coincidence detection is having events tagged with the same reference pulse number and same time stamp. Since the correlation board operates in a macro-time unit, the minimum resolution is precisely one macro-time unit, which is about 0.165 ns. In post-collection, the conditional value to count coincidence detections (
 ) can be varied to investigate its effect on the photon statistics, allowing for the probing of different temporal modes present in the detected photon events. The range of
 used is from 0.165 ns (minimum resolution of the correlation board) up to 0.823 ns. It should be stated that the limiting factor in the temporal resolution of the detection setup is the correlation board, since the detectors (IDQ-ID100) have a resolution of about 40 ps. The resolution of the setup also heavily influences the observed statistics, since events being recorded that have small separations in time, below the minimum resolution of the setup, would effectively be counted as coincidences.
Using the approach outlined in [26], specifically equation 20, the signal rate for the experimental parameters in this work was calculated and used in conjunction with the measured events to derive the single photon detection efficiency of the setup, which was found to be  . A large factor of uncertainty comes from the quantum efficiency of the APDs, specified by the manufacturer as 7% at 800 nm. Over the wavelength range studied from 780 nm to 820 nm, this value fluctuates by
 , and when propagated contributes significantly to the
 of the overall system detection efficiency.
 is used to scale the detected photon events to account for the detection losses present in the setup. The number of n = 0 events are derived from the difference between the total detection opportunities in the measurement and the scaled total detection events, and the overall normalization for each dataset is the total detection opportunities. The
 photon events are corrected for the non-number-resolving capability of the APDs by using the quantum mechanical probabilities of higher-order states triggering events of lower orders at the subsequent number of detectors, as detailed in supplemental section 1.3.
The efficiency  does not account for accidental photon events, such as events coming from dark counts or stray background light. The largest source of false positives in this work comes from detector dark counts, and during the high power measurements, the average photon count rates were approximately 20 times larger than the dark count rate and considered negligible. However, the contribution would increase as the signal to noise decreased, like in the lower power measurements. Afterpulsing contributions are negligible in this work because the raw time tagged events are recorded in relation to the reference pulse, and since the detector dead time was 50 ns and the laser repetition rate was 250 kHz (4 µs period), multiple events at the same detector within the same reference pulse were not observed in the analysis. Multiple measures were taken to reduce background light contributions, including encapsulating and additionally covering the HBT setup to block stray light. While there was no explicit intensity background subtraction performed, leveraging the fact that the time-resolved data resembles one cycle of the laser pulse, events recorded far outside of the majority of the events are excluded. The laser pulse width was determined to be about 270 fs, making the relevant photon arrival times localized in time within a window of about 3 ns, corresponding to the effective instrument response function of the setup. Within this narrow window, accidental coincidences are considered to be negligible. This 3 ns window represents the total time resolved data, while the varying coincidence window refers to counting simultaneous detections on a per pulse basis.
3. Results
The measured spectrum of the SPDC was found to be asymmetric about the degenerate wavelength of 800 nm, with lower wavelengths having higher intensity (see supplemental section 1.1). Asymmetric spectra have also been shown in previous works (for example [62]) and is sometimes attributed to loss in the setup [63], for example, detection inefficiency or optical transmission. The asymmetry could also arise from group velocity mismatch, where the velocity differences between the pump and SPDC photons can distort the phase matching conditions leading to different conversion efficiencies across the SPDC spectrum [53]. As the pump power decreased, the asymmetry appeared to be less prominent, which can be explained by the fact that as the overall conversion efficiency is decreased, the group velocity dispersion effect is less pronounced.
Figure 2 shows the spectrally-resolved photon probability distributions for the 10 studied wavelengths using the lowest coincidence window  ns and highest average pump power
 mW. The spectral dependence of the distributions follows closely to that of the asymmetric spectrum, where the highest probability of n > 1 events occurs at the highest intensity wavelength of 787 nm. The other wavelengths measured show lower probabilities of all photon number events, indicating an overall lower intensity, owing to the fact that they are farther away from the optimized phase matching conditions. These individual probabilities are fit to extract their respective average photon numbers, as detailed later in this section.
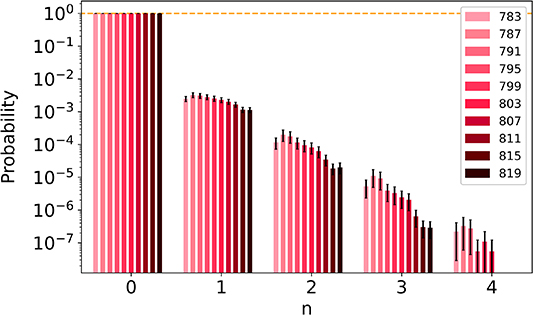
Figure 2. Spectrally-resolved photon statistics for the ten measurements using the highest average pump power (≈ 39 mW) and lowest coincidence window (0.165 ns). The x axis represents photon number n and the y axis represents probability, while the colors of the bars indicate the central wavelength of the grating in the spectrometer before the HBT setup in figure 1. The orange dashed line corresponds to a probability of 1. The intensity profiles of the distributions seem to closely follow that of the observed spectrum, where the wavelengths lower than 800 nm show higher probabilities of photon states n > 1.
Download figure:
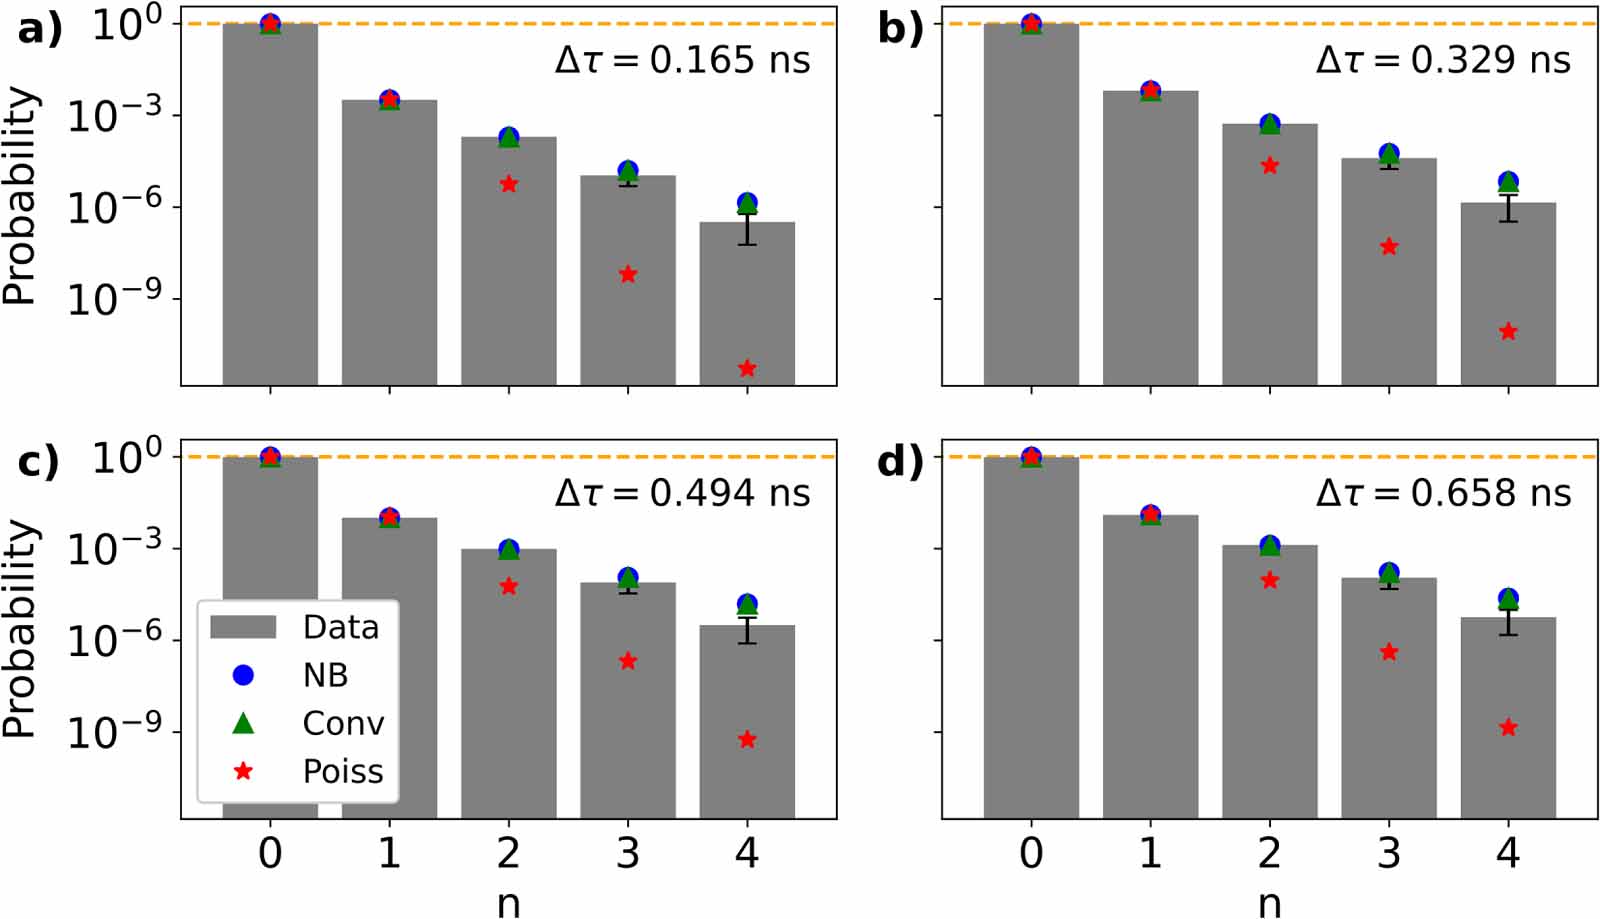
Standard image High-resolution imageTo quantitatively compare the variations in photon statistics as functions of wavelength, power, and time, the probability distributions are fit to extract the average photon number  . The fitting function results can reveal information about the modal complexity of the SPDC. In the limiting cases, the observed statistics can be modeled by a Poissonian distribution in the highly multi-mode case or the Bose–Einstein (BE) distribution in the single mode case [31, 33, 38]. The negative binomial (NB) distribution is commonly used to multi-mode model the SPDC light, as it can cover the transition between the single mode (BE) to the highly multi-mode (Poisson) cases [33]. Furthermore, a convolution model of the NB and Poissonian can be used to take into account Poissonian noise that may present in the measurement process, such as background noise or detector dark counts [64]. In the present work, the statistics are thus fit with all three of these distributions to see which of them best describes the observed SPDC. The theoretical distributions are calculated out to n = 8 in the effort to capture the tail of the distribution, and the fitting procedure was done through the minimization of a least squares loss function over the range of experimental data.
Figure 3 shows the fitted distributions for the central grating wavelength of 787 nm at the highest average pump power for four of the coincidence time windows used, where the largest coincidence time window is excluded for simplicity. Comparing the fits visually, the NB and convolution seem to be better fits to the overall trends, where the Poisson underestimates the higher-order states n > 1. Comparing the R2 scores when  ns, due to the n = 0 dominance of the data, the values are very close to 1 for all of the fits, but comparing the NB R2 to the Poissonian one, the NB R2 is larger by approximately 7E-08, whereas the difference between the NB and convolution was 3E-16. Furthermore, when
 ns, the difference between the NB R2 and Poissonian and the NB and convolution was 3E-06 and 7E-12, respectively. Since the relative differences between the NB and convolution are so small, coupled with the visual comparison between the fits, the NB was chosen to study the average photon number dependencies for simplicity compared to the convolution.
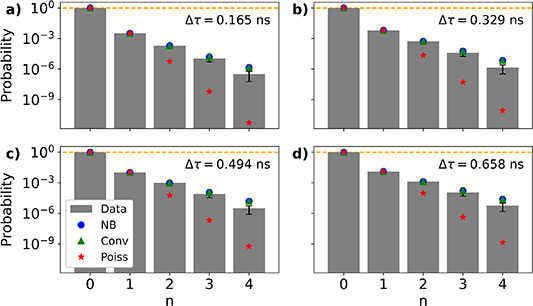
Figure 3. Fitting results for the central grating wavelength of 787 nm with the highest average pump power (≈ 39 mW). On the x axis is photon number detection n and probability is on the y axis. The four plots represent four of the coincidence windows used. The coincidence values are a) 0.165 ns, b) 0.329 ns, c) 0.494 ns, and d) 0.658 ns. The gray bars represent the normalized experimental data, the red stars are the Poissonian fit, blue circles are the negative binomial fit, the green triangles are the convolution of the two, and the dashed orange lines indicate a probability of 1.
Download figure:
Standard image High-resolution imageThe Poissonian distribution describes a more random process, while the NB corresponds to temporally correlated events (e.g. photon bunching). Since the data is well described by the NB, the photon arrival times seem to be strongly correlated. The improved fit of the NB, particularly at higher-order states, also speaks to the spectral filtering by the spectrometer before coupling into the HBT setup. The effective bandwidth of selection that couples into the fiber is narrow enough to show the bunching effect of the NB distribution [31, 40].
An interesting piece of information is seen through comparing the goodness of fits while increasing the coincidence window. Comparing the first plot a) to the fourth d), the NB and convolution are still more appropriate fits, but the Poissonian is visually a much better fit in the maximum time window shown than in the minimum case. However, comparing the Poisson R2 in the two cases, the difference between the  ns and
 ns datasets is 3E-06, indicating that based on the R2, the Poissonian fits better with a shorter coincidence window. To further investigate this, the reduced χ2 was obtained as well, which was found to be about 2.80 when
 ns and about 2.61 when
 ns, which confirms the visual trends. This is likely due to the zero dominance of the data, where when
 ns the fit to the zeros may be worse than in the
 ns case, but the fits to the higher-order states are better, as shown in figure 3. The behavior of the Poissonian fit is showing the integration over the multiple temporal modes present, which effectively start to average one another out as the coincidence window is increased [38].
Since all of these photons are being generated from within the same laser pulse, and the laser pulse time scale is so much shorter than the achievable detection resolution, this behavior suggests that even though the events within the pulse are inherently correlated (since they exhibit photon bunching), the strength of correlation seems to decrease between events that are farther separated in time. This decrease in correlation strength could be due to the temporal modes effectively averaging each other out, which has been shown previously when correlating pairs far apart from one another in time. This increase in the coincidence window effectively causes a loss of ability to distinguish between the finer temporal structure of pulses arriving at the detectors [65]. This can also be due to some experimental parameters, and since the time resolution is not fine enough to resolve correlations at the time scales of the laser pulse, probing the temporal modes within the detection is interesting. Since the NB provides an accurate description of the data, it is used to extract the average photon number, as a function of its input parameters s the number of failures and p the probability of success. The average photon number is then calculated as  . The explicit form of the NB is shown in supplemental section 1.2.
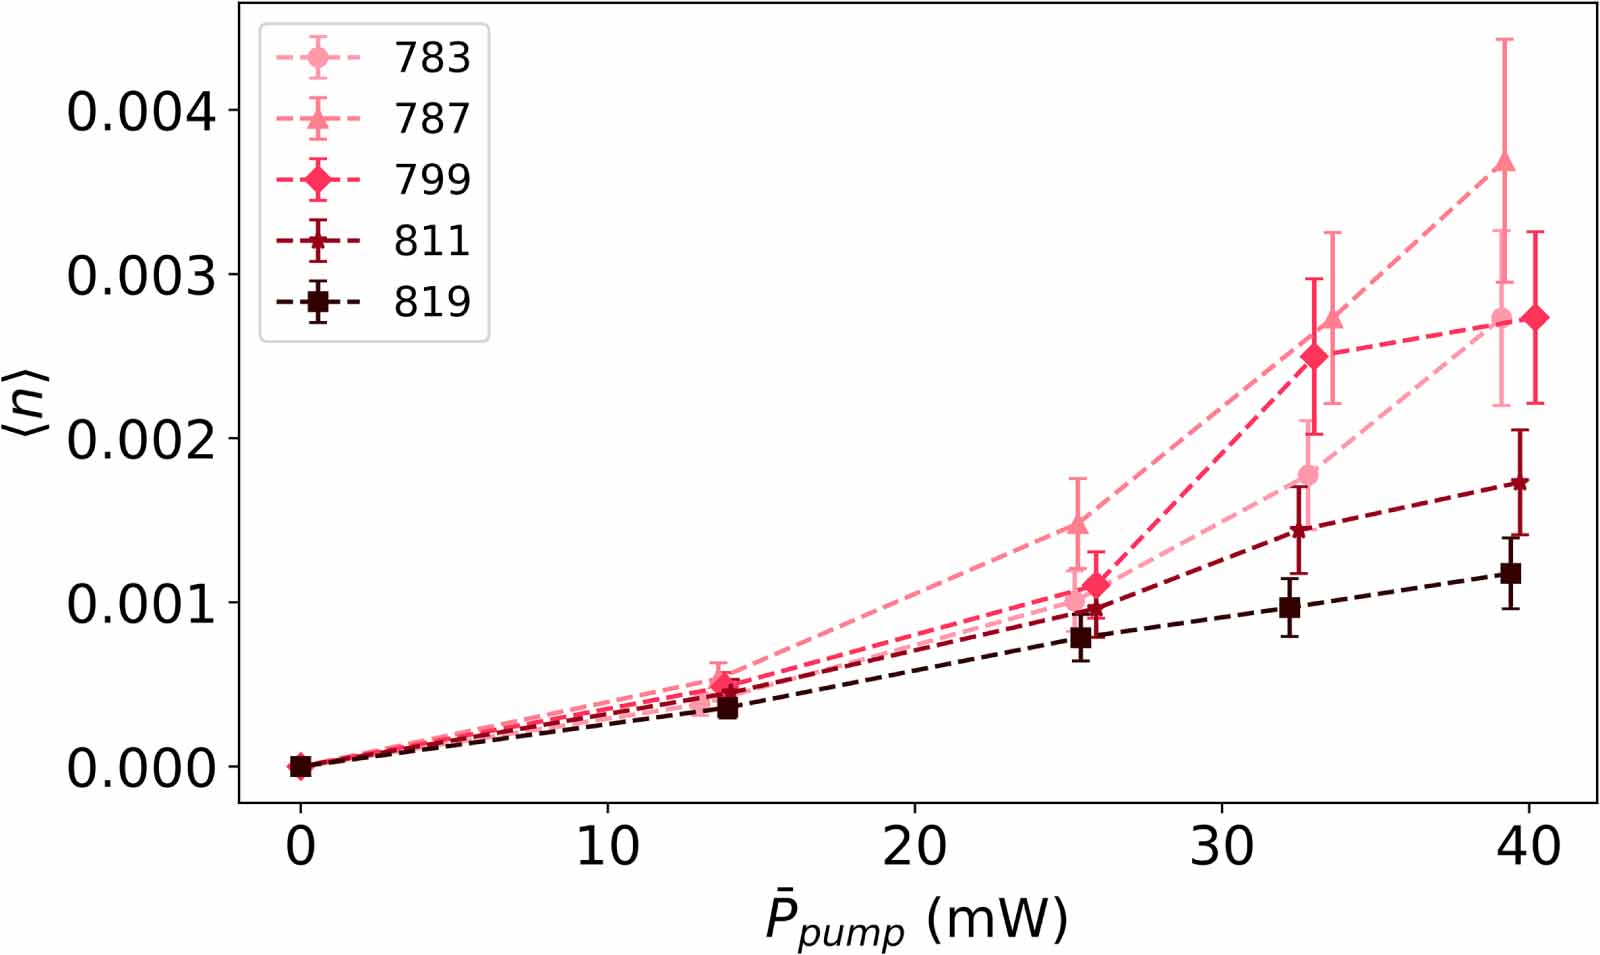
When examining the average photon numbers,  refers to the average photon number for grating wavelength λ. Figure 4 shows the average photon number as a function of pump power for five out of the ten measured wavelengths for the lowest coincidence time of 0.165 ns, where the zero point serves as a baseline. Since the phase matching of the crystal is optimized to the highest counts, due to the asymmetry observed in the spectrum, the optimized wavelength of 787 nm shows the highest average photon number at the highest average pump power of ≈ 39 mW. In this region, there is a clear nonlinear relationship between the photon number and pump power, indicating more efficient generation of SPDC photons. This nonlinear relationship comes from the fact that at these wavelengths the generation efficiency is higher. The probability of generating photon states with numbers n > 1 is thus also higher, causing the average photon number to increase nonlinearly, even though the system remains in the low gain regime, as evidenced by the extremely low emission rate.
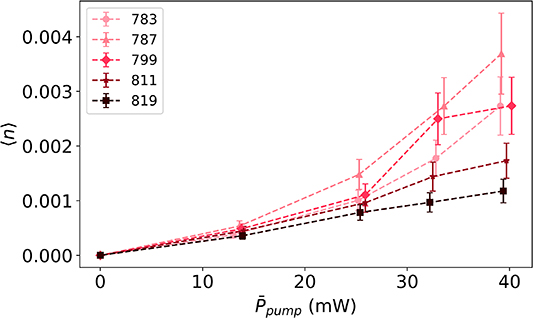
Figure 4. Average photon number power dependence for five of the ten measured wavelengths. The x axis represents the pump power and the y axis represents the average photon number extracted from the negative binomial fit. Spectral dependence is also shown by the color in the legend. A nonlinear relationship is shown at the shorter wavelengths, where the conversion efficiency is higher. The maximum intensity wavelength found was 787 nm, which shows the most nonlinear relationship. For wavelengths more than 800 nm, a more linear relationship is observed.
Download figure:
Standard image High-resolution imageIn comparison, there is more linear behavior where λ = 819 nm, as it is farther away from the optimized phase matching peak, and thus its conversion efficiency is lower. In comparison of wavelengths, at the highest average pump powers,  and
 , showing an approximate 3.1-fold decrease, which is also consistent with the wavelength-dependent intensity variations shown both figure 2 and the observed spectra.
The larger error bars for shorter wavelengths comes from the uncertainty in the number of events recorded by the APDs, where the uncertainty from the Poissonian process of photon countingis assumed to be  where N is the number of events. Since shorter wavelengths proved to have higher intensities, leading to more photon counting events, they exhibit an increased absolute uncertainty. Furthermore, the relative uncertainty also shows an increase at the higher intensities, which speaks to the super-Poissonian fluctuations coming from the SPDC.
At the lowest pump power of ≈ 14 mW,  , showing an increase of approximately 6.9-fold when the pump power increases from ≈ 14 mW to ≈ 39 mW. In comparison,
 with ≈ 14 mW pump power, showing an increase of approximately 3.3-fold in the average photon number. These differences show the rapidly increasing generation of the SPDC at λ = 787 nm, and show the more linear relationship between the pump power and average photon number at λ = 819 nm. The observed flattening of
 at the highest power can most likely be attributed to laser stability, as this behavior at high pump power was also observed for some of the longer wavelengths not shown. Over long periods of time, like the time periods of these measurements, the laser can become unstable in aspects such as mode hopping. In the interest of being able to reliably compare the data across the data sets, the counts were kept at a maximum and restored when an observed decrease in counts was shown without re-phase matching the SPDC crystal. When increasing the coincidence time, the absolute average photon numbers changed but the overall trends remained the same in this case.
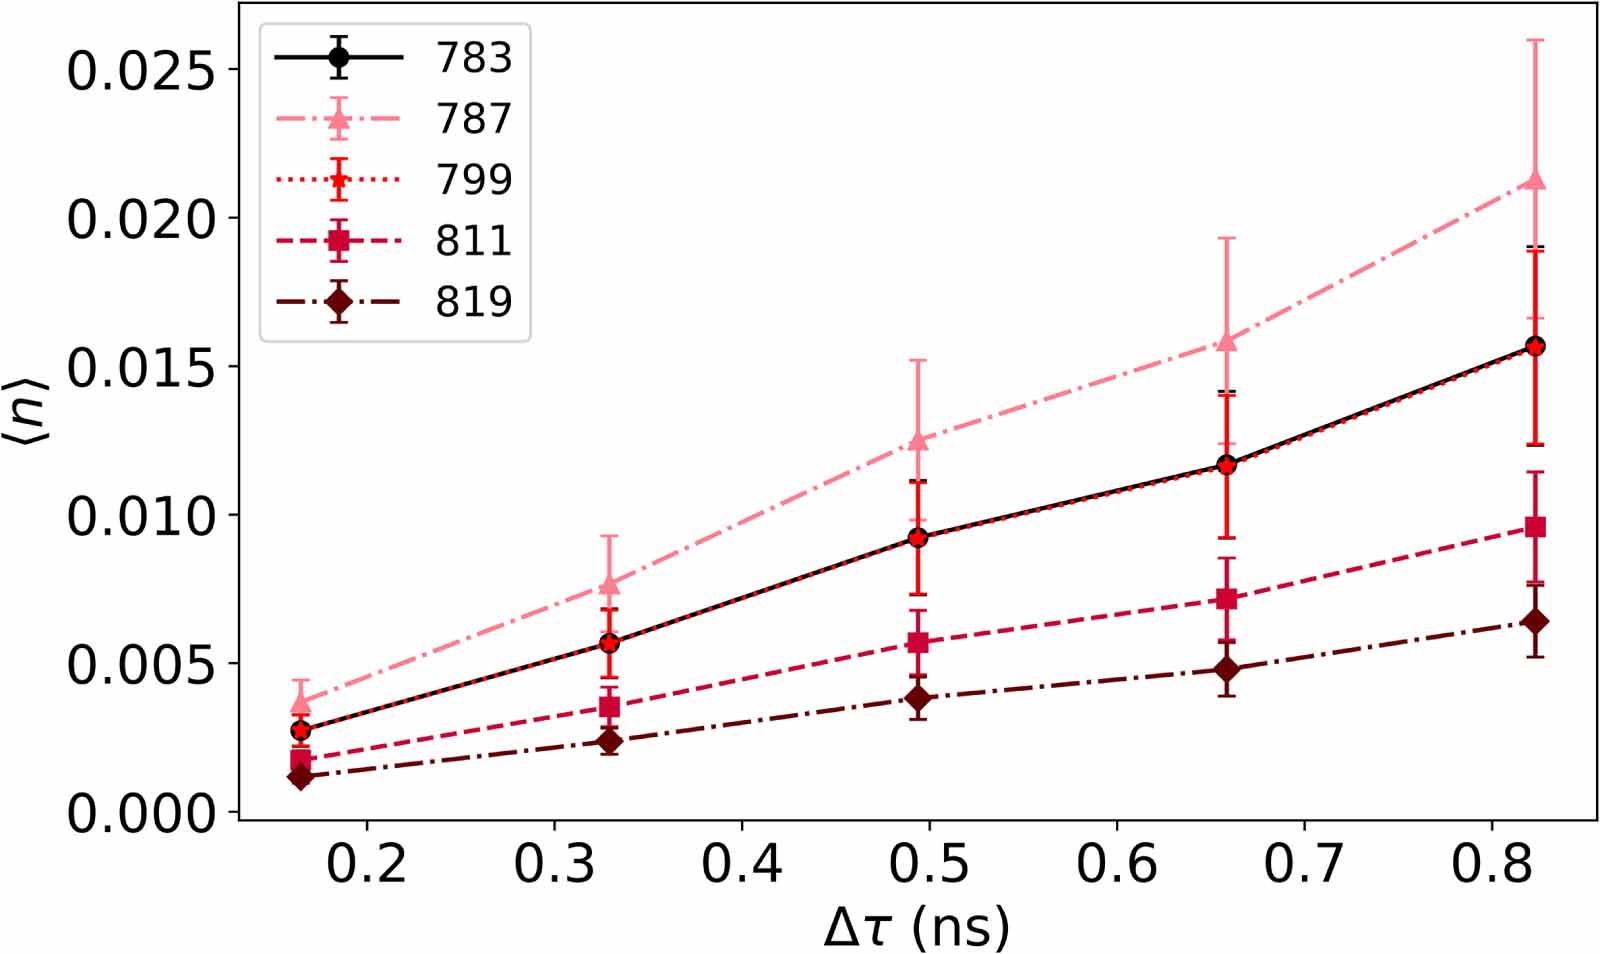
Figure 5 shows the dependence of  on the relative time difference window between detection events
 for the highest average pump power. As shown in figure 3, in increasing the coincidence window, the number of detection opportunities decreases and the number of higher-order states increases, effectively shifting the photon number distribution to the right, i.e. higher photon number. Since the measurements are taken in TCSPC fashion, and the down converted photons are produced by the same laser pulse, the photon detection events are temporally confined. Furthermore, the statistical fluctuations of the measured events prove to be exhibiting bunching, as shown by the data being well described by the NB.
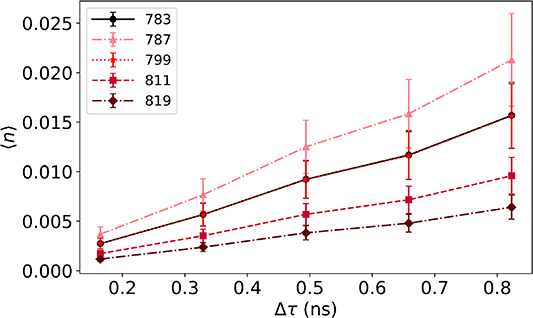
Figure 5. Time dependence of the average photon number  for five out of the ten measured wavelengths. The x axis represents the coincidence window and the y axis represents the average photon number. The time dependence is studied by varying the coincidence window
 to correlate photon arrival times. A steady relative increase is shown for
 ns, and a saturation effect is shown between 0.494 ns and 0.658 ns. The steeper increase from 0.658 ns to 0.823 ns can be explained by the asymmetric response function of the APDs used in the measurement, where the FWHM of the response function was found to be approximately 0.823 ns.
Download figure:
Standard image High-resolution imageThe relationship between average photon number and coincidence window is mostly linear, as shown in figure 5. As the coincidence window approaches 0.658 ns, a slight saturation effect in the average photon is observed when compared to the shorter time windows, suggesting that increasing the window from 0.494 to 0.658 ns adds less correlated events than the smaller windows chosen. Following the saturation effect is a slight increase in slope as  goes from 0.658 ns to 0.823 ns. This is likely from the asymmetric instrument response function from the combination of the APDs and correlation board used in this measurement. The asymmetric response function is also reflected in the manufacturer specified data for the APDs. The combined response function was found to have a FWHM of approximately 0.823 ns, with an asymmetry in the slow decaying tail versus the relatively faster rising edge. As the coincidence is increased to the FWHM, the asymmetric response function seems to start to correlate events from the rising to the falling edge, causing the sharper increase in all of the cases shown in figure 5.
However, the difference in overall slope based on wavelength is noticeable, where the shorter wavelengths λ < 800 nm show more rapid increase in average photon number as the  increases. This can be explained by the fact that at the lower wavelengths, as shown previously, the efficiency of generation is higher, leading to more detected events overall. When increasing the coincidence window, there is a more pronounced increase due to the higher number of generated photons. This result shows that in comparing the longer time windows for correlation between the arrival times of the generated SPDC photons, the average photon number increases regardless of wavelength. Correlating events far beyond the 0.823 ns window chosen here does not add much additional information, and would be adding increasingly more dark counts (noise) since the events are relatively localized in time.
Prior studies often examine the statistical properties of squeezed states [66] and particularly in SPDC, the dependence on the effective number of modes [67], for example, through Schmidt decomposition [33]. In the present work, due to the extremely low count rates and inefficient generation of SPDC, strictly interpreting the traditionally defined mode number s proved to reflect the noise present in  . Furthermore, the absolute number of modes s extracted proved to be not as physically relevant, since these extracted parameters were found to be less than 1. Allowing for s < 1 gives the flexibility to statistically model the over-dispersed data. Therefore, the relative trends as functions of the studied parameters are the focus of this work, rather than the absolute mean photon numbers. In examining
 , we observed similar wavelength-dependent behavior to figure 4, where wavelengths farther away from the optimized phase matching wavelength of 787 nm showed increasingly more linear dependence on pump power. In the dependence on the coincidence window,
 showed consistent wavelength-dependent behavior in that in increasing the coincidence window, both
 and s increase, since increasing the coincidence window effectively integrates over more temporal modes.
4. Conclusion
This work serves to lay the ground work for characterizing and optimizing more complex light sources of higher-order photon states. The presented results examined the photon statistics of type-I degenerate non-collinear SPDC as functions of wavelength, pump power, and coincidence time. The detection scheme used employs a four-detector HBT interferometer [55] using multi-mode fiber with the capability of being used across the visible spectrum.
The SPDC emission was found to have an asymmetric generation efficiency at high pump powers around the degenerate wavelength of 800 nm, where the lower wavelengths proved to have a higher intensity. This behavior was transmitted directly to the subsequent photon statistics, where the highest probability of coincidence detection events was observed at 787 nm, while the lowest probability was around 819 nm. The photon events were found to be strongly correlated, as their probability distributions were found to be well described by an NB distribution.
The average photon numbers were extracted from the fittings of the distributions to quantitatively compare their dependence on the studied parameters. In wavelength, the dependence was found to follow the asymmetric behavior of the intensity at high pump powers, with 787 nm showing the highest average photon number and 819 nm showing the lowest. As the pump power was decreased, the asymmetric behavior flattened out, showing a more symmetric distribution across the spectrum. In power, the average photon number was found to increase nonlinearly with increasing pump power at wavelengths around 787 nm, while the dependence was more linear around 819 nm, which can be explained through the higher efficiency of generation at these wavelengths. In time, the behavior was mostly linear, with a slight saturation effect shown using a coincidence window of 0.658 ns. Beyond this window a sharp linear increase was found, likely owing to the asymmetric response function of the detection setup.
These findings contribute valuable insights into the characterization of the SPDC photon statistics and hold promise in the developments of quantum sensing and imaging systems, particularly in a system sensitive to wavelength and photon number distribution.
Acknowledgments
The authors are greatly appreciative of the assistance and computational implementation provided by Andrew Rockovich [26] at the end of the calculation of the theoretical photon emission rate used to extract the detection efficiency and normalize the data.
Data availability statement
The data that support the findings of this study are openly available at the following URL/DOI: https://doi.org/10.5061/dryad.c2fqz61nc.
Conflict of interest statement
The authors claim no conflict of interest.