

Abstract
Electrospun polymer fiber mats feature versatile applications in tissue engineering, drug delivery, water treatment and chemical processes. The orientation of fibers within these mats is a crucial factor that significantly influences their properties and performance. However, the analysis of fiber samples using scanning electron microscopy (SEM) has limitations such as time consumption, fixed assembly, and restricted field of vision. Therefore, a fast and reliable method for qualitative measurements of fiber orientation is required. Mueller matrix polarimetry, a well-established method for measuring orientation of chemical and biological species, was employed in this case. We investigated the effect of four important parameters of the electrospinning process, namely collector speed, applied voltage, needle-to-collector distance, and solution concentration, on fiber orientation using Mueller matrix polarimetry thus extending the range of parameters analyzed. Measurements were performed using two extreme values and a central optimized value for each fabrication parameter. Changes in matrix values were observed for each fabrication parameter, and their correlation with fiber orientation was analyzed based on the Lu-Chipman decomposition. The results were compared with SEM images, which served as the ground truth, and showed overall good agreement. In the future, the analysis of electrospun polymer fibers can be done by using Mueller matrix polarimetry as alternative to current technology and fabrication parameters, including solution concentration for the first time in this context and the production can quickly be adjusted based on the outcome of the measurements.
Export citation and abstract BibTeX RIS

Original content from this work may be used under the terms of the Creative Commons Attribution 4.0 license. Any further distribution of this work must maintain attribution to the author(s) and the title of the work, journal citation and DOI.
1. Introduction
Electrospun polymer fibers have garnered significant research interest due to their large surface area and high aspect ratio. These fibers find applications in various fields such as biomedical engineering, water filtration, surfaces for chemical reactions and energy-producing devices. Oriented fibers have particular applications such as replicating extracellular matrix in human body, serving as scaffolds for tissue engineering, as well as drug and gene delivery systems [1]. Also, polymers materials are indispensable in biosensing [2, 3], waveguide based sensor applications [4], and all-polymer based photonic components [5].
Electrospinning (ES) is currently widely used for producing ultrafine nanofibers (with diameters above 100 nm) from a wide range of materials and with diverse morphologies that play critical roles in numerous applications [6]. The ES process involves a high-voltage power supply, a syringe pump, a spinneret (such as a blunt-tipped needle), and a conductive collector. Liquid is extruded from the needle, forming a droplet that transforms into a cone-shaped geometry when electrified. From the cone, a charged jet is ejected, which undergoes whipping motions and solidifies into fibers before contact with the collector [7]. The simplicity and scalability of the setup has made ES a promising method for producing versatile microfibers from polymers. The structure of electrospun fibers formed is a key factor that affects their properties and potential uses and is determined by the fabrication parameters. However, conventional imaging techniques used to monitor the fabrication outcome, such as scanning electron microscopy (SEM), are time-consuming and expensive.
Mueller matrix polarimetry (MMP) offers a non-contact, non-destructive, time-efficient, large surface area and easily deployable alternative. It is a powerful analytical tool which relies on the polarizing capability of the material. The  Mueller matrix (MM) describes the entire polarisation properties of the material. The relationship between the elements of the MM is not straight forward, but with certain techniques, such as matrix decomposition, a better understanding can be achieved. Matrix decomposition methods, such as the Lu-Chipman decomposition, allow for the extraction of specific physical parameters from the MM [8]. MMP has gained widespread applicability in optical analytics, finding utility in probing various biological species such as brain fiber tracts, cancer detection, corneal tissue, and collagen [9–13]. Additionally, it has also been applied to non-biological materials like gratings, thin films, and natural crystals and nano-fabricated surfaces [14–16].
By analysing the MM elements, various aspects of electrospun fiber mats can be effectively evaluated and valuabe observations about their characteristics can be obtained. It has been utilized to characterize three different morphologies of electrospun fibers so far: smooth surfaces, microporous structures, and beaded microspheres [17]. The systematic studies were performed by manipulating the fabrication parameters during the production of such fibers. Certain elements of the MM were identified as being sensitive parameters to quantify structural properties of materials. In another study, the porosity of the fiber was investigated by MMP [18]. The porosity is closely related to the capacity of polymer fibers to carry loads such as drugs. As reference, SEM images of the electrospun fibers were used. The results show that MM can be a valuable tool for the early screening of porous fiber samples. Our previous research focused on the correlation between polarimetric information derived from MM measurements and the fiber orientation in electrospun fiber scaffolds made of Polycaprolactone polymer. These fiber mats have significant applications as scaffolds in tissue engineering, i.e. graded implants that mimic the tendon-bone junction. The collector speed in the ES process plays a crucial role in determining the relative orientation of the fibers in space and MMP was used to quantify its influence [19].
We have extended our previous research by demonstrating that our technique can analyze additional parameters to characterize and control the manufacturing process of electrospun fibers. To the best of our knowledge, such an investigation was not performed before. Previous work has shown that various factors influence the transformation of the polymer solution into micro- and nanofibers. The factors that affect the process include solution-related parameters such as polymer molecular weight, concentration, surface tension, conductivity, solvent volatility, and viscosity. Additionally, process-related parameters such as field strength, flow rate, tip-to-collector distance, applied voltage, collector configuration, and shape are also relevant. Finally, environment-related parameters such as temperature, humidity, and pressure are also important. Our investigation focused on process-related parameters, including collector speed, tip-to-needle distance, applied high voltage, and polymer concentration. The results demonstrate the potential of MMP as a simple and powerful technique for characterizing electrospun fiber structures. This technique is particularly advantageous compared to the more complex and expensive SEM techniques currently in use.
2. Methods
2.1. Mueller matrix polarimetry
A MM imaging polarimeter is designed to capture the spatially varying polarization properties of optical systems (figure 1). In this study, we employed an experimental setup similar to the one described in our previous works [12, 19]. The setup consists of two main arms: the polarization state generator (PSG) arm and the polarization state analyzer (PSA) arm.
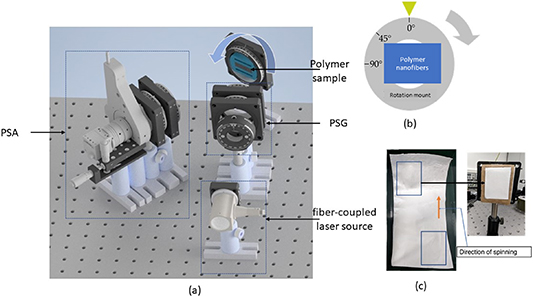
Figure 1. (a) Scheme of Mueller matrix polarimetry setup containing different polarizers, to acquire either 16 or 36 images by the camera. PSA is the polarization state generator consisting of a quarter wave plate and two liquid crystal retarder. The PSA is the polarization state analyzer, which is the same as PSG and has a CMOS camera for imaging. (b) Rotational mount for the polymer foil and angular rotation direction in 45∘ steps for each measurement. (c) Placing of the electrospun box shows the  cut from the sample. The arrow shows the fiber alignment direction and in the laboratory frame, the same orientation is maintained.
Download figure:
Standard image High-resolution imageThe PSG arm is responsible for illuminating the material under investigation with a series of pre-determined polarization states. It comprises a quarter-wave polarizer and two liquid crystal retarders (LCR), which collectively generate six specific polarization states. The optical signal produced by the material under investigation then passes through the PSA arm. This arm is constructed similar to the PSG and contains the CMOS imaging camera. From the total 36 images acquired, with the acquisition time being less than 1 s, we calculate the MM element values.
The setup was calibrated to ensure the optical system is adjusted and behaves similarly to an ideal system. The calibration relies on applying suitable values for the supply voltages of the LCRs for achieving  and
and  phase delays, respectively. All angles are aligned with respect to the first polarizer in the PSG which does not change its orientation during the whole process. The second polarizer is mounted in a motorized rotating holder and is then oriented perpendicular to the first one. Then, the first polarizer is manually set to 45∘ and the following steps are implemented: (i) the fast axes of all LCRs are calibrated to 0∘; (ii) a
  phase retardation is calibrated for all LCRs by the analysis of the relation between the applied supply voltage and the intensity at the sensor; and (iii) a
  phase retardation is calibrated accordingly for LCR2 and LCR3 by using a quarter-wave-plate. The procedure is based on intensity measurements with the imaging camera acting as the sensor.
In MMP, the interaction between the incident polarization state and the sample is described by a  real matrix known as the MM. For a more comprehensive understanding of MMP, detailed discussions can be found in the literature [20, 21]. The MM characterizes the polarization change properties of the sample.
When an incoming light field is represented by a  Stokes vector (S), the resulting polarization state transformation is given by S' = MS, where S' is the outgoing Stokes vector and M is the MM. The MM contains all essential information about how the sample alters the polarization state of the incident light. However, the MM elements obtained from the experiments do not provide information about the sample's physical properties. Therefore, it is necessary to decompose the MM into its various known contributions, as is possible with the polar decomposition method proposed by Chipman [8]. Detailed calculation of MM elements and the derivation of decomposition parameters is provided in the supplementary material. It provides information about various polarization changing properties of the sample, such as diattenuation, retardation, depolarization, and polarization, which can be calculated from it [22]. While diattenuation describes the difference in attenuation between orthogonal polarization states, retardation refers to the difference in phase accumulation between two polarization states. Also, depolarization quantifies the fraction of light lost or transformed into unpolarized light. It has also been proven that a complete MM is sometimes not necessary to obtain various parameters [23].
2.2. Fabrication of the polymer fibers from electrospinning
Pitch, cellulose and polyacrylonitrile (PAN) are generally used as precursor materials for carbon fibers and carbon nanofibers. Among them, PAN is the most widely used precursor, accounting for more than 90% of the market share. This is attributed to its favorable spinnability and high carbon yield, ranging from 50% to 55% [24]. Its chemical structure allows for efficient production rates while maintaining the desired molecular alignment along the fiber axis. Unlike flexible thermoplastics, such as polyethylene and polypropylene, its rigid molecular structure prevents the formation of folded structures. These characteristics make it an exceptional choice as a precursor material for the production of high-performance polymer fibers, distinguishing it from alternatives such as rayon and pitch [25]. In the work presented here, we used PAN polymer as base material for the production of nanofibers.
Processing using ES enables the fabrication of polymer fibers with diameters ranging from a couple of hundred nanometers to few micrometers, which are characterized by their helical rod-like shape resulting from the dipolar repulsion in the nitrile group. It involves the application of a high voltage to a syringe, polymer solution or melt is flowing through. As the strength of the thereby created electric field exceeds the surface tension, a 'Taylor cone' is formed at the tip of the polymer solution/melt. From the Taylor cone, a jet of polymer material is ejected and elongated into a thin fiber as it travels towards a grounded collector. This process is shown in figure 2 and allows for the production of continuous and uniform polymer fibers with a high aspect ratio [26].

Figure 2. Schematic diagram of the electrospinning setup. Important parameters are collector speed (m s−1), high voltage (kV), and the distance from nozzle to the cylinder (cm).
Download figure:
Standard image High-resolution imageTo start the fiber production, a specific set of chemicals with their appropriate compositions were required. The chemicals and key components necessary for the electrospinning process were: PAN, molecular weight 150 000 (Sigma Aldrich); N, N- Dimethylformamide, molar mass 73.10 g mol−1, density 0.95 g cm−3, grade/ purity 99.8% (Carl Roth, Germany); distilled water (VITLAB); syringe, 10 ml (B.Braun Omnifix); Injectomate Line, tube, 150 cm (Fresenius Kabi AG); a single-use cannula, blunt, 0.80 * 22 mm 21 G* 7/8 (B.Braun Sterican).
Initially, a lower polymer concentration was considered, and for the corresponding molecular weight of PAN, an 8 wt% concentration was found to be suitable for producing long fibers and avoiding the formation of beads or droplets on the fiber mats when the proper parameters are chosen in the fiber production process. Therefore, three different concentrations of PAN polymer were used to prepare the fibers. To achieve a uniform polymer solution, 0.8 g of PAN polymer was dissolved in 10 ml of N,N-Dimethylformamide (DMF) with overnight mechanical stirring. Longer stirring times may be required for higher concentrations or different polymers. The solution was then ready for spinning. A diagram illustrating the experimental setup can be seen in figure 2. To initiate the ES process, the polymer solution, which had been stirred overnight, was transferred into 10 ml plastic syringe. The syringe was then attached to a needle via 1.5 m long capillary tube. The setup was positioned with the syringe in a feed pump and the needle connected to a high voltage supply. To ensure safety and avoid harm to individuals, the entire electrospinning setup was built inside a closed chamber with transparent plastic walls.
The collector is a critical component in the electrospinning process to collect either well oriented or unoriented fibres. To begin the electrospinning experiments, the first step was to manually set the distance between the needle and the collector as the pre-determined parameter. A rotating drum covered with aluminium foil was used as the collector, as it facilitates the removal of fibers without affecting their structure. The high voltage and collector speed were set in the electrospinning control program, with an adjustment control for the feed rate of the solution, the latter being measured in millilitres per hour or microlitres per minute. The electrospinning process was considered active when the collector began rotating, and the high voltage was applied to the needle. To perform MM experiments on the resulting fiber mats, they were left to spin for 1–8 h to allow enough fiber mat thickness to be achieved. Once a sufficient thickness was attained, the electrospinning process was stopped, and the aluminium foil was removed from the collector. For subsequent experiments, the entire process was repeated with varying process parameters, while maintaining a constant collector speed and two other parameters, i.e. high voltage and distance between the needle and collector. This approach was repeated for three rounds of experiments with three different collector speeds. While the ES process was typically performed at standard room temperature, an additional heating source might be required to evaporate the solvent.
For this study, samples were prepared by varying the four major parameters. Among these parameters, high voltage and collector speed, can be controlled through the program connected with the electrospinning process. The third parameter, the distance between the collector and needle, can be manually changed by moving the arm attached to the needle in the direction of the collector. The fourth parameter, polymer concentration, can be altered and prepared during the solution preparation stage. For each parameter, we established a range that can be varied. To determine the influence of each fabrication parameter, we kept the other parameters at a constant value and vary the selected parameter over its entire range. We choose constant values that are likely to produce long fibers with a fixed orientation.
3. Results and discussion
3.1. SEM results
The morphology and orientation of the fabricated fibers can be examined using a SEM. To achieve a quantitative measure of fiber orientation, we utilized the directionality plug-in available for the open-source imaging software ImageJ [27]. This plug-in calculates the spatial frequencies within an image by using a set of radial directions. The angles are reported in their simplest mathematical form, with the orientation being counterclockwise and the direction being 0∘ East. The analysis generates normalized histograms, which reveal the amount of fibers orientated at angles between 0∘ and 180∘. A flat histogram would be produced for an image with completely isotropic content, while an image with a preferred orientation would yield a histogram with a peak at that orientation. Additional statistics for the histograms are calculated namely, direction (∘), dispersion (∘), amount and goodness. Direction represents the center of the Gaussian peak; dispersion is the standard deviation of the Gaussian peak and amount the sum of the histogram from center to plus/minus the standard deviation, divided by the total sum of the histogram. The goodness stands for the goodness of the fit function. With these parameters, we were able to quantify the SEM images. The SEM results and parameter values obtained from the samples are discussed along with the MM results in the sections below.
3.2. MM results from the different laser wavelengths used for the MMP
The laboratory setup has the capability to handle multiple wavelengths for illumination. In our study, we utilized three laser wavelengths (633 nm, 532 nm, and 445 nm), and the outcomes are displayed in figure 3. Across almost all MM values, the normalized signal is greater for the red than for blue and green laser light. A strong MM signal produces a more pronounced difference in the normalized signal for red wavelength, reflecting the varying sensitivity of the MM signal to the wavelength of the incident light. Further MM experiments were performed only with a 633 nm laser source. Earlier published works on ES fibers have used this wavelength for polarimetry measurements as well [19, 28].
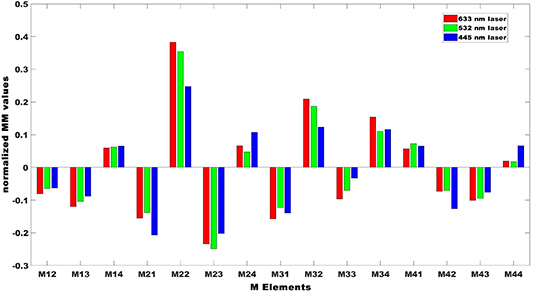
Figure 3. Comparison between the MM values obtained from the red laser (633 nm), green laser (532 nm) and the blue laser (445 nm) source employed in the MM polarimetry. The strongest signal is observed for the red laser source.
Download figure:
Standard image High-resolution image3.3. Full angular MM measurements on spun PAN fibers
The practical applications and properties of electrospun foils heavily depend on the orientation of fibers, which is found to be linked to the MM signal. By rotating the polymer foil as shown in figure 1(b) and taking angular measurements, a certain dependence is expected in response to incident polarization illumination. Certain MM values exhibit a periodic pattern, such as a sinusoidal function, as the sample is rotated from 0∘ to 360∘. To obtain these values, the polymer sample is fixed on a rotational mount, and MM measurements are taken at every 45∘ step, with the step size selected to clearly capture the trend of MM values. The polymer foil is initially oriented vertically at 0∘, which corresponds to the orientation of fibers during electrospinning, as depicted in figure 1(c). Therefore, we can compare angular measurements across MM measurements on foils produced with different parameters, see the discussion below.
Figure 4 shows the result of a single foil produced by the electrospinning process at a relatively high collector speed of 16 m s−1 to determine the pattern repetition. It was observed that there was a repetitive pattern from 0∘ to 180∘ and 180∘to 360∘ for all the MM values. This pattern was also observed in different foils, indicating that these samples can be faithfully utilized for MM measurements. The plots for the upcoming results were generated in the 0∘ to 180∘ angular range. It should be noted that certain MM values can exhibit symmetric patterns within this range. In a similar study, a shorter step size of 10∘ was chosen to for the whole angular range [13]. The 45∘ interval allows for placing fibers in almost any direction over a wide range without loss of any vital information in polarimetry measurement. The absence of a strong fiber orientation in the foils would lead to a loss of symmetry in the angular measurements. No clear trend or pattern can be seen because with zero collector speed, no fiber formation occurs. This result is consistent from the previous published results. This behavior is confirmed in the supplementary figure S1, which shows the MM values for the sample with no collector speed. To investigate the impact of polarization changes from the MM setup on the sample, the experiment was performed twice on a single sample, along with several other samples. After each spinning process, the foil containing fibers was removed and two randomly chosen parts, each measuring about 8 cm*6 cm, were selected for analysis. To establish the reproducibility of the fabricated foils, we conducted measurements on four distinct foils (shown in supplementary figure S2). The first two measurements were acquired from one portion of the foil, while the remaining two were obtained from the opposite side. These findings indicate that repeated measurements of a sample do not considerably impact MM values. In this case, the values remain exceptionally stable. It is crucial to emphasize that fiber morphology must be uniform throughout the foil for morphological analysis. As a result, any section of the foil could be employed for MM measurements of other samples directly from the spinning process.
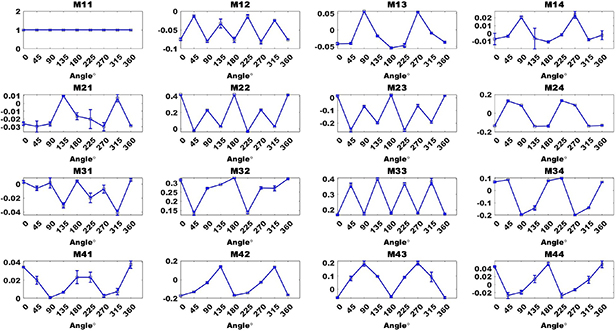
Figure 4. Mueller matrix element values obtained from the angular measurements of the fibers produced at a high collector speed of 18 m s−1. It is worth noting that MM elements display a symmetrical pattern around 180∘ or 90∘. This is attributed to the alignment of the fibers.
Download figure:
Standard image High-resolution image3.4. The variation of the collector speeds
The electrospun fibers fabricated with a high voltage of 15 kV and a distance of 15 cm between the needle and the collector, along with three different collector speeds, were examined. The SEM image for each speed is shown in figure 5. Typical for this study, fiber diameters range between 210 nm and 250 nm. The fiber orientation at one of the extremes (0 m s−1) was quantified using the directionality plug-in histogram. The angle spread from 20∘ to 180∘ was found to be quite large, with a dispersion angle of 20∘. This indicates a fiber morphology with low degree of orientation. However, as the collector speed was increased to 8 m s−1, the fiber orientation started to increase, with an observed reduction in the dispersion angle to 10∘. According to our experience, higher collector speeds are preferred for achieving highly aligned fiber ensembles. At 16 m s−1, the dispersion angle value was found to be 7∘, as shown in figure 5(c). Based on these results, we can expect a similar trend or pattern in the MM values with respect to changes in collector speed. Figure 6 shows the normalized MM elements for these samples. Differences in MM elements for 0 m s−1 and 8 m s−1 speed are seen at 0∘ or 180∘ and the corresponding values are nearly the same at 90∘. The sample prepared at high collector speed (16 m s−1) has given a significant increment in MM values across the whole angular range. The diagonal elements show clear change for all angles. The same is also true for the first row, the first column elements, and the bottom right  matrix too. For 0 m s−1, most MM values are zero. It would be safe to conclude that MM values are sensitive to the collector speed change.
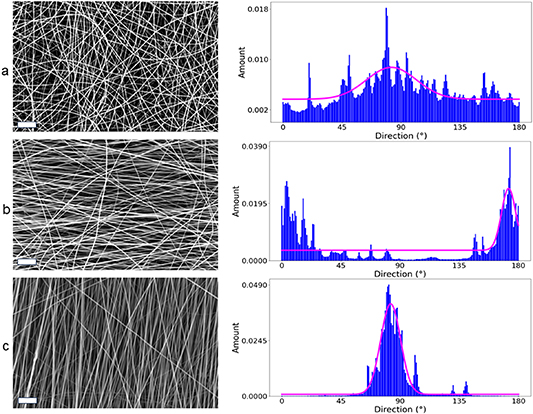
Figure 5. SEM images and histograms of the fiber orientation generated from the ImageJ directionality plug-in, for fiber mats at collector speeds of (a) 0 m s−1, (b) 8 m s−1, and (c)16 m s−1, while keeping constant fabrication parameters of a 15 kV high voltage and a 15 cm distance between the needle and the collector. Histogram values of direction and dispersion, (a) 82∘ and 20∘; (b) 3∘ and 11∘; (c) 82∘ and 7∘. Dispersion denotes the spread of the direction angle. It indicates how ordered the orientation is. It is lowest for the optimal speed of 16 m s−1 and highest for 0 m s−1.
Download figure:
Standard image High-resolution image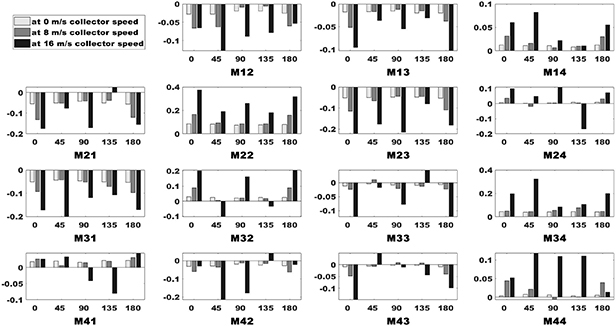
Figure 6. MM values for the fibers fabricated with three varying collector speeds of 0 m s−1, 8 m s−1, and 16 m s−1, while keeping constant parameters of a 15 kV high voltage and a 15 cm distance between the needle and the collector.
Download figure:
Standard image High-resolution imageThe MM elements for retardance, polarizance, diattenuation, and depolarization were calculated using the Lu-Chipman decomposition. The results (bar plot is provided in the supplementary material, figure S3) indicate no significant difference in retardance among the samples. However, polarizance and diattenuation values increase for samples produced at higher collector speeds. Depolarization values exhibit a reverse trend. The overall change in these values among the different samples is minimal.
3.5. Variation of high voltage on needle
The properties of the electrospun fibers fabricated with collector speed of 8 m s−1 and a distance of 20 cm between the needle and the collector with three different applied voltages of 10, 15, and 20 kV were investigated. The SEM images are shown in figure 7.
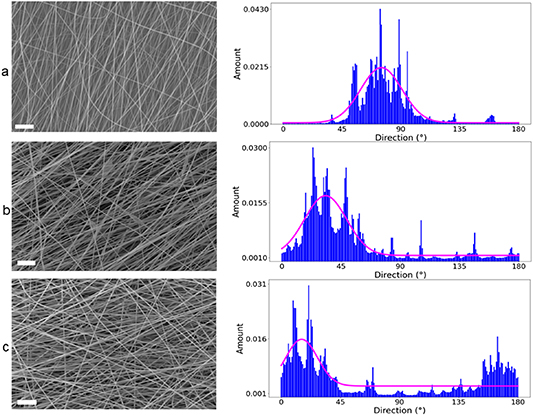
Figure 7. SEM images for the samples fabricated with high voltages of 10 kV, 15 kV, and 20 kV; The other parameters were constant at 8 m s−1 collector speed and 20 cm distance between the needle and the collector. The scale bar is 5  .
.
Download figure:
Standard image High-resolution imageFor 8 m s−1 collector speed, fibers with clear orientation were produced. However, when varying the voltages, we do not create a significant difference in orientation among those fibers. Figure 8 displays measurements demonstrating that higher MM values were achieved at 15 kV, while the lowest MM values were obtained at the other extremes (10 and 20 kV). The change in MM values for the different angles applied indicates a response to polarization, which influences the orientation change. From the 16 MM elements, M21, M31, M22, M23, and M34 are varying. M22 is showing higher values, whereas M34 is suggesting lower values. Another measurement was done while keeping collector speed constant at 0 and 16 m s−1 respectively, and repeating the same procedure again. In this case, at 0 m s−1, we would not expect a clear orientation. From the data from R, P, D, and depolarization data, polarizance and diattenuation values were seen higher for 10 kV and the lowest values were seen for 20 kV. For the depolarization, peaks are noticed for the higher voltages of 15 kV and 20 kV. Graphs of R, P, D, and depolarization are shown in the supplementary figure S4.
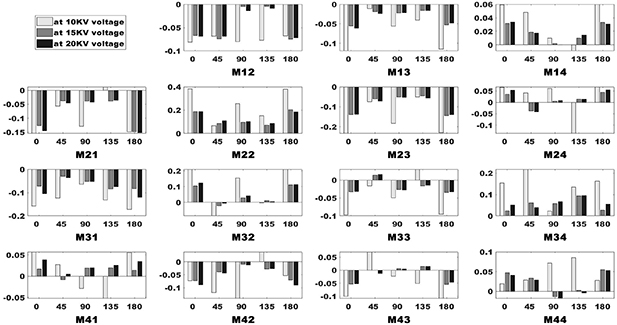
Figure 8. MM values for fibers produced using three different high voltage values (10 kV, 15 kV, and 20 kV) with 8 m s−1 collector speed and 20 cm distance between the needle and the collector.
Download figure:
Standard image High-resolution image3.6. Variation of needle-to-collector distance
The electrospun fibers were fabricated with varying distances between the needle and the collector, using three different values: 10 cm, 15 cm, and 20 cm. These distances are shown in figure 9, along with their corresponding histograms. At a distance of 15 cm between the needle and collector, the fiber orientation is more aligned, with a central peak around 140∘ and a dispersion of 9∘. The remaining angles have almost zero values. However, for the other two distances (10 cm and 20 cm), the histograms are slightly spread over a larger range. Figure 10 shows the normalized MM values, where certain MM values exhibit a symmetric pattern. It is observed that for MM elements such as M21, M31, and M34, the values decrease as the distance increases, while M22, M23, and M32 show negligible differences among them. The difference between the MM values for the parameters is rather small because the fiber orientation has not significantly deteriorated or changed for the upper and lower extreme parameters. It is also noted that the MM values for the 15 cm distance still stand out across all MM values. We conclude that this parameter does not play a significant role in fiber orientation fabrication. This is further demonstrated by the decomposition parameter plots in the supplementary figure S5, where the retardance is slightly higher for the 15 cm distance and the other parameters register no change.
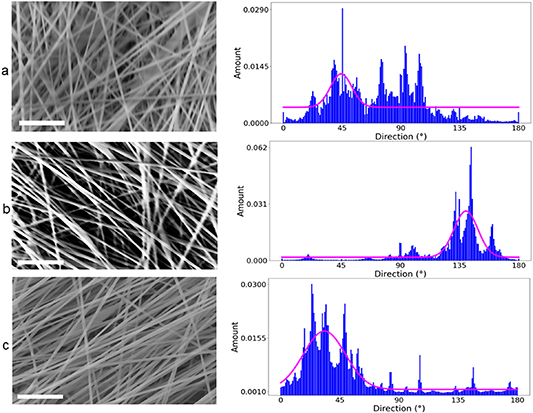
Figure 9. SEM of the fibers fabricated with varying distances of from the needle to the collector as (a) 10 cm, (b) 15 cm, and (c) 20 cm. The direction and the dispersion value are (a) 44∘ and 8∘, (b) 140∘ and 9∘, (c) 30∘ and 7∘ repectively. The constant parameters of 15 kV high voltage and collector speed of 8 m s−1. The scale bar is 5  .
.
Download figure:
Standard image High-resolution image
Figure 10. MM values for the fibers fabricated under constant parameters of 15 kV high voltage and collector speed of 8 m s−1 with varying distances of 10 cm, 15 cm, and 20 cm from the needle to the collector, respectively.
Download figure:
Standard image High-resolution image3.7. Variation of polymer concentration
Three different concentrations of PAN polymer, namely 8 wt%, 12 wt%, and 15 wt%, dissolved in DMF solution, were prepared. Fibers were produced for these concentrations using a collector speed of 16 m s−1, higher voltage (20 kV), and a greater distance (20 cm). The corresponding SEM images, along with the orientation histograms, are presented in figure 11. Notably, only the 8 wt% PAN concentration exhibited ordered fiber formation, as evidenced by the SEM image and the concentration of angles with non-zero values in the orientation histogram. In contrast, the higher concentrations (12 wt% and 15 wt%) displayed a more random fiber orientation, with non-zero values observed for a wider range of angles. This observation is further confirmed by the dispersion values obtained from the histograms, with the higher concentrations having values of 8.8∘ and 10.2∘ respectively, while the lower concentration exhibited a value of 5.4∘.
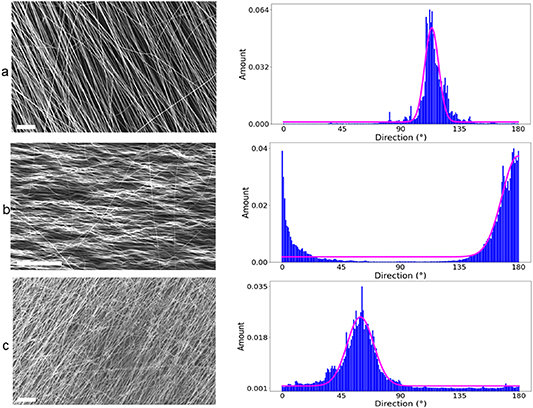
Figure 11. SEM images and orientation histograms for the samples fabricated with (a) 8 wt%, (b) 12 wt%, (c) 15 wt% respectively concentrations of PAN. The direction and dispersion values are (a) 113∘ and 5.4∘, (b) 179∘ and 12∘, (c) 59∘ and 10.2∘ respectively. The goodness of fit for each case is  . The fabrication parameters of 15 kV high voltage, 20 cm distance between the needle and collector, and a collector speed of 16 m s−1. For 8 wt%, the dispersion value is the lowest, indicating a highly ordered fibre orientation. The scale bar is 50
  .
.
Download figure:
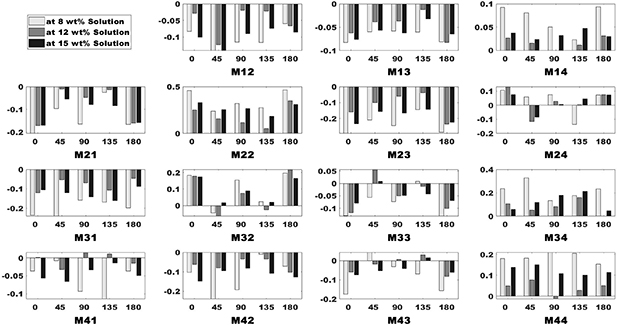
Standard image High-resolution imageMM values were analyzed for each concentration across all angles, as shown in figure 12. It was observed that the MM values were higher for the 8 wt% concentration, indicating a reduction in fiber orientation with increasing PAN concentration. The MM values exhibited an overall increase across all elements, indicating a transition from bead formation to fiber formation as the concentration increased [18]. The results suggest that polymer solutions with higher concentrations lead to the fabrication of fibers with larger diameters. Additionally, the unknown flow rate of the solution may contribute to the formation of even thicker fibers. The increase in fiber diameters can be quantitatively measured as the concentration of the polymer solution used in the electrospinning process is increased. From the Lu-Chipman decomposition parameters, a clear difference is observed among the different concentrations. For explanation, we hypothesize that increasing the concentration results in an uneven polymer solution formation at the nozzle, leading to a more random fabrication process in terms of fiber orientation. Figure S6 illustrates that the retardance and polarizance, attenuation values do not exhibit a specific trend. In the context of this study, the MM proves to be effective in predicting the fiber orientation.
Figure 12. MM values for the fibers fabricated with different concentrations of PAN (8, 12, and 15 wt% respectively) using the fabrication parameters of 20 kV high voltage, 20 cm distance between the needle and collector, and a collector speed of 16 m s−1. The MM values are higher for 8 wt%.
Download figure:
Standard image High-resolution image
4. Conclusion
In this study, we have explored the utility of MMP as a practical tool for predicting nanofiber outcomes in electrospinning, focusing on four key fabrication parameters. Amongst the Lu-Chipman decomposition parameters examined, polarizance and diattenuation showed the most pronounced sensitivity to alterations in fiber orientation. Notably, modifications in the distance between the needle and collector had a negligible impact on fiber orientation, leading to minimal fluctuations in polarizance and diattenuation values. However, substantial variations were observed in these parameters when adjusting the collector speed, applied voltage, and concentration. Depolarization displayed minimal to slight alterations in its values in response to modifications in any of the fabrication parameters. Retardance showed a rather not so conclusive trend and is not a strong candidate for orientation prediction.
In contrast to previous studies that focused solely on morphology or a single factor, this study examined both fiber morphology and multiple ES fabrication factors, delivering new insights into the processes governing nanofiber production by electrospinning. This study is noteworthy for its objective investigation of various factors involved in ES fiber production. The chosen parameters offer a comprehensive depiction of the production process and how it influences fiber orientation, which can be measured by interacting with polarized light. However, one drawback of MM polarimetry is its inability to identify the exact set of parameters retroactively. Only technical parameters contributed to the measured MM values in this work.
For further research, MM polarimetry could be used to analyze further properties of electrospun polymer-optical fibers, such as the concentration of dopants or the helicity [29]. It can also provide valuable insights into the circular birefringence property of chiral structures [30]. A noteworthy example is the examination of polylactide polycrystalline polymer films, which exhibit optical activity when illuminated at oblique angles [31]. Furthermore, an alternative precursor polymer, such as polyethylene oxide (PEO), can be employed for conducting a similar morphological study. Due to its biocompatibility and non-toxicity, PEO is a suitable biomaterial for applications in tissue engineering and wound scaffolds.
Acknowledgments
This work was supported by iToBoS (Intelligent Total Body Scanner for Early Detection of Melanoma), a project funded by the European Union's Horizon 2020 research and innovation programme, under Grant Agreement No 965221. The financial support by the Deutsche Forschungsgemeinschaft (DFG, German Research Foundation) under Germany's Excellence Strategy within the Cluster of Excellence PhoenixD (EXC 2122, Project ID 390833453) is acknowledged.
Data availability statement
The data cannot be made publicly available upon publication because no suitable repository exists for hosting data in this field of study. The data that support the findings of this study are available upon reasonable request from the authors.
Conflict of interest
The authors declare no conflicts of interest.
Supplementary data (1.3 MB PDF)