
Abstract
We report on the experimental studies of the interaction of electromagnetic radiation with borosilicate crown glass K108 in the ultrawide frequency range from 0.002 to 1500 THz. Four different types of spectrometers are used to measure the reflectivity and/or transmittance spectra. Spectral dependences of the complex dielectric permittivity, refractive index and extinction coefficient are extracted from the measured spectra. The optical properties of the borosilicate crown glass in the microwave spectral range (2–23 GHz) are investigated for the first time. There are three bands of anomalous dispersion in the spectral curve of the real part of the dielectric permittivity. Each band of the anomalous dispersion corresponds to an absorption band, which is clearly seen in the spectrum of the imaginary part of the dielectric permittivity. The wide low-frequency absorption band is attributed to the Boson peak. Two other examined absorption bands represent sharp peaks and are associated with the Si–O–Si bending and Si–O stretching vibration modes. The results of the study can be useful in the development of optics based on the borosilicate crown glass.
Export citation and abstract BibTeX RIS

Original content from this work may be used under the terms of the Creative Commons Attribution 4.0 license. Any further distribution of this work must maintain attribution to the author(s) and the title of the work, journal citation and DOI.
1. Introduction
Borosilicate glasses are widely used in various fields of technology, such as production of planar integrated optical waveguides and optical fibers (see [1–3] and references therein). Optical windows and lenses from the borosilicate crown glass BK7 (SCHOTT) and its radiation resistant analogue K108 (LZOS) are often used in optical and optoelectronic devices. The chemical compositions of these glasses are very similar (see table 1). Another important application is windows designed to protect optoelectronic devices from radio frequency interference, in which a conductive film of indium tin oxide is deposited on a borosilicate glass substrate [7–9].
Table 1. Chemical compositions of the K108 and BK7 glasses.
| Material | Chemical composition (wt %) | |||||
|---|---|---|---|---|---|---|
| SiO2 | B2O3 | Na2O | K2O | BaO | Other supplement | |
| K108 [4] | 73.56 | 10.34 | 10.72 | 4.27 | 0.92 | 0.19 |
| BK7 [5] | 69.2 | 10 | 9.9 | 7.6 | 2.5 | 0.8 |
| BK7 [6] | 69.13 | 10.75 | 6.29 | 3.07 | 10.40 | 0.36 |
A number of works have previously been devoted to optical properties of the borosilicate crown glass BK7 in ultraviolet (UV), visible (VIS) and near infrared (IR) spectral regions. The most complete and precise data on the refractive index n and extinction coefficient k at wavelengths of λ = 0.3–2.5 µm have so far been published by SCHOTT AG [10]. The reflectance spectrum in mid-IR range (λ = 5–33 µm) has been measured and the n, k spectra have been determined in [5] using the Kramers–Kronig technique. Using coherent time-domain spectroscopy (TDS), the absorption coefficient and refractive index have been determined in the frequency region of 0.1–1 THz (λ = 300–3000 µm) in [11, 12]. However, as far as we know, there are no published data on the n, k spectra for the borosilicate crown glass BK7 beyond the spectral regions listed above.
The present paper focuses on comprehensive studies of the electromagnetic radiation interaction with the borosilicate crown glass K108 in an ultra-wide spectral range (λ = 0.2 µm–15 cm) which covers optical, terahertz (THz) and super high frequency (SHF) regions. We examined a glass plate of fixed thickness using an appropriate spectroscopy technique in each spectral region. The reflectivity and/or transmittance spectra were recorded and the n, k spectra were determined. Data on the complex dielectric permittivity in the whole spectral range are presented as well.
2. Experimental technique
The majority of the spectral measurements were carried out on a K108 glass plate of 3 mm thickness and 50 mm diameter. Measurements in the centimeter waveband were performed using 200 mm diameter glass plates of ∼3 mm and ∼12 mm thickness.
All the samples were fabricated at TYDEX, LLC, St. Petersburg, Russia [13]. Four different spectrometers were used to cover an extremely wide spectral range with a frequency/wavelength change of 600 000 times (see table 2). The research was carried out using TYDEX, LLC facilities.
Table 2. Operating spectral ranges of the used spectrometers.
| Spectrometer | Spectral range | Operating frequencies | Operating wavelengths |
|---|---|---|---|
| Self-made setup | SHF | 2.0–24.0 GHz | 1.25–15.0 cm |
| TERA K8 THz TDS system | THz | 0.1–1.6 THz | 190.0–3000.0 µm |
| FTIR spectrometer Vertex 70 | FIR | 0.75–21.4 THz | 14.0–400.0 µm |
| MIR | 11.1–231.0 THz | 1.3–27.0 µm | |
| NIR | 36.0–450.0 THz | 0.667–8.34 µm | |
| Photon RT system | VIS/UV | 182.0–1622.0 THz | 0.185–1.65 µm |
Measurements in the SHF range, at frequencies of f = 2–24 GHz, were carried out using a self-made setup with a spectral resolution of 0.01 GHz. The measurements were performed in free space using an anechoic chamber. Panoramic vector network analyzers were used as an SHF generator and detector. Horn antennas were mounted at the generator output and detector input. They were aligned vertically while the irradiated sample surface was oriented horizontally. The input aperture was 180 mm in diameter. Sample transmittance and reflectivity were measured at normal incidence of radiation. When measuring reflectivity, the SHF generator was used simultaneously as a detector. A joint analysis of the transmittance and reflectivity spectra enabled us to extract data on spectral dependences of the absorption coefficient and refractive index of the examined glass.
Studies in the terahertz (THz) range, f = 0.1–1.6 THz, were performed using TERA K8 THz TDS system (Menlo Systems). For generation and detection of broadband THz radiation, semiconductor low-temperature GaAs antennas excited by a femtosecond laser at a wavelength of 780 nm were applied. The transmitted waveform for the examined sample was recorded at normal incidence of the linearly polarized radiation beam with an aperture of 5 mm. The waveform recorded without sample was used as a reference. The magnitude and phase of the complex transmission function were found after computing the complex Fourier transform of the transmitted waveforms. Spectral dependences of the refractive index and absorption coefficient of the K108 glass were determined from the phase spectrum and magnitude spectrum, respectively. The resulting spectral resolution was 0.02 THz.
Investigations in the far infrared (FIR), mid-infrared (MIR) and near infrared (NIR) ranges were carried out by means of a Vertex 70 Fourier-transform infrared (FTIR) spectrometer (Bruker). Radiation sources, beam splitters and detectors used in each range are listed in table 3. A resolution of 4 cm−1 (0.12 THz) was chosen for measurements in the FIR range and that of 8 cm−1 (0.24 THz) was used in the MIR and NIR ranges. The optical transmittance measurements were made at normal incidence of radiation. The beam spot diameter at the sample surface was approximately 10 mm. Two detector response interferograms were recorded, one behind the sample (signal channel) and the other without a sample (reference channel). The interferograms were then processed by a Fourier transform to yield the spectral dependences of the detector response for the signal and reference channels. By dividing the first spectrum by the second one, the transmission spectrum of the sample was determined. This allowed us to exclude from consideration spectral characteristics of the radiation source, detector, and optical path elements (including beam splitter and air). When measuring reflectivity, a gold mirror was used as a reference. The converging incident radiation beam had an angular aperture of 16∘. The axis of the beam formed an 11∘ angle with the normal to the sample surface. The result of dividing the signal spectrum by the reference spectrum was multiplied by the gold mirror calibration spectrum (for wavelengths less than 10 µm). At wavelengths exceeding 10 µm, the reflectivity of the gold mirror was assumed to be constant (0.985).
Table 3. Optical units applied in FTIR spectrometer for different regions of the IR range.
| Spectral range | Radiation source | Beam-splitter material | Detector |
|---|---|---|---|
| FIR | Mercury lamp | Mylar 50 | RT-DTGS-FIR |
| Globar | Mylar Multilayer T222 | RT-DTGS-FIR | |
| MIR | Globar | KBr | RT-DLaTGS |
| NIR | Tungsten-Halogen | CaF2 | RT-DLaTGS |
Measurements in the VIS and UV spectral ranges were made with the a Photon RT diffraction grating spectrophotometer (EssentOpics). A halogen or deuterium lamp was used as the radiation source. The spectrophotometer has two optical channels: a main channel and a reference channel. The main channel includes a sample chamber which provides an opportunity to record the sample transmittance or reflectivity spectrum. The light spot dimensions at the sample surface were 6 × 2 mm2; the angular aperture of the light beam was 2∘. The transmittance and reflectivity measurements were performed at the incidence angles of 0∘ and 8∘, respectively. When switching from transmission measurements to reflection measurements, the sample holder was rotated by 8∘ relative to the axis of the incident light beam, and the photodetector automatically moved around the sample holder to the axis of the reflected light beam.
The reference channel is used for calibration of the main channel photoresponse signal by the wavelength and magnitude. In the VIS spectral range (at wavelengths of λ = 350–990 nm), the transmittance and reflectivity spectra were recorded at a resolution of 0.6 nm. The UV spectra were obtained in the wavelength range of λ = 185–350 nm with the resolution of 0.3 nm.
3. Experimental results and their analysis
Let us first analyze the experimental transmittance (T) and reflectivity (R) spectra of the K108 glass in the GHz frequency range (see figure 1). At the sample thickness of 12.16 mm, the examined frequency range slightly exceeds four periods of the interference pattern, while at the thickness of 2.97 mm only one period of the interference pattern is observed. One can describe the observed interference patterns using the Airy formulas,
where d is the sample thickness,  is the glass absorption coefficient,
  is the intensity reflection coefficient of the vacuum/glass interface, n and k denote the refractive index and extinction coefficient of the glass, respectively, and

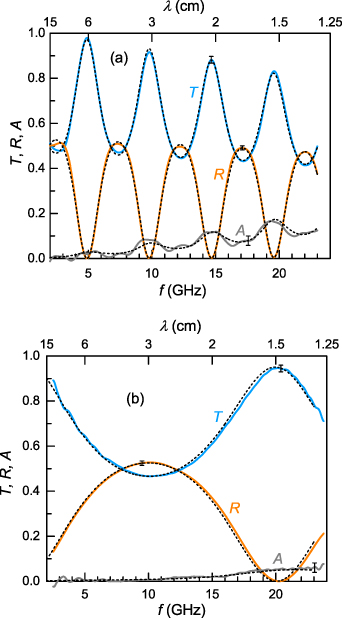
Figure 1. Reflectivity (R), transmittance (T) and absorptivity (A) spectra of a K108 glass in the GHz frequency range. The solid lines represent experimental data. The dashed lines demonstrate spectra simulated using Airy formula and data on the refractive index n and absorption coefficient α (see figure 2). The exact thickness of the sample was 12.16 mm (a) and 2.97 mm (b).
Download figure:
Standard image High-resolution imageObviously, at  , where N is a non-negative integer,
  and the interference maximum of the Nth order can be detected on the transmittance spectrum. At the same condition, the interference minimum of the Nth order can be seen on the reflectivity spectrum. Figure 1(a) shows four transmittance maxima (N = 1, 2, 3, 4) and four reflectivity minima. Equation (3) enables us to determine the values of the refractive index at all frequencies satisfying the condition
  . Corresponding experimental points of the dependence n(f) are plotted in figure 2. Eight additional points of this dependence are found at frequencies satisfying the condition
  which correspond to the transmittance minima and reflectivity maxima. As a result, we have 16 experimental points of the spectral dependence of the refractive index (see triangles in figure 2). A linear approximation of the dependence in the frequency range of 2–23 GHz shows that the refractive index is constant in the error limits:
  .
.
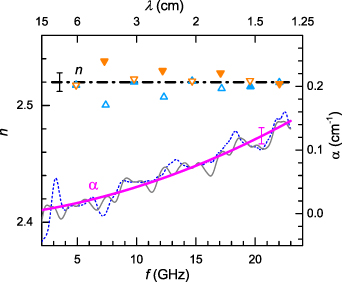
Figure 2. Spectral dependences of the refractive index n and absorption coefficient α of the K108 glass in the GHz frequency range. The up/down triangles denote the values n(f) determined from the transmittance/reflectivity spectra for the 12 mm thick sample (see figure 1(a)). The filled triangles correspond to the spectral positions of the interference maxima; empty triangles denote the positions of the interference minima. The dash-dot line demonstrates linear approximation of the dependence n(f). The dependences  determined from the experimental transmittance and absorptivity spectra are shown by the dashed and thin solid lines, respectively. The thick solid line represents an approximation of both dependences
  by a second-order polynomial.
Download figure:
Standard image High-resolution imageWith the known refractive index and, accordingly, the known intensity reflection coefficient r, it is easy to determine the absorption coefficient  in the entire frequency range where the radiation reflection and transmission were experimentally measured. For this purpose, it is convenient to use the experimental absorptivity spectrum
  , which is represented in figure 1(a) by the grey solid line. As it follows from formulas (1) and (2), the absorptivity is related to the absorption coefficient by the equation
The experimental spectrum  found from the experimental curve A(f) using equation (4) is shown in figure 2 by the thin solid line. The same dependence determined from the experimental curve T(f) using equation (1) is demonstrated by the dashed line. The difference between the dependences
  is within the margins of experimental error. We averaged and heuristically smoothed both curves using second-order polynomial approximation. The thick solid line in figure 2 demonstrates the resulting curve. One can see that the absorption coefficient increases monotonically with frequency and reaches
  cm−1 at f = 23 GHz.
Using this heuristic dependence  and the constant value of the refractive index,
  const
const , we simulated the RTA spectra for the 12 mm thick and 3 mm thick sample. The simulated spectra are shown in figures 1(a) and (b) by dashed lines. They coincide with the experimental RTA spectra in the margins of experimental error. This fact confirms the adequacy of the approach used for determining the refractive index and absorption coefficient of the K108 glass in the GHz spectral range.
At higher frequencies (in the THz range), the studies were performed using the THz TDS method (see section 2). The transmitted waveform recorded for the sample in a time interval of 130 ps contained the first echo signal at t ≈ 92 ps. If we cut the waveform at t ≈ 80 ps and calculate its complex Fourier transform in a time window of 58 ps, we deal with one pass of the radiation beam through the sample only. In this case, the complex amplitude of the electric field at the sample output at a frequency f,  , can be written as:

where  is the amplitude of the electric field at the sample input and
  is the complex one-pass transmittance in amplitude [14]:
and  denotes the angular frequency.
A similar analysis of the reference waveform measured in the same configuration without sample yields the complex amplitude of the electric field of the reference,  , as
, as

where we suppose the refractive index for the optical path without a sample to be equal to 1. Using the results of the THz TDS measurements, we calculated the ratio  which is related to the sample parameters by the following equations:

The argument  of this complex quantity found from the experiment is plotted in figure 3(a). In the approximation
  ,
,  is reduced to the phase shift between the signal and reference amplitudes at the frequency f:

which enables us to determine the spectral dependence of the refractive index n (see figure 3(b)). In the spectral range of 100–750 GHz, the refractive index is slightly higher than at f < 23 GHz (see figure 2) and demonstrates normal dispersion: its magnitude increases monotonically with frequency from 2.530 to  .
.
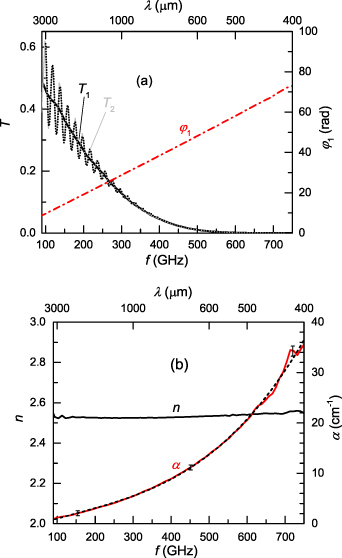
Figure 3. (a) Experimental transmittance spectra and phase shift spectrum for the K108 glass obtained from THz TDS measurements. The thickness of the sample was 3.00 mm. The thick black line marked as T1 shows the experimental one-pass transmittance spectrum obtained with a time window of 58 ps. The phase shift spectrum (the red dash-dot line) was found at the same condition. The thin grey curve demonstrates the experimental transmittance spectrum ![$T_2 = [\rho _2(\,f\,)]^2$](https://content.cld.iop.org/journals/2040-8986/25/6/065401/revision2/joptaccaf9ieqn10.gif) obtained with a time window of 115 ps. The dotted line represents the transmittance spectrum
obtained with a time window of 115 ps. The dotted line represents the transmittance spectrum  simulated using equation (16) and experimental data on optical parameters of the glass presented in the lower panel. (b) Experimental spectra of the absorption coefficient α and refractive index n of the glass in the THz frequency range.
Download figure:
Standard image High-resolution imageThe experimental spectrum of the modulus  of the complex ratio
  makes it possible to determine the one-pass sample transmittance in intensity,
  , using the following relation obtained from equations (6)–(8):
The experimental curve ![$T_1(\,f\,) = [\rho_1(\,f\,)]^2$](https://content.cld.iop.org/journals/2040-8986/25/6/065401/revision2/joptaccaf9ieqn33.gif) is presented in figure 3(a) by the thick black line. In the approximation
is presented in figure 3(a) by the thick black line. In the approximation  , it yields the spectrum of the absorption coefficient
which is shown in figure 3(b). In the spectral range of 100–750 GHz, the absorption coefficient is significantly higher than at f < 23 GHz (see figure 2) and its magnitude increases monotonically with frequency from  to
to  cm−1. These data are in good agreement with papers [12, 15].
Additionally, we analyzed the transmitted waveform for the sample (and then also the reference waveform) at a wider time window of 115 ps which included the first echo signal. In this case there was interference of the directly transmitted wave and the wave which undergoes two internal reflections inside the sample. The resulting electric field amplitude at the sample output at a frequency f can be written as:

where the amplitude transmittance coefficient is determined by the following expression:
The corresponding sample transmittance in intensity,  , can be found from the THz TDS measurements in terms of the modulus
  of the ratio of the complex amplitudes
  and
and  :
:


The experimental curve ![$T_2(\,f\,) = [\rho_2(\,f\,)]^2$](https://content.cld.iop.org/journals/2040-8986/25/6/065401/revision2/joptaccaf9ieqn41.gif) demonstrates an interference pattern (see the thin grey curve in figure 3(a)). The amplitude of the interference oscillations rapidly decreases with frequency owing to the increased absorption coefficient. For comparison, a simulated transmittance spectrum
demonstrates an interference pattern (see the thin grey curve in figure 3(a)). The amplitude of the interference oscillations rapidly decreases with frequency owing to the increased absorption coefficient. For comparison, a simulated transmittance spectrum  is plotted in figure 3(a) by the dotted line. The simulation was carried out using the abovementioned experimental spectra of the absorption coefficient α and refractive index n (see figure 3(b)) and formula (13) which in the approximation
  yields

The simulated spectrum reproduces well all the features of the interference pattern on the transmittance spectrum  . This proves that the method used provides high accuracy in determining the optical parameters of the glass in the THz range.
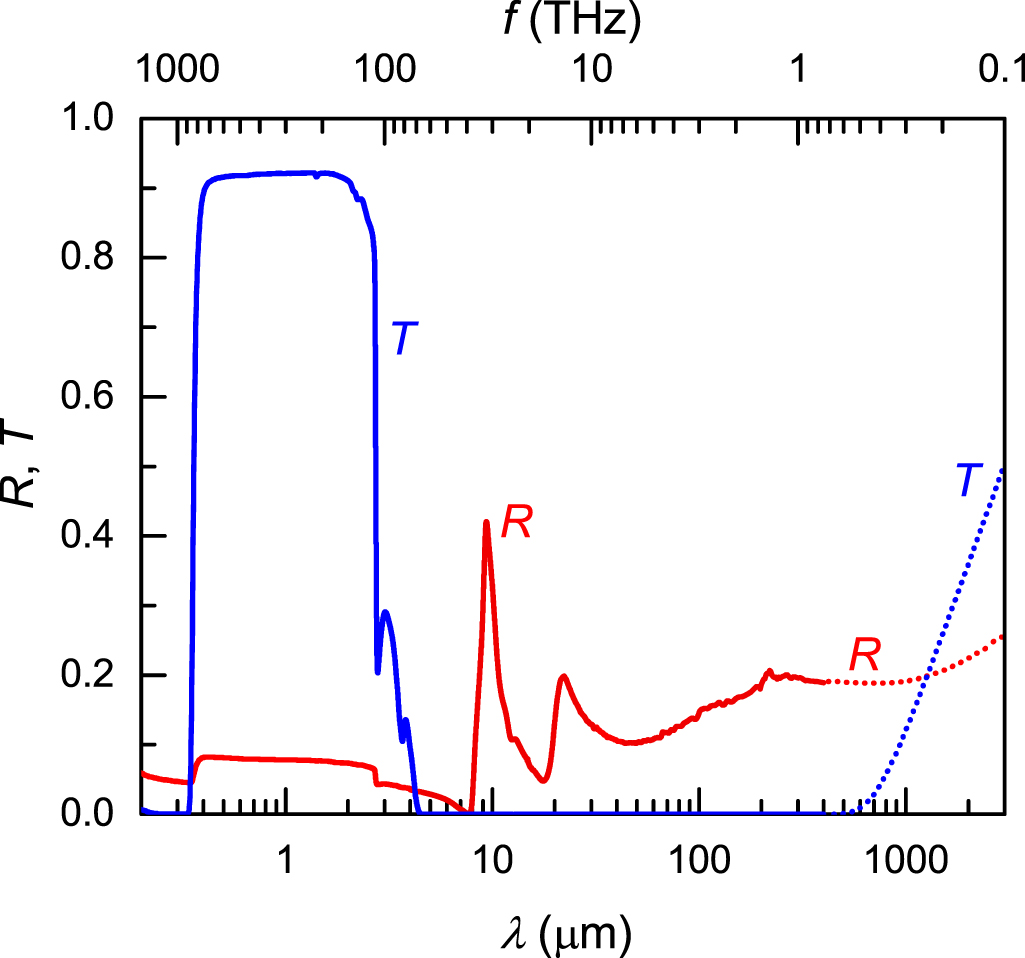
The experimental reflectivity and transmittance spectra of the K108 glass obtained using Photon RT and Bruker Vertex 70 at radiation frequencies from 0.75 to 1500 THz (wavelengths λ of 0.2–400 µm) are presented in figure 4 by solid curves. There is a transparency band at optical wavelengths  µm. Under measurements in this band, the spectral resolution was chosen in such a way as to suppress the Fabry–Pérot oscillations due to the interference of electromagnetic waves associated with multiple reflections of light on the faces of the sample. Under these conditions, formulas (1) and (2) can be reduced to


Figure 4. Reflectivity (R) and transmittance (T) spectra for the K108 glass in the optical and THz spectral ranges. The thickness of the sample was 3.00 mm. The solid curves represent the experimental results obtained in the optical spectral range. The dotted curves denote the normal-incidence RT-spectra simulated using the experimental data on the absorption coefficient α and refractive index n (see figure 3(b)) and equations (17) and (18).
Download figure:
Standard image High-resolution imageA joint analysis of the experimental reflectivity and transmittance spectra using equations (17) and (18) enables us to determine the optical parameters of the glass (the refractive index n and absorption coefficient α) in the transparency band. The results of the analysis are demonstrated in figure 5. To increase the accuracy in the UV region (λ < 0.34 µm, where the absorption is strong), we examined a 0.5 mm thick sample in addition to the 3 mm thick sample. In the spectral interval of 0.34 µm  µm, the absorption coefficient and refractive index spectra obtained for each sample coincide within a relative error of 0.5%. At 0.2 µm
  µm the 3 mm thick sample has very low transmission and did not provide sufficient accuracy in the determination of the n, k parameters. For the latter spectral range, we determined the optical parameters of the K108 glass using RT spectra for the 0.5 mm thick sample, which had a measurable transmittance.
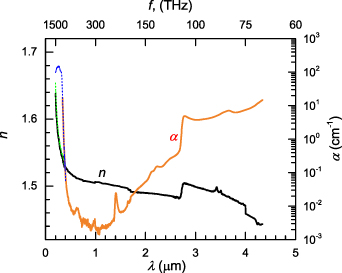
Figure 5. Spectral dependences of the absorption coefficient α and refractive index n of the K108 glass in its transparency band in the optical spectral range. The optical parameters α and n were determined using the experimental RT spectra. The solid lines represent data obtained using a 3 mm thick sample and the dashed lines correspond to a 0.5 mm thick sample.
Download figure:
Standard image High-resolution imageFor the sake of completeness, the RT spectra in the THz transparency band ( µm) are also plotted in figure 4. The latter spectra were calculated for normal incidence of radiation at a low resolution suppressing the Fabry–Pérot oscillations. The calculations were carried out using experimental data on n and α in the THz range (see figure 3(b)) by means of equations (17) and (18).
Now let us consider the non-transparency band ![$[\lambda_a, \lambda_b] = [4.3$](https://content.cld.iop.org/journals/2040-8986/25/6/065401/revision2/joptaccaf9ieqn49.gif) µm, 400 µm
µm, 400 µm![$]$](https://content.cld.iop.org/journals/2040-8986/25/6/065401/revision2/joptaccaf9ieqn50.gif) where
where  and, in accordance with equality (18), the intensity reflection coefficient R of the whole glass plate is equal to the intensity reflection coefficient r of the single vacuum/glass interface. The complex amplitude reflection coefficient,
  , for the interface is given by [16]:
The modulus,  , and the argument,
  , of the complex function
  are related by the Kramers–Kronig relation, which, in the approximation of constant reflectivity in the vicinity of non-transparency band, can be represented as follows [5]:
where  and
and  are the low-frequency and high-frequency limits of the non-transparency band, respectively.
The experimental data on  and equalities (19)–(22) enable us to determine the spectral dependences of the refractive index and extinction coefficient in the non-transparency band (
 ):
):
The spectral dependences of n and k obtained by this method are shown in figure 6 by the dotted lines. Additionally, we plot in the same figure all the data on the refractive index and extinction coefficient,  , obtained above in the transparency bands at shorter and longer wavelengths (see figures 2, 3(b) and 5). The experimental data in these spectral ranges are plotted by the thick solid lines. Only the narrow interval of frequencies from 0.03 to 0.1 THz remains unexplored. The n, k spectra for this frequency interval can be found by the experimental data interpolation (see the dashed lines in figure 6).
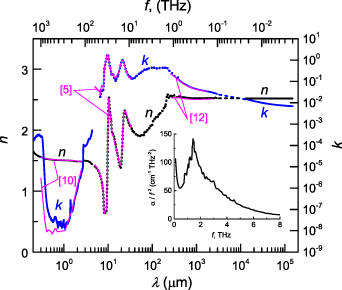
Figure 6. Spectral dependences of the extinction coefficient k and refractive index n of the K108 glass. Spectra of the optical parameters determined using the experimental reflectivity spectrum in the non-transparency band (see figure 4) are shown by the dotted lines. Those obtained using the experimental RT spectra in the transparency bands in the optical, THz and SHF spectral ranges are shown by the thick solid lines. The dashed lines represent the results of the experimental data interpolation. For comparison, the experimental data after [5, 10, 12] are plotted by the thin solid lines. The inset shows the spectral profile of the Boson peak as a dependence of the ratio  upon frequency f.
Download figure:
Standard image High-resolution imageFinally, we determined the spectral dependences of the real part, Re , and imaginary part, Im
 , of the dielectric permittivity. The dependences are presented in figure 7.

Figure 7. Real and imaginary parts of the dielectric permittivity of K108 glass. The experimental data are presented by the solid curves. The dashed lines represent the results of the experimental data interpolation.
Download figure:
Standard image High-resolution image
4. Discussion
Thus, the n, k spectra and spectra of the real and imaginary parts of the dielectric permittivity of the K108 glass were experimentally determined in the spectral range of f = 0.002–1500 THz (λ = 0.2 µm–15 cm). As far as we know, no similar studies covering such a wide range of radiation frequencies have previously been carried out on any borosilicate glasses. Note that Urpety and al. have obtained broadband n, k data for a borosilicate glass (with the composition of 81% SiO2, 13% B2O3, 4% Na2O/K2O and 2% Al2O3), but their research covered a significantly narrower wavelength range: 0.21 µm–3.1 mm, except for the 31–248 µm and 413–886 µm regions [17].
There are three bands of anomalous dispersion on the spectral curve of Re . In these bands, the refractive index decreases as frequency increases. Each band of anomalous dispersion is related to an absorption band which is characterized by high values of Im
 (see figure 7).
The spectral dependence of Im demonstrates two sharp peaks which are located at wavelengths of 10.02 and 21.8 µm (wavenumbers of 997 and 459 cm−1, respectively). These peaks may be attributed to Si-O stretching and O-Si-O bending vibrational modes, respectively. Similar peaks are a common feature of the silicate glasses, while their exact spectral positions vary slightly depending on the glass composition. The corresponding peaks are also clearly seen on the spectral dependence of the extinction coefficient k (see figure 6). They are characterized by wavenumbers of 1028 and 471 cm−1, respectively, which is rather close for the extinction peak positions in the BK7 glass (1040 and 470 cm−1, respectively) [5], see figure 6. This proximity is due to the similar compositions of the glasses BK7 and K108 [4–6], see table 1. Note that other silicate glasses demonstrate shift of the first and second peak up to +60 and ±10 cm−1 [5].
Next, a wide absorption band can be seen on the spectrum of Im in the range of 59.9–294 µm, i.e. 1–5 THz (see the filled in grey area in figure 7). There is a corresponding region of anomalous dispersion on the spectrum of Re
 . These spectral peculiarities may be interpreted as the Boson peak, a universal feature of glassy materials in the terahertz spectral range [18–20]. Its origin is mainly due to non-acoustic quasi-local vibrations [21, 22]. Experimental access to the Boson peak can be provided by means of inelastic neutron scattering, Raman scattering, or RTA measurements in THz region (see [19] and references therein). In particular, Kojima et al revealed the Boson peak directly on the spectrum of the imaginary part of the dielectric permittivity, Im
 , in a lithium borate glass [23] and in a glassy polymethyl methacrylate [24].
The absorption band profile on the spectrum of Im centered at ∼2 THz, which we observed in the borosilicate glass K108, is like that observed by Kojima et al in a lithium borate glass at 0.8 THz [23]. This is the first argument in favor of the fact that the peak at ∼2 THz is the Boson peak. The spectral shift of about 1.2 THz in comparison with the lithium borate glass seems to be quite natural in view of the different chemical compositions of these two glasses. As an example, we point out that the Boson peak in the lithium borate glass xLi2O × (
 )B2O3 with different compositions x was studied in [25] by means of Raman scattering, and it was found that the Raman shift more than doubles with an increase in composition x. Recently Naftaly et al conducted a comprehensive experimental study of the THz absorption of vitreous silica and considered it in terms of the Boson peak [26]. The spectral profile of the peak for different samples was presented as a dependence of the ratio
  upon frequency f. It has been demonstrated that the spectral position of the Boson peak in these coordinates, fBP, is around 1 THz and its exact position is very sensitive to variations in the glass properties. Up to the infrared light-vibration coupling coefficient, the ratio
  demonstrates the deviation of the vibrational density of states from the Debye model for acoustic phonons in a continuous elastic medium [27]. That is why the dependence of
  on f is very convenient for identifying the Boson peak.
Using our data on the extinction coefficient of the borosilicate glass K108 in the THz region (figure 6), we also plotted the THz absorption peak profile as  versus f. The curve is presented in the insert in figure 6. In these coordinates the absorption peak is located at
  THz and becomes narrower (half width at half maximum, HWHM, is ∼ 1.6 THz) than in coordinates Im
 versus f. The peak parameters are comparable with those reported for vitreous silica in [26]. This is another argument confirming that the absorption peak we observed is the Boson peak.
In the borosilicate crown glass BK7, only the low-frequency side ( 1.2 THz) of the absorption band related to the Boson peak has previously been studied [12]. At these frequencies, our data on the absorption coefficient and refractive index in the borosilicate crown glass K108 are in good agreement with the experimental data from [12] (see figure 6). Note, that in the present work we significantly extended the spectral region of the Boson peak investigation (up to 8 THz) combining the THz TDS transmittance measurements (in the transparency region) with the reflectivity measurements using an FTIR spectrometer (in the non-transparency region). As a result, the n, k spectra (and the Re
 , Im
, Im spectra as well) were obtained for the entire band of the Boson peak, including the area of anomalous dispersion.
For the first time, spectra of the optical properties of the borosilicate crown glass were studied in the microwave spectral range at frequencies from 2 to 23 GHz. It has been established that the absorption coefficient increases monotonically with frequency up to  cm−1, which corresponds to an increase in the extinction coefficient up to
  . The refractive index in this frequency range remains unchanged within the experimental error:
  . A negligible dispersion of n (and accordingly Re
 ) at microwave frequencies is a direct consequence of the extremely weak absorption.
5. Conclusion
In conclusion, comprehensive studies of the electromagnetic radiation interaction with the borosilicate crown glass K108 have been carried out in an ultrawide spectral range which covers optical, terahertz and partly microwave regions. The reflectivity and/or transmittance spectra have been recorded and analyzed. Data on the complex dielectric permittivity, refractive index and extinction coefficient have been obtained in the frequency range of 0.002–1500 THz (wavelengths of 0.2 µm–15 cm).
Combining the terahertz TDS transmittance measurements (in the transparency region of the glass) with the reflectivity measurements using an FTIR spectrometer (in the non-transparency region) enabled us to obtain optical parameters of the glass for the entire band of the Boson peak, including the area of anomalous dispersion related to strong absorption. Such comprehensive studies of the Boson peak have not previously been carried out on any borosilicate glasses. Two other examined absorption bands are associated with Si–O–Si bending and Si–O stretching vibrations. They represent sharp peaks in the MIR range. Similar peaks (as well as the Boson peak) are a common feature of silicate glasses, while their exact spectral positions determined in the present study are a 'fingerprint' of the borosilicate crown glass K108, which can be used for non-destructive testing of glasses.
For the first time, spectra of the optical properties of the borosilicate crown glass were studied in the microwave spectral range at frequencies from 2 to 23 GHz. It was determined that the absorption coefficient increases monotonically in this frequency range up to 0.15 cm−1, while the refractive index has a constant value of 2.520. These data have filled the existing gap in knowledge of the properties of borosilicate glasses.
The results of the study can be useful in the development of optics based on borosilicate crown glass (in the transparency bands of λ = 0.34–4.3 µm and λ > 450 µm). In particular, borosilicate crown glass is widely used as substrates for thin conductive films that are applied to protect optoelectronic devices (operating in the VIS and/or NIR regions) from radio frequency interference. Detailed experimental data on the properties of the substrate make it possible to determine the optical parameters of such films with high accuracy, which is beneficial for improving the technology of their manufacture.
Acknowledgments
The work was performed using the facilities and resources of Tydex LLC.
Data availability statement
The data cannot be made publicly available upon publication because they are not available in a format that is sufficiently accessible or reusable by other researchers. The data that support the findings of this study are available upon reasonable request from the authors.
Supplementary data (0.9 MB CSV) Experimental n, k spectra of the K108 glass in the frequency range 0.002–1500 THz