

Abstract
Conventional refractive lenses concentrate the incident light at focal distance. A narrow beam waist can be achieved by increasing the lens numerical aperture, but strongly reduces the depth of focus. In this work, we explore diffractive lenses designs, with fast angular variation of the focal distance, that produce both a narrow beam waist and a long depth of focus. We predict the focusing properties of the diffractive lenses with a simple analytical model based on an incoherent superposition of standard lenses with different focal distances. The histogram of the local focal distances is used to determine the weights in the superposition. Our model optimizes the shape of the diffractive lenses, in order to extend the depth of focus, which corresponds to the lotus lens. We verify our results with numerical simulations based on Rayleigh–Sommerfeld approach. Experimentally, we validate our analytical and numerical solutions with a spatial light modulator. We have found configurations for the lotus lens where the depth of focus is significantly incremented with only a slight increment of the focal width. For example, we increased the depth of focus from 7.6 mm to 37.2 mm while the beam waist varied from 35.0 microns to 51.6 microns for a lens with diameter D = 4 mm, and focal distance f' = 125 mm. These results may find applications in the design of contact and intraocular lenses with extended depth of focus, laser focus generators, and imaging applications where extended depth of focus is needed.
Export citation and abstract BibTeX RIS
1. Introduction
Conventional refractive lenses are optical elements which concentrate the incident light at a certain point, called focal point. There are another two important parameters related to the focus: focal width and depth of focus. Standard lenses are based on light refraction at surfaces separating media with different refractive index. A narrow beam waist can be achieved using lenses with a high numerical aperture (NA), that is, when the diameter of the lens is increased or the focal distance of the lens is reduced. However, a strong reduction of the depth of focus is produced. With the development of diffractive optics, diffraction-based elements with extended depth of focus (EDOF) have been proposed, such as axicons [1, 2], optical apodizers [3], optical elements with multiple transmitting rings [4], computer generated holograms [5], or diffractive optical elements [6]. These diffractive optical elements (DOEs) are used in numerous applications such as microscopy, imaging, optical interconnection or optical alignment [7]. Diffractive lenses have some advantages over other elements, such as axicons. First, diffractive lenses does not require a tip at the center of the element, difficult to manufacture. Also, the intensity of the secondary rings of a Bessel beam is higher than in the case of diffractive lenses, which may be detrimental in some applications, especially if non-linear phenomena are present (like in laser processing). Finally, diffractive lenses have more degrees of freedom, making them more flexible for optimization.
In this work, we analyze how diffractive lenses with a fast angular variation of focal distance, such as daisy and lotus lenses, can produce EDOF, that is, having a long depth of focus but still a narrow beam width [8–12]. Firstly, we analyze daisy lenses, which present a sinusoidal angular variation in the focal distance. Although these lenses may produce a complex intensity structure around the focus spot, when the number of petals is sufficiently high the focus distribution is simple, radially symmetrical, and narrow. Nevertheless, dual focus is obtained in most cases. Thus, it is necessary to develop a technique for lens optimization in order to obtain EDOF. To do so, we consider that, when the number of petals is high, the focus of the diffractive lens can be determined as an incoherent superposition of multiple standard refractive lenses, and we propose to use the histogram of the focal distances to obtain the weights of the superposition. Then, in section 4, we analyze the properties of the optimal EDOF lenses and the histogram of lotus lenses using this model. Also, we study how the lotus lens increases the depth of focus. Finally, we perform experiments using standard, daisy, and lotus lenses implemented in a spatial light modulator (SLM). We have found configurations for lotus lenses where the depth of focus is significantly longer than that of the standard lenses, with only a slight increment in the beam waist. These results may find applications in the design of contact and intraocular lenses with extended depth of focus, in laser focus generators, and, in general, in any imaging applications where an extended depth of focus is required.
2. Extended depth of focus of diffractive optical elements with an angular variation of the focal distance
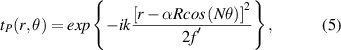
Let us consider a conventional refractive lens, characterized by its transmittance which, in paraxial approximation, is given by [13]
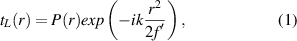
where  is the focal distance, k = 2π/λ is the wavenumber, λ is the wavelength of the incoming beam, r is the radial coordinate, and P(r) represents the pupil function of the lens
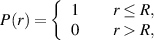
being R the radius of the lens. For a collimated Gaussian beam in normal incidence at the lens plane, the beam width at focus, ω0, and depth of focus (DOF) for this standard lens, tL(r), are given by [14]
where D = 2R is the lens diameter. We can see that a narrow beam waist can be achieved reducing the wavelength of the incident beam, increasing the diameter of the lens, or reducing its focal distance. However, this leads to a strong reduction of the depth of focus.
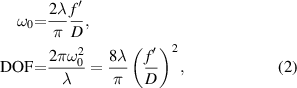
In order to increase the depth of focus, we propose the use of a diffractive lens which, instead of a single focal distance, it presents a periodic angular variation of the focal distance
where  is a periodic function in
 ![$\theta\in\left[0,2\pi\right]$](https://content.cld.iop.org/journals/2040-8986/22/6/065601/revision2/joptab8614ieqn5.gif) , and M is the number of periods in the 2π range (number of petals). The daisy lens is one example of this kind of DOEs [8, 10]. It presents a sinusoidal variation of the focal distances
, and M is the number of periods in the 2π range (number of petals). The daisy lens is one example of this kind of DOEs [8, 10]. It presents a sinusoidal variation of the focal distances

where the minimum and maximum focal values are  and
and  , respectively. The phase generated by a daisy lens is shown in figure 1, and it is compared to that produced by a standard lens with focal distance
  .
.

Figure 1. Phase produced by (a) a standard lens and (b) a daisy lens. The parameters for these lenses are  , D = 1 mm, and the wavelength of the incident field is λ = 0.632 8 µm. For the daisy lens Δf = 20 mm and M = 16.
Download figure:
Standard image High-resolution imageThe daisy lens presents a certain similitude to the petal-like zone plate proposed by Sabatyan and Golbandi [9]
which, in addition to an angular variation in the focal distance, also presents a slight radial variation of the focal distance. In both cases, dual focus is reported.
Now, let us determine the optical performance of the daisy lens by computing the intensity distribution around the mean focal distance  . We have used a fast Fourier transform-based direct integration method that implements the Rayleigh–Sommerfeld formula as a propagation kernel [15]. This algorithm has been implemented in an open source software module for diffraction analysis in Python [16]. The intensity distributions at focus for a standard lens and three daisy lenses with different number of petals M are shown in figure 2. We observe that, in the case of the lenses with 8 and 16 petals, the intensity distribution at focus presents a number of lobes with noticeable intensity surrounding the main central spot. Nevertheless, when the number of petals is increased to 64 (figure 2(d)), the surrounding lobes disappear, leaving a narrow spot as focus. This effect was also observed by Sabatyan and Golbandi for the petal-like lenses [9]. The focusing properties of a binary Fresnel zone plate with rough edges at the rings were analyzed in reference [17]. Analytical equations were obtained which show that, when the roughness is high, the focus is clear and symmetrical without the presence of surrounding lobes. In the present case, instead of rough edges, we have a periodic structure, but we think that the effect is quite similar: when the number of petals is increased, high frequencies are produced which separate from the center (low frequencies). Therefore, for a high number of petals, no surrounding lobes are present around the central spot and only the central peak is obtained (figure 2(d)).

Figure 2. Intensity distribution (logarithmic scale) at focus produced by (a) a standard lens and a daisy lens with Δf = 12.5 mm and different number of petals (b) M = 8, (c) M = 16, and (d) M = 64. In these examples, the focal distance is  , the diameter is D = 4 mm, and the wavelength of the incoming beam is λ = 0.632 8 µm.
Download figure:
Standard image High-resolution imageFigure 3 shows the beam width at focus, measured using the full width at half maximum (FWHM) parameter, for daisy lenses with a different number of petals, being the rest of parameters  , Δf = 25 mm, and D = 3 mm. The focus presents the smallest beam width, 52.7 µm, for M = 0, the standard lens. Then, it abruptly increases for M = 1 to 106 µm. Nevertheless, the FWHM parameter decreases as M increases and, for M > 20, the beam width stabilizes at 60.8 µm, when the surrounding lobes disappear.

Figure 3. Beam width at focus, measured using FWHM, for several daisy lenses with different number of petals M. The focal distance is  , Δf = 25 mm, the diameter is D = 3 mm, and the wavelength of the incoming beam is λ = 0.632 8 µm.
Download figure:
Standard image High-resolution image
In addition to the beam width (lateral resolution), the DOF is another important parameter used to measure the focusing performance of the lenses. We have measured it as the distance between the two positions around the focus where the width of the beam is  wider than the beam waist, that is,
  . The XZ intensity distributions for a standard lens and a daisy lens whose parameters are
  , D = 1 mm, Δf = 12.5 mm, and M = 64 are shown in figure 4. It shows that, although the beam width for the daisy lens is slightly greater than for M = 0 (42.5 µm compared to 31.1 µm), the depth of focus increases from 11.6 mm to 21.0 mm. This reduces the peak intensity from 600 arb. u. to 125 arb. u., since it is wider and longer.

Figure 4. Intensity distribution around the focus for (a) a standard lens, with parameters  and D = 1 mm, (b) a daisy lens with the same parameters than the standard lens, Δf = 12.5 mm, and M = 64. The lenses are illuminated with a plane wave whose wavelength is λ = 0.632 8 µm. The white dashed lines represent the FWHM of the beam at different distances z. (c) Beam width, measured with FWHM parameter for these lenses. The arrows represent the depth of focus.
Download figure:
Standard image High-resolution imageNow, let us determine how much we can increase Δf in a daisy lens in order to obtain an EDOF. The beam width at several distances around the mean focus with  for several values of Δf is shown in figure 5. It shows that, for small values of Δf, an extension of focus is possible. Using these parameters, we can obtain an EDOF up to Δf = 3 mm, resulting in Δf/f = 12%. However, for higher values, Δf > 3 mm, dual focus is obtained instead of EDOF.

Figure 5. Effect of Δf in the depth of focus for a daisy lens with mean focal distance  and diameter D = 1 mm. The wavelength of the incident beam is λ = 0.632 8 µm. For low values of Δf, EDOF can be achieved, but for high values dual focus is obtained, in this example, for Δf > 3 mm.
Download figure:
Standard image High-resolution image3. Model based on an incoherent sum of standard lenses with different focii
Based on the analysis of the daisy lens, we propose a simple model to predict the behavior of diffractive lens with a fast angular variation of the focal distance. This model can be used to optimize the behavior of angular lenses in terms of depth of focus. As shown in figure 2, an increment in the number of petals causes diffraction orders to separate from the axis to an extent that is outside the transverse sampled region. Since the shape of the focus is radially symmetrical for daisy lenses with a high number of petals M, we propose that the behavior around the focus for this complex lenses can be numerically explained as an incoherent superposition of the intensity produced by standard lenses, equation (1),
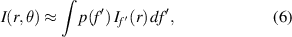
where  is the intensity distribution provided by a standard lens with focal distance
  , and
, and  is the weight for each focal distance. Also, we propose that these weights
  can be obtained using the histogram, h, of the g(Mθ) function,

From a mathematical point of view, the histogram h(y) of a continuous function F(x) results in [18]
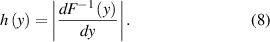
The conditions for F(x) to have a histogram are the existence of the inverse function F−1(y), and the absence of extrema of F(x). For these reasons, in the case of periodic functions we cannot directly apply equation (8), but we must restrict to one semi-period between a minimum and a maximum. For F(x) = α + βsin(qx), α > β, the normalized histogram results in
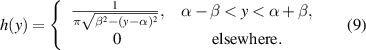
As a consequence, for daisy lenses y = z,  and β = Δf/2, thus it results in
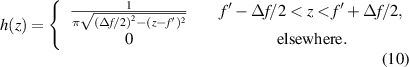
Figure 6 shows the histogram for a daisy lens with  , D = 3 mm, Δf = 30 mm, M = 64, and λ = 0.632 µm, computed numerically, equation (4), and using equation (10), with very similar results.

Figure 6. Analytical–equation (10)–and numerical histogram for the case of a daisy lens with focal distance  , diameter D = 3 mm, Δf = 30 mm, M = 64, and wavelength λ = 0.632 µm.
Download figure:
Standard image High-resolution imageThe comparison between the beam width around the focus of a daisy lens computed using equation (6) and using the numerical Rayleigh–Sommerfeld approach is shown in figure 7. We have simulated two cases with different Δf. For Δf = 30 mm the beam width is approximately constant at focus and an EDOF is obtained. However, when Δf = 60 mm, a dual focus is obtained instead of an EDOF, as proposed in [10]. In both cases, EDOF and dual-focus, the equation (6) accurately predicts the focus width for these complex lenses.

Figure 7. Beam width, measured using FWHM, for a standard lens with focal distance  diameter D = 3 mm, a daisy lens with the same average focal distance, and the predicted beam width using equation (6) for (a) Δf = 30 mm, M = 64, and (b) Δf = 60 mm, M = 64.
Download figure:
Standard image High-resolution image4. Optimized EDOF lenses based on focal histogram
As shown in figure 5, when we try to extend the depth of focus in a daisy lens more than a certain limit, a dual focus is produced. We can explain this effect with our model, considering that the weights  are high for extreme focal distances
  and low at the center, as shown in figure 6. As a consequence, lenses with other periodical functions
  are proposed to reduce this effect. The most direct approach to equally weight all the focal distances between two given values,
  and
and  , is using a function that presents a constant histogram between these maximum and minimum focal values. This histogram can be obtained for the triangle periodic function, which produces the lotus lenses [10], also called star lenses,
where floor() represents the floor function (round to the nearest integer lower than the function argument). Figure 8 shows the phase produced by a lotus lens and the focal XY intensity distribution for M = 32. Now let us compute the beam width for high values of  . Figure 9 shows the EDOF of a lotus lens whose parameters are D = 1.5 mm,
  , Δf = 25 mm (
 ), and M = 128. The beam width of a standard lens using these parameters is 21 µm which is increased to more than double for the lotus lens, 56 µm (measured at the position of the standard focus). Nevertheless, the DOF increases more than five times, from 4.8 mm to 26.4 mm.

Figure 8. (a) Phase of a lotus lens whose parameters are  , D = 1 mm, M = 32 and Δf = 20 mm. (b) Intensity distribution at the mean focal distance for this lotus lens.
Download figure:
Standard image High-resolution image
Figure 9. Numerical computation of the beam width, measured using FWHM parameter, for a standard lens and a lotus lens illuminated with a plane wave whose wavelength is λ = 0.632 8 µm. The parameters for the lens are D = 1.5 mm,  , Δf = 25 mm, M = 128. We can see that the depth of focus is much larger for the lotus lens, with the cost of an increase of the beam width.
Download figure:
Standard image High-resolution image5. Experimental results
We have performed an experimental verification of EDOF in angular diffractive lenses using an SLM. The experimental setup is described in figure 10(a). The light source is a He-Ne laser, λ = 632.8 nm, which is expanded to illuminate completely the SLM. We use a spatial filter formed by a 40x microscope objective (OBJ), a 10 µm pinhole (PH), and a collimating lens (CL). Two linear polarizers (P1 and P2) are used to produce a phase lens [19]. The SLM is an Holoeye LCR-2500 reflective light modulator, with 1024× 768 pixels (8 bits resolution) and a pixel size 19 µm× 19 µm. A 50/50 beam-splitter (BS) is placed at 45° with the propagation axis, so the SLM is illuminated normally to its surface. An image-relaying system, formed by two lenses with focii f1 = 80 mm and f2 = 40 mm, is used to produce an image of the lens at a plane near to the linear stage and, also, to reduce its size in a factor  . A 72BUC02-ML CMOS camera (Imaging source) is placed on a SMC100 linear stage (Newport). The CMOS camera has 2,592× 1,944 pixels with a pixel size of 2.2 µm× 2.2 µm. The camera is free to travel along the beam propagation axis, so we can measure the intensity distribution at any desired plane after the lens.

Figure 10. (a) Experimental setup. He-Ne: He-Ne laser, P1 and P2: two linear polarizers, OBJ: microscope objective, PH: pinhole, CL: collimation lens, SLM: spatial light modulator, BS: 50/50 beam-splitter, and CMOS: CMOS camera. The camera is placed on a linear stage and it is free to travel along the beam propagation axis. (b) Example of image implemented in the SLM for a standard lens. We can see, in addition to the phase produced by the lens, the phase map to eliminate the astigmatism.
Download figure:
Standard image High-resolution imageSince the SLM adds a certain amount of aberrations to the wavefront of the reflected beam, particularly astigmatism, an astigmatic phase is added to the phase maps to eliminate this aberration. Its phase is
where f1 = 4.58 m and f2 = 11.69 m are the sturm focii and  ° is the angle between the lens axes and the x axis. These parameters have been adjusted experimentally until aberrations are negligible. Figure 10(b) shows the phase map of the standard lens plus the phase map to eliminate the astigmatism.
Experiments using standard, daisy, and lotus lenses have been performed. The intensity distribution around the focus has been measured and analyzed for angular diffractive lenses with different parameters. In the first place, we measured the intensity distribution at focus for daisy lenses with 8, 16, and 64 petals, as shown in figure 11. The rest of the parameters of these lenses are  , D = 4 mm, Δf = 12.5 mm. We can see that, for a low number of petals, there are lobes which disappear when the number of petals is increased. These experimental images can be compared to that shown in figure 2, for the numerical computation, since the parameters are the same. Both figures are very similar since, for M = 8 and M = 16, artifacts appear which are eliminated for M = 64.

Figure 11. Experimental intensity distribution at focus for daisy lens with a different number of petals: (a) M = 8, (b) M = 16, (c) M = 64. The parameters of these lenses are the same as in figure 2:  , D = 4 mm, and Δf = 12.5 mm.
Download figure:
Standard image High-resolution imageAlso, we have measured the intensity distribution at focus for standard, daisy and lotus lenses with the same parameters of figure 11 (M = 64), as shown in figure 12. In all cases, the intensity distributions present radial symmetry with no lobes present. We also see that the beam width of the standard lens is smaller than those of daisy and lotus lenses. In the case of daisy lens, the maximum intensity at the focus is lower than those of the standard and lotus lenses.

Figure 12. Experimental intensity distribution at focus for (a) standard, (b) daisy, and (c) lotus lenses. The focal distance for this lenses is  and the diameter is D = 4 mm. For the case of daisy and lotus lenses Δf = 12.5 mm and M = 64..
Download figure:
Standard image High-resolution imageWe have also obtained the YZ profile of the intensity distributions of these three lenses, which is shown in figure 13. The focii for both the daisy and lotus lenses are clearly longer than for the standard lens. Also, the intensity distribution for the daisy lens is dual-focus, figure 13(b), while it is much more uniform for the lotus lens, figure 13(c). These results are in agreement to the numerical simulations and the proposed analytical model based on incoherent sum of standard lenses with different focii. In the images, there are also zones with zero intensity along the optical axis, which are produced by an undesired interference due to spurious reflections.
Figure 13. Experimental YZ intensity distribution for the lenses defined at figure 12. The white dots represent the FWHM parameter from the experimental data, and the white dashed lines represent the polynomial fitting to these experimental FWHM.
Download figure:
Standard image High-resolution imageFigure 14 shows the experimental XZ intensity distribution for the same lenses as in figure 12. Also, the experimental FWHM parameter and the polynomial fit to the experimental values are shown. The parameters obtained using these experimental data are shown in table 1.
Table 1. Focus parameters obtained with experiment of figure 13.
| Lens | DOF (mm) | FWHM ( µm) |
|---|---|---|
| Standard | 7.6 | 35.0 |
| Daisy | 37.1 | 65.1 (at center, z = 0 mm) |
| Lotus | 37.2 | 51.6 |

Figure 14. Comparison of the experimental FWHM for standard, lotus and daisy lenses, computed from XZ profiles of figure 13. The dots represent the FWHM from the experimental data and the dashed lines represent the polynomial fitting to these experimental FWHM. It is clear that lotus lens produce EDOF.
Download figure:
Standard image High-resolution image
It is clear that the daisy and the lotus lenses produce EDOF, increasing significantly the depth of focus of a standard lens. Nevertheless, the beam width at the location of the mean focus is smaller for the lotus lens. Comparing the lotus and the standard lenses, we obtain an increase in the DOF of 389% with only an increase of 47% in the beam waist. These results may find applications in the design of contact and intraocular lenses with extended depth of focus, in laser focus generators, and in imaging applications where an extended depth of focus is required.
6. Conclusions
In this work, we analyze how diffractive lenses with fast angular variation of the focal length (daisy and lotus lenses) can produce narrow focal spots with extended depth of focus in comparison to standard lenses. We show that these lenses produce a complex light structure around focus for a low number of petals, which results in a round spot by increasing it. In order to explain the behavior of these lenses, we develop an analytical model based on the incoherent pondered summation of standard diffractive lenses with different focal distances, which results in good agreement with the numerical results obtained by using an implementation of the Rayleigh–Sommerfeld beam propagation formula. Finally, we also experimentally corroborate the lenses performance with an SLM. The agreement between all of them validates the behavior of the lenses and their potential applications such as the design of contact and intraocular lenses, laser focus generators, or imaging applications where extended depth of focus was needed. As an example, we have experimentally found that, for a lens with diameter D = 4 mm, focal distance  , and Δf = 12.5 mm, the depth of focus can be increased from 7.6 mm to 37.24 mm with only an increase of the beam waist from 35.0 µm to
  .
.
Acknowledgments
The authors thank Irene Alda for her help in the revision of the manuscript.
This work has been funded by the European Fund for Regional Development (EFRD-FEDER, EU), and the Spanish Government's Agencia Estatal de Investigación (AEI) belonging to Ministerio de Economia y Competitividad (MINECO) (grant DPI2016-75 272-R).