
Abstract
In reflection laser scanning microscopes, detection of odd aberrations is challenging because aberration cancellation can occur after the second passage of the light beam through the system. A method is proposed that uses a sample containing high spatial frequencies, such as an edge scan, to detect and measure the presence of odd aberrations. The new approach is demonstrated by scanning the focal spot over an edge in a confocal reflection microscope when coma is present in the imaging system (a common odd aberration). It is shown that the edge response displays characteristic distortions which are typical of coma. Detection of amplitude, sign and orientation of the coma aberration is made possible by comparison of the measured edge responses with theoretical curves.
Export citation and abstract BibTeX RIS

Original content from this work may be used under the terms of the Creative Commons Attribution 3.0 licence. Any further distribution of this work must maintain attribution to the author(s) and the title of the work, journal citation and DOI.
1. Introduction
System and sample induced wavefront aberrations degrade the performance of optical imaging systems, which results in a loss of resolution and contrast. In the presence of aberrations, the image taken by a confocal microscope can be severely degraded and might not give a faithful representation of the sample. Shack–Hartmann wavefront sensors [1] and interferometric devices [2] can be used to measure these aberrations. Alternatively, aberrations can be measured with indirect wavefront sensing methods [3–6]. In indirect wavefront sensing, a metric related to image quality, e.g. the intensity at the pinhole of a confocal microscope, is optimised with a wavefront shaping device such as a deformable membrane mirror (DMM).
Reflection laser scanning microscopes are commonly used in optical metrology to measure the surface profile of samples. Wavefront sensing in reflection setups is challenging due to the cancellation of odd aberrations caused by a double-pass effect [7]. In reflection imaging systems, the incoming light path and reflected light path pass of different sides of any optical element (e.g. microscope objective) present in the system. After reflection off a flat surface, the wavefront is spatially inverted and, as a result, odd aberrations (such as coma and trefoil) are cancelled on the return path through the system and a wavefront sensing device, or an indirect wavefront sensing approach, is not able to detect the presence of such aberrations. Whereas for even aberrations (such as astigmatism and spherical aberration), the aberrations are doubled in terms of amplitude in the return path. In other words, for samples with predominantly low spatial frequency content, odd aberrations will be substantially cancelled on the return path after reflection. A structured sample containing finer details, including point objects, will cause the incident light beam to diffract under larger angles and complete cancellation is no longer achievable. Nevertheless, although the presence of odd aberration may remain unnoticed due to the cancellation effect, the spot used for scanning the sample will be aberrated and will degrade the quality of the images generated. For illustration of the double-pass effect in a reflection microscope using a mirror sample, contour plots of aberrated spots at the object and detector plane are shown in figure 1. These show a doubling for astigmatism, an even aberration, and a cancelling for coma, an odd aberration at the detector plane.
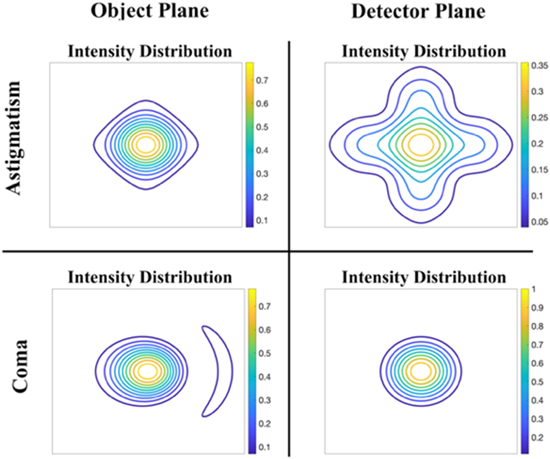
Figure 1. Illustration of the double-pass effect on focal spots in a reflection microscope. Aberrated spots at the object and detector plane are compared for an even aberration, astigmatism (top row), and odd aberration, coma (bottom row).
Download figure:
Standard image High-resolution imageIn order for a system to be sensitive to odd aberrations, the sample must contain relatively large spatial frequency components that do not have symmetry about the optical axis, so that in a round trip, light propagating either side of the optical axis will suffer different amounts of aberrations. An edge can be described in terms of an asymmetric function with high frequency components. This manuscript presents a method which allows odd aberrations to be detected by scanning the focal spot across an edge. An edge response is often used to evaluate the lateral resolution and to measure the modulation transfer function of a microscope. To detect odd aberrations, the focal spot is scanned across an edge feature in a sample and the intensity response used to detect and measure the presence of odd aberrations. Edge scans have been used previously in confocal microscopy to assess lateral resolution. Gu et al [8] studied the effects of defocus and spherical aberration, both even aberrations, in terms of the confocal image of a straight edge. They found that small amounts of defocus and spherical aberration can lead to a steeper edge response. However, for large amounts of spherical aberration, the steepness of the edge response decreases, and inflection points appear at the top and bottom parts of the edge response.
In this manuscript, the newly proposed approach is illustrated by looking at the edge response due to coma, a commonly occurring odd aberration. It is shown that the edge responses display a characteristic distortion which is typical of coma and the amplitude, sign and orientation of any coma present in the imaging system can be determined from shape of edge response curves. First, simulated edge responses, in the presence of spherical aberration and coma, are presented and discussed. Thereafter, experimental edge scans, taken on a confocal reflection microscope, are shown to demonstrate the feasibility of the proposed method.
2. Theory
Edge responses are simulated using coherent imaging theory [9] and normalised optical coordinates. The image plane coordinates (X, Y) are normalised with the aid of the diffraction unit  where λ is the wavelength and NA the numerical aperture of the microscope objective, to give the normalised coordinates (x, y) [10]. The point spread function
  at focus in normalised coordinates is given by [11],

where  is the transmission function. The integral is evaluated over the unit circle Ω, which represents the normalised pupil function.
  is the aberration function which can be expressed in terms of Zernike polynomials [12],

 represents the Zernike amplitude coefficients and
  the Zernike polynomials. The Malacara normalisation [13] was adopted, while using a (n, m) indexing scheme for the Zernike polynomials. The amplitude transmission function of an edge is given by,

 is the position of the edge along the y direction. The reflected amplitude at the pupil,
  is obtained by taking the inverse Fourier transform of the product of the amplitude PSF with the edge reflection function,
with γ representing the lateral position of the edge. The pupil boundary conditions,  then have to be applied to
  An edge scan can be simulated by increasing the value of
  The final step is to compute the amplitude distribution at the detector plane,
  with the imposed wavefront aberration after a reflection,
  through the optical system.
  are normalised coordinates at the detector plane. After reflection the wavefront is inverted, such that the returned wavefront is a mirror image of the incoming wavefront with respect to the pupil centre. The wavefront aberration
  at the pupil is given
  The amplitude distribution at the detector is:
The intensity at the detector plane is obtained by multiplying the amplitude with its complex conjugate  The detector output is obtained by summing ID over the area corresponding to a pinhole. The edge responses are the result of moving the edge across the focal spot.
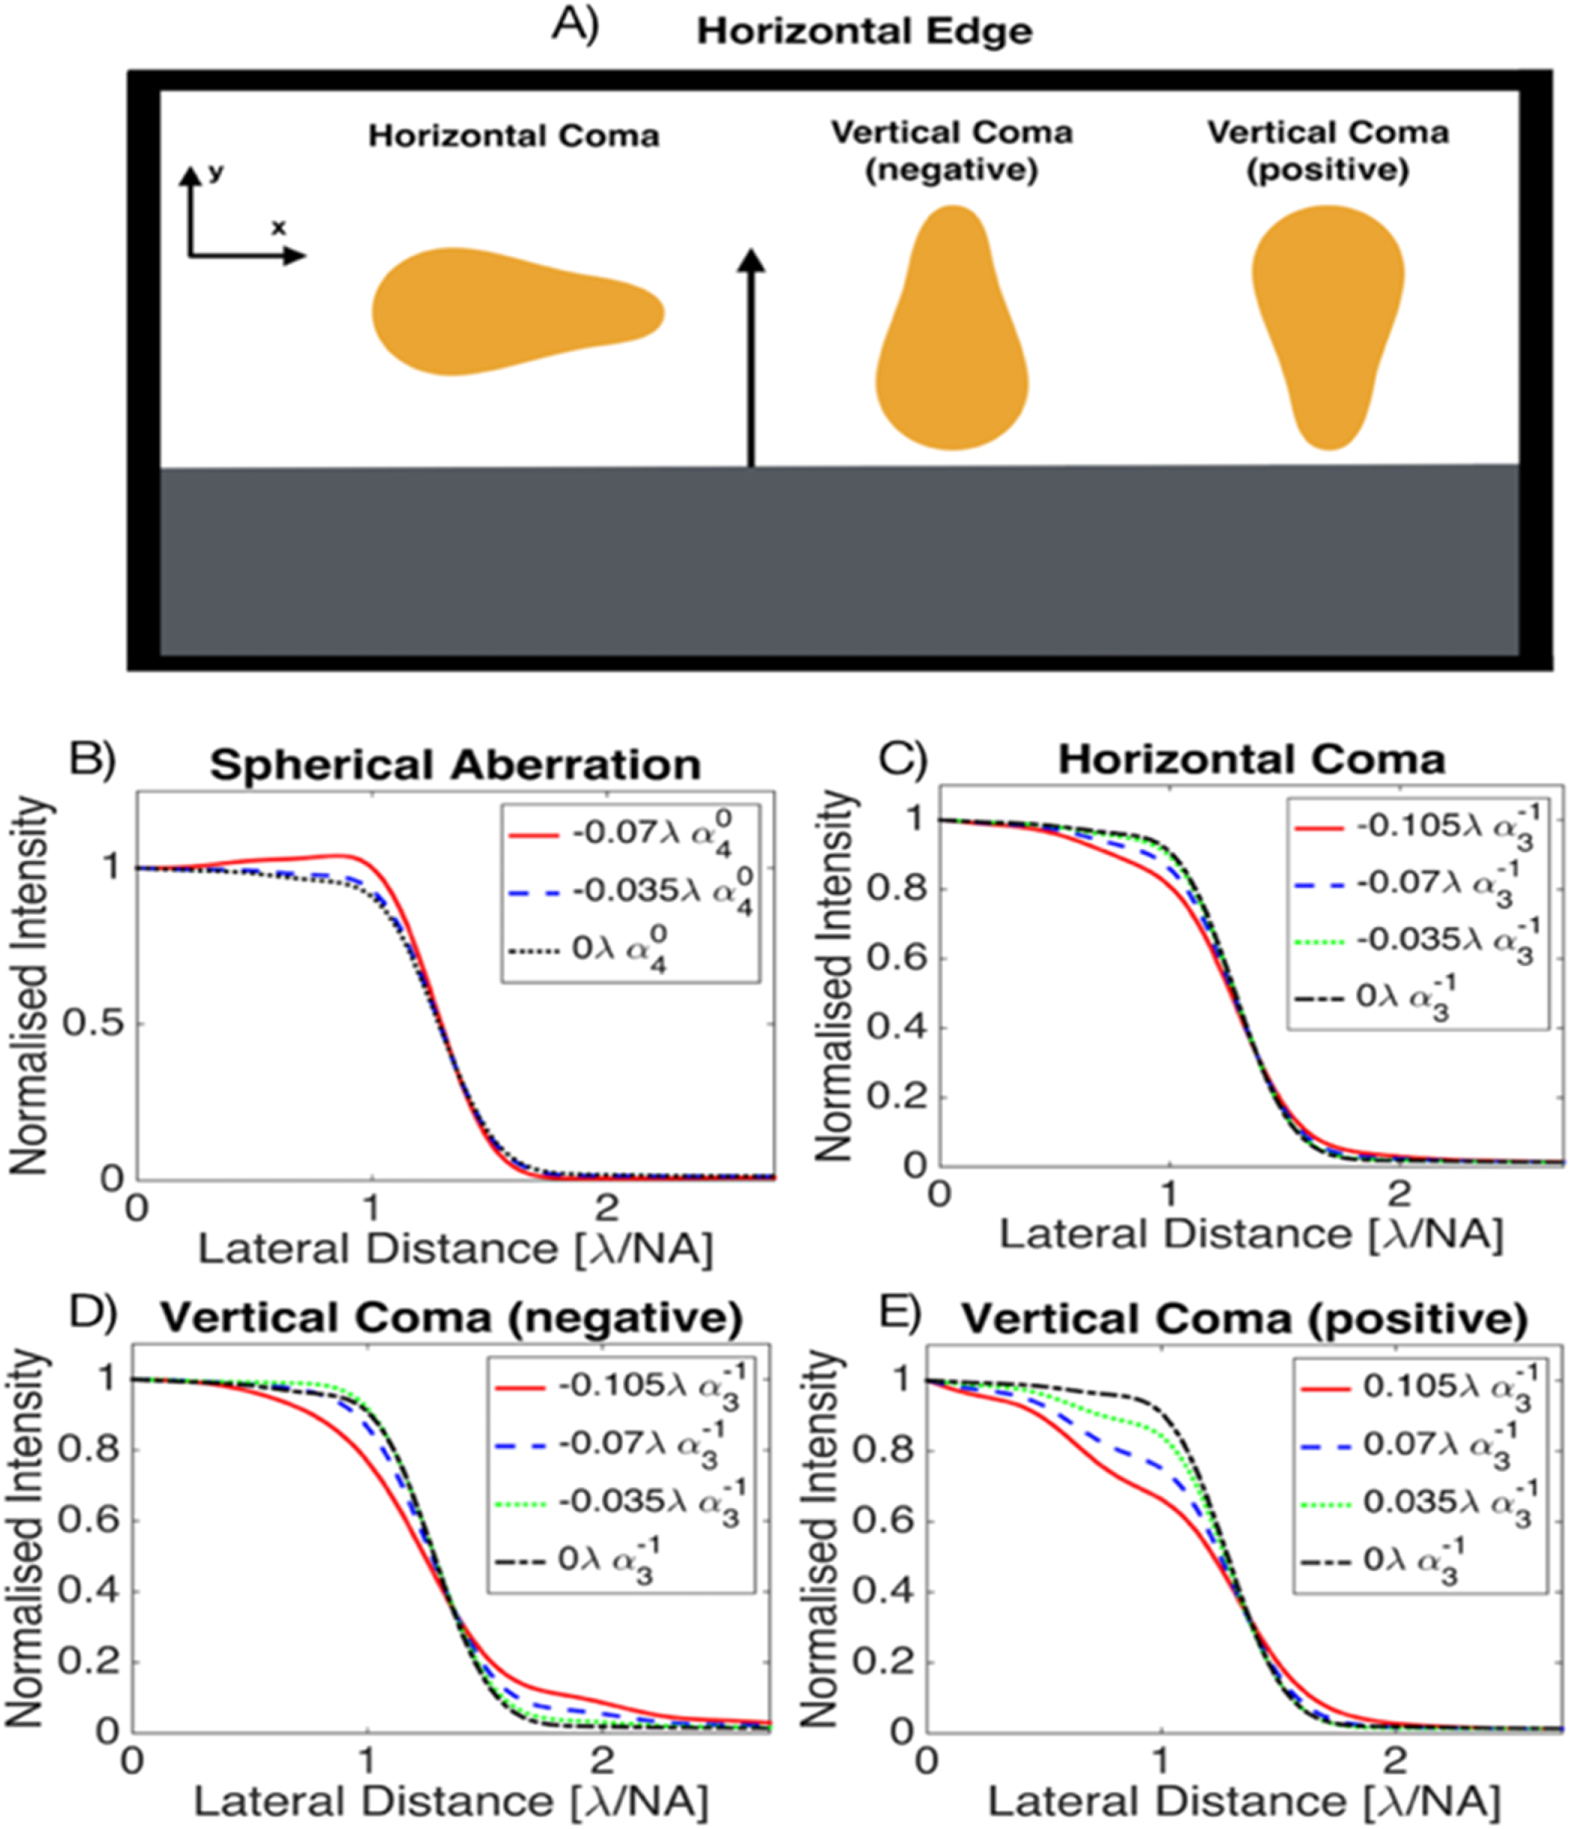
The orientation of the edge and the aberrated spots with horizontal and vertical coma are shown in figure 2(A). In figures 2(B)–(E) simulated edge responses in the presence of primary spherical aberration, horizontal coma and vertical coma are plotted for varying aberration amplitudes. The intensity at the detector was spatially filtered with a 0.6 AU diameter pinhole. Each curve was normalised with its intensity value at the lateral distance  The aberration amplitude range for odd aberrations was chosen to be [−0.105λ, 0.105λ] which is larger than the range for even aberrations: [−0.07λ, 0.07λ] since even aberrations are doubled in amplitude at the detector due to the double-pass effect.

Figure 2. (A) Horizontal edge scan geometry. The orientation of the coma tail for a spot with vertical coma or horizontal coma is shown for each case. The scan direction is along the y axis. The white area represents the reflective surface whereas the grey area represents the non-reflective surface. (B)–(D) The simulated edge responses for a confocal reflection microscope, edge extending along the x direction and pinhole 0.6 AU. Each plot shows different amounts of (B) spherical aberration, (C) horizontal coma, (D) vertical coma (negative amplitudes) and (E) vertical coma (positive amplitudes).
Download figure:
Standard image High-resolution imageAt focus, the intensity distribution produced by an even aberration does not alter with the sign of the wavefront aberration, therefore, the edge responses of figure 2(B)) would be the same if the sign of the wavefront aberrations was changed. Horizontal coma produces a 'comet' shaped focal spot, with the coma flare orientation being parallel to the edge (see figure 2(A)). By changing the sign of the horizontal coma coefficient, one effectively flips the coma tail orientation by 180°. Therefore, when the coma flare aligns with edge, the edge response for coma will not depend on the sign of the wavefront aberration (figure 2(C)). However, when the coma flare is perpendicular to the edge, the edge scan will produce two distinct types of responses depending on the sign and amplitude of the wavefront aberration, as can be seen in figures 2(D) and (E).
For the configuration in figure 2(A) and vertical coma, the edge response one obtains will depend on whether the coma flare is scanned last (figure 2(D)) or first over the edge (figure 2(E)). In figure 2(D), the edge response gets broader in the lower intensity region with increasing aberration amplitude, especially when the intensity is between 0% and 20% of the maximum intensity. In figure 2(E), the edge response is visibly affected in the high intensity region. A pronounced broadening of the edge response occurs in the region where the intensity is between 60% and 90% of the maximum intensity. This edge response broadening becomes more pronounced when the aberration amplitude increases. The edge response in figures 2(D) and (E) have distinct shapes and can be used to detect the presence of coma in a reflection confocal microscope. It was further found that these features of the edge responses were more pronounced for smaller pinhole sizes. To be sensitive to the sign of horizontal coma, it would be necessary to change the scan direction and the edge orientation by 90°.
3. Experimental data
To test the feasibility of the approach a USAF microscope resolution target—positive pattern (Edmund Optics, chrome pattern on glass) was scanned with a reflection confocal microscope including a DMM (see figure 3). The detector consists of an EMCCD camera. In a similar approach to that presented by See et al, confocal detection was achieved by summing the intensity of a certain number of pixels on the EMCCD camera [12]. A pinhole mask (see figure 3) was placed at the beginning of the scan on the pixel of highest intensity and the position fixed during scanning. The confocal signal is obtained by summing the intensity pixel values lying inside the pinhole mask.
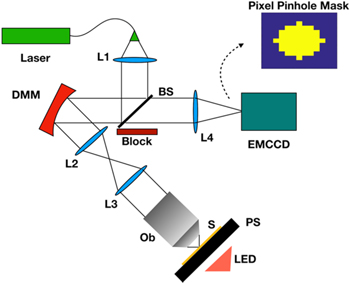
Figure 3. Confocal reflection microscope with DMM. L: lens; BS: beamsplitter; DMM: deformable membrane mirror; Ob: objective; S: sample; PS: piezo-stage.
Download figure:
Standard image High-resolution imageLaser light (532 nm), injected in a single mode fibre, provides illumination for the sample scanning confocal microscope. The DMM was a Mirao52e (Imagine Optics) DMM. The DMM is conjugated to the pupil of the microscope objective (Ob) via a lens pair, L2 and L3. The microscope objective is a 0.75 NA, multi-immersion Nikon objective lens. The reflected light from the sample is focussed via lens L4 on an EMCCD iXon 885 (Andor). Additionally, an LED light source was placed behind the sample stage for sample inspection in wide-field. The sample stage P-733.3DD (PI Instruments) is piezo driven in order to scan the microscope resolution target. The angle of incidence of the laser beam on the DMM is about 14° with respect to the normal. The DMM acts on both the incident as well as on the returned beam and therefore forms part of a double-pass set-up. The DMM was calibrated using the closed-loop approach proposed by Shaw et al [14] and a Shack-Hartmann wavefront sensor WFS150 (Thorlabs) having a specified sensitivity of λ/50 rms. The DMM calibration took place in situ to account for the 14° offset from the normal. The system aberrations were measured by replacing the EMCCD with an additional lens and a wavefront sensor and using light emitted from a fluorescent bead placed in the focal plane of the microscope (a fluorescent filter was put in between the beamsplitter and lens L4 during the system aberration measurement and removed thereafter). The system aberrations were then corrected with the DMM. The size of the corrected focal spot was measured to be about 9 pixels in diameter (which corresponds to 72 μm on the detector and is about 10% larger than the theoretical value of the Airy disk 65 μm. The size of the Airy disk at the object plane was about 1 μm).
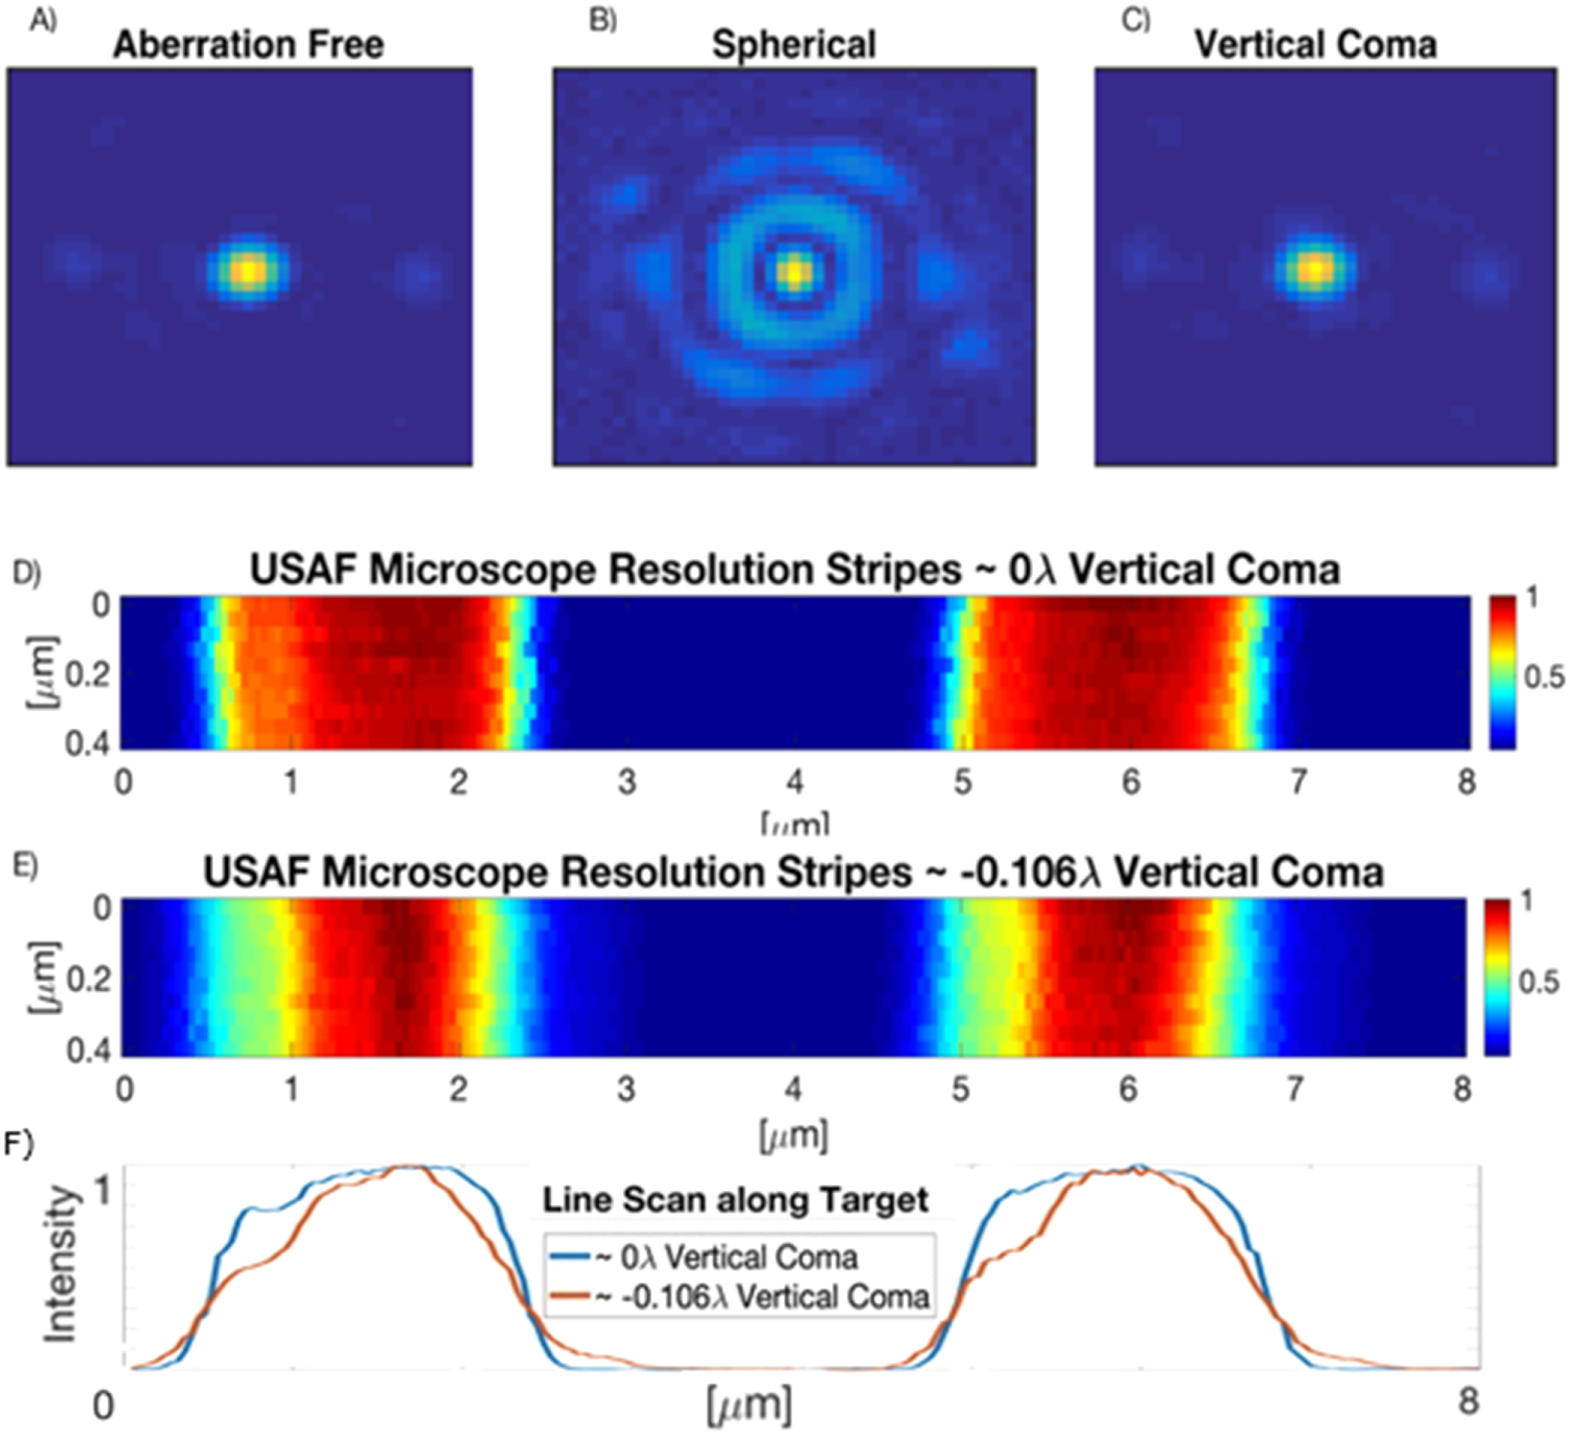
Images of aberration free and aberrated focal spots, reflected off a mirror in the focal plane of the microscope are shown in figures 4(A)–(C). Figures 4(D) and (E) show scanned images of resolution stripes (USAF target; scan geometry as in figure 2(A); USAF resolution stripes in figures 4(D) and (E) were plotted horizontally for convenience) with an aberration corrected microscope (figure 4(D)) and with some coma aberration imposed (figure 4(E)). Aberrations were applied with the DMM. The satellite spots around the aberration free focal spot can be explained as being caused by diffraction off the periodic actuator pattern of the DMM [15]. At the image plane (shown in figures 4(A)–(C)), these satellite spots are far from the central Airy disk and therefore do not contribute to the edge response curves.

Figure 4. (A) Aberration free and (B), (C) aberrated focal spots reflected off a mirror in the focal plane of the microscope recorded in the detector plane. An aberration amplitude of ∼0.075λ was applied with the DMM: (B) spherical aberration, (C) vertical coma. Images of scanned resolution stripes with an aberration corrected microscope (D) and with −0.106λ coma aberration imposed (E). (F) Comparison of line scans drawn horizontally through (D) and (E).
Download figure:
Standard image High-resolution imageAs can be seen from figure 4(C), odd aberrations (coma in this example) are cancelled after the second pass through the system and the resulting focal spot at the detector plane resembles the aberration free focal spot, figure 4(A). The coma aberration at the detector plane is compensated by the double-pass effect (see also figure 1, bottom right). As regards the image of the USAF resolution stripes, when no aberrations are present the edge responses on both sides of a stripe are sharp (figures 4(D) and (F)). Whereas in figures 4(E) and (F), when vertical coma is present the edge response, containing high spatial frequencies, is much broader on the left-hand side of a stripe than the edge response on the right-hand side of a stripe.
In figure 5, experimental results of edge responses in the presence of aberrations are shown. Primary coma and spherical aberration were applied independently from each other with the DMM.
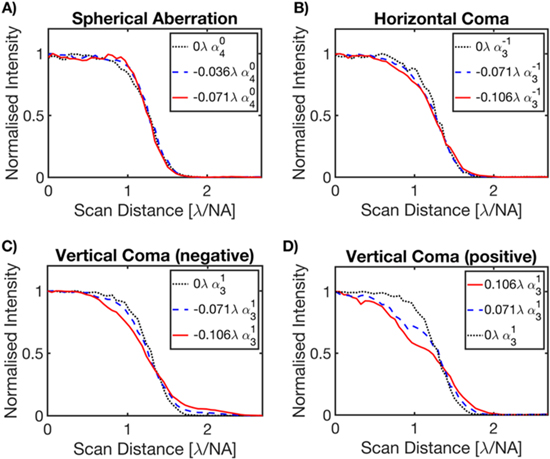
Figure 5. Experimental edge responses recorded using a confocal reflection microscope with a 0.6 AU pinhole. Each curve is normalised with respect to its intensity value at the lateral distance  The edge responses for (A) spherical aberration, (B) horizontal coma, (C) vertical coma (negative amplitudes) and (D) vertical coma (positive amplitudes).
Download figure:
Standard image High-resolution image
The resolution target was brought into focus by finding the axial position where the focal spot, reflected off the chrome pattern far away from an edge, had its highest intensity (best focus). Each aberrated focal spot was then scanned over an edge. The first and last scans were with a corrected focal spot in order to check that the edge responses were similar and to assure that the resolution target had not significantly drifted laterally during the scan series. For spherical aberrations (figure 5(A)) as well as for horizontal coma (figure 5(B)), changing the sign of the wavefront aberration did not significantly change the shape of the edge response. However, for vertical coma, one sees two distinct sets of edge responses depending on the sign of the aberration. For vertical coma edge responses, there is a slow decrease in intensity at the top or bottom of the edge, depending on if the coma flare is scanned first or last, and this depends on the sign of the coma wavefront aberration (see figures 5(C) and (D)).
4. Discussion
The results confirm that the presence of coma can be detected by observation of a high spatial frequency feature, such as an edge response, in a reflection confocal microscope. The sign of the coma wavefront aberration as well as its orientation can be determined by scanning a focal spot across two orthogonal edges to detect horizontal and vertical coma. The broadening of the edge response in the high intensity region of the scan has a characteristic signature of a coma aberrated focal spot. The coma aberration amplitude can be estimated from the shape of the edge response (see figures 5(C) and (D)). A criterion based on the width of an intensity region, for example, the scan distance over which the intensity changes from 60% to 90% of the maximum intensity, could be used to determine the amount of coma present by comparing it with theoretical curves (compare figure 2(E) with 5(D)). Alternatively, a low intensity section (e.g. the region where the intensity lies between 5% and 20% of the maximum intensity) could be used, but this region would be less reliable due to poor contrast and low signal to noise ratio. By comparing figure 5(D) with 2(E), we were able to detect coma amplitudes >∼0.035λ and up to ∼0.14λ with an accuracy of ±0.02λ.
Furthermore, it was found that the sensitivity to coma can be increased by reducing the pinhole size. In future, coma detection and correction in a reflection confocal microscope could be achieved using an indirect wavefront sensing optimisation approach [4, 6] but, instead of optimising on intensity at the pinhole, optimising on the sharpness of the edge response, for example.
The edge responses were studied in the presence of a single aberration only, and not for aberration combinations. The presence of trefoil could also be detected with edge scans. In the case of trefoil, an additional scan under a different edge orientation (60°) would be needed to fully probe the spot shape.
To demonstrate the approach, a highly reflective USAF test sample was used that preserves the phase of the light upon reflection. If a more scattering sample was chosen, which contained an edge feature with similar high spatial frequency components, then some of the signal photons would be lost but the overall shape of the edge response curve would remain the same. As long as the signal to noise ratio was such that the features of the edge response curve were still observable, then the approach presented here could still be used.
Presented in this manuscript is a generalised approach that would be useful in any reflection imaging system when aberration correction is required. Regardless of the sample, an initial correction is often needed to remove the system induced aberrations due to the optical path before and after the sample. To correct for system induced aberrations, often a test sample is used; if this sample is a plane mirror, it will not be possible to detect and correct for odd aberrations. However, if a test sample such as an edge containing high-spatial frequency features is used, the detection and correction of odd aberrations will now be possible. When odd and even aberrations are present in the system, a wavefront sensor and a DMM can be used first with a flat mirror at the sample plane to detect and remove the even aberrations before replacing the mirror with an edge feature to detect and correct for the remaining odd aberrations. Uncorrected odd aberrations not only degrade the image quality but also lead to greater inaccuracies when localising features present in the sample. Shepard et al showed that the spatial position of an edge in a confocal reflection microscope is said to be when the intensity value lies in the 25%–32% range, depending on pinhole size, for an aberration free microscope [16]. The results presented in this manuscript show that if coma goes uncorrected this would lead to greater ambiguities when identifying the position of an edge in a sample.
Acknowledgments
A J W acknowledges financial support from the Royal Academy of Engineering and EPSRC via a personal research fellowship. This work is supported by linked EPSRC, BBSRC and MRC Grant Nos. EP/R035563/1, EP/R035067/1 and EP/R035156/1.