


Abstract
The asymmetric vortices over a blunt-nose slender body are investigated experimentally and numerically at a high angle of attack (AoA, α = 50°) and a Reynolds number of ReD = 1.54 × 10⁵ on the basis of an incoming free-stream velocity and diameter (D) of the model. A micro-perturbation in the form of a hemispherical protrusion with a radius of r = 0.012D is introduced and attached on the nose of the slender body to control the behavior of the asymmetric vortices. Given the predominant role of micro perturbation in the asymmetric vortex pattern, a square wave, which is singly periodic, is observed for side-force variation by setting the circumferential angle (θ) of the micro perturbation from 0° to 360°. The asymmetric vortex pattern and the corresponding side force are manageable and highly dependent on the location of perturbation. The flow structure over the blunt-nose slender body is clarified by building a physical model of asymmetric vortex flow structure in a regular state at a high AoA (α = 50°). This model is divided into several regions by flow structure development along the model body-axis, i.e., inception region at x/D ≤ 3.0, triple-vortex region at 3.0 ≤ x/D ≤ 6.0, four-vortex region at 6.0 ≤ x/D ≤ 8.5, and five-vortex region at 8.5 ≤ x/D ≤ 12. The model reveals a complicated multi-vortex system. The associated pressure distributions and flow characteristics are discussed in detail.
Export citation and abstract BibTeX RIS
Communicated by: Professor Laurent B Mydlarski
1. Introduction
With the advancement of aerodynamics and flight control, air vehicles under development must possess high maneuverability, which is usually achieved by flying at a high angle of attack (AoA) (Zhu 1996). However, uncertain separation flows, which is featured by asymmetric vortices, occur over the slender body, a basic geometry of air vehicles (Hsieh and Wang 1996). The pattern of asymmetric vortices is highly random, because of the uncertainties in manufacturing and the surrounding conditions (Bridges and Hornung 1994). The unexpected side-forces and generated yawing moments are consequently greater than those offered by the rudders of air vehicles (Hunt 1982), thereby greatly effecting flight stability. Thus, controlling the asymmetric vortex pattern over slender bodies is a practical strategy.
In order to uncover the flow physics underlying such phenomena, scholars have intensively investigated the asymmetric vortices over slender bodies in the absence of an artificial perturbation at a high AoA (Dexter and Hunt 1981, Lamont 1982, Yanta and Wardlaw 1982). In these studies, the small changes in the roll angle of the test model drastically changed the asymmetric vortex pattern and measured side forces. Pick (1971) is the first to study the asymmetric vortices generated over a slender body. The author speculated that side forces emerge at a high AoA because of the microasymmetries and geometrical imperfections near the nose. Keener et al (1977) also reported that the pattern of asymmetric vortices is mainly affected by the pointed nose instead of the afterbody. Ng (1990) showed that the small region close to the nose apex is important in controlling asymmetric vortices.
Another fundamental phenomenon occurring over slender bodies is the two different types of steady separation flows. Open-type separation is a characteristic of the flow on pointed-nose slender bodies. In this separation flow, the side force tends to commence at the nose. By contrast, the close-type separation occurs on blunt-nose slender bodies and is characterized by a U-shaped horseshoe vortex that develops on top of the blunt nose. This flow structure is derived from the closed type of surface flow separation; this type restricts the emergence of asymmetry (Wang and Liang 2004).
Extensive investigations have focused on asymmetric flows over pointed-nose slender bodies. Rao (1979) suppressed the side forces at a high AoA successfully by mounting a pair of helical trips on pointed forebodies. Ericsson and Reding (1980, 1981) found that nose blunting, strakes over the forebody, booms on the nose, or body trips can be used to effectively reduce the vertical structure asymmetry on a pointed-nose slender body. Some investigations have focused on passive and active approaches to prevent the random occurrence of asymmetric vortex and thus manipulate the flow pattern, and in turn, the side forces and moments. Luo et al (1998) examined the effect of forebody geometry on the side force of a pointed-nose slender body at a high AoA and revealed that the elliptic tip produces more predictable side forces with different roll angles than the sharp ogive tip. Zilliac et al (1991) studied a pointed-nose slender body and concluded that the microvariations on its nose substantially influence the downstream development of the flowfield. Deng et al (2003) induced a tiny particle measuring only 0.2 mm in diameter to disturb the asymmetric vortices over a pointed-nose slender body at a high AoA. The microperturbation was then placed on the tip of the pointed-nose slender body. The vortex pattern was fairly manageable in the presence of the microperturbation, and the square wave, which is doubly periodic, was observed for the side-force variation with a roll angle from 0° to 360° (Chen et al 2002, Deng 2004, 2008).
In the field of high AoA control, studies on asymmetric flow and side-force alleviation have mainly focused on pointed-nose slender bodies; however, those on blunt-nose slender bodies are still scarce. Moskovitz (1990) introduced a cylindrical bead (1.6 mm high and 3.2 mm wide) attached to a blunt nose to disturb vortical flows. The randomness of the vortex pattern was inhibited by perturbation; hence, the measurement of side-force was determinate and highly repeatable. Similar observations were reported by Lopera and Terry (2007) by using a strake (3 mm high and 5 mm long) attached on a blunt nose. These additional units exhibited relatively large physical sizes and unexpectedly induced the local flow separation. However, to the best of our knowledge, no study has investigated the effects of microperturbation on the asymmetric vortices over blunt-nose slender bodies.
This work focused on the effects of the location of microperturbation on the vortical structures over a blunt-nose slender body at a high AoA. The asymmetric vortex structure was described in detail when a tiny hemisphere was attached onto the nose of the slender body. Wind tunnel tests and numerical simulations are conducted at a Reynolds number ReD = 1.54 × 10⁵. Flow structures and forces were examined. The test model and approaches are described in section 2, the results are discussed in section 3, and the conclusion is presented in section 4.
2. Test model and approaches
2.1. Test model
Figure 1 presents the schematics of the test model of a blunt-nose slender body, along with symbol designations. The test model included three parts, i.e., the blunt nose, the cylindrical slender afterbody, and the conical part connecting the former two parts. The blunt nose, which was a part of a ball of radius 27.2 mm (=0.4121D), exhibited a bluntness of 80%. Bluntness is defined as the ratio between the nose diameter and the afterbody diameter. The cylindrical slender afterbody held a diameter D = 66 mm and a full length of 1060 mm (=16.0606D). The conical part was 38.21 mm long (=0.5789D) with an 18° apex angle. The coordinate system was defined at the tip of the blunt nose (i.e., the origin) with the x-direction found along the symmetric axis of the slender body, and the y- and z-directions represent the horizontal and vertical axes, respectively, in the normal plane to the slender body axis (figure 1). The blunt-nose slender body involved an AoA α, which was the incident angle of the incoming flow to the x-direction. A tiny hemisphere with a radius r = 0.012D was used as the microperturbation and was attached onto the nose surface. Its location was determined by two angles, namely, the meridian and circumferential angles γ and θ, respectively. γ is the angle between the x-axis and the nose radius corresponding to the perturbation location (figure 1(a)), and θ is the angle between the z-axis and the sectional radius corresponding to the perturbation location (figure 1(b)). The location of the measured pressure is indicated by the angle θs between the negative z-axis and the sectional radius corresponding to the measured pressure location.

Figure 1. Schematics showing the test model of a blunt-slender body, together with symbol designations. (a) Side view; (b) end view. Units of length scale are in mm.
Download figure:
Standard image High-resolution imageA test model with pressure taps was used in the pressure measurements. Seven tapping stations were prepared (figure 1), and each station had 24 equally spaced taps along the circumference. The pressure tap showed a diameter of 1 mm, and all the curves were fitted through the data points were based on the spline fitting method.
2.2. Wind tunnel tests
Experiments were performed in a low-speed open-circuit wind tunnel with a 2.5 m long square test section measuring 1.5 m × 1.5 m in size. The tunnel involved a velocity range of 2–60 m s−1 and turbulence intensity of ≤0.08%. The wind tunnel was equipped with a support mechanism with an automated turntable driven by an electric motor, which allows for remote model positioning and a C-strut for the change in AoA. The test model of the blunt-nose slender body was sting mounted on the support mechanism (figure 2). The sideslip angle can be varied in the range of −90° to 90° by rotating the turntable, and the AoA can be varied in the range of 0 °C–70° by sliding the model along the C-strut. The incoming freestream showed a V∞ = 35 m s−1 in all the following tests. This value corresponded with the Reynolds number ReD = 1.54 × 10⁵ on the basis of D and V∞.

Figure 2. Setup of the test model in a wind tunnel.
Download figure:
Standard image High-resolution imagePressure distributions around the test model were obtained through a pressure scanning system from the PSI Company. The system consisted of a DTC initium module and electronic scanning pressure (ESP) modules with an uncertainty within ±7 Pa. Each module possessed 64 channels. Thus, three ESP modules were entailed for the pressure measurement of the seven sections (see figure 1). Each pressure tap on the test model was connected to one channel on the ESP module with a tube of 1 mm inner diameter. The DTC initium module, which showed a maximum sampling frequency of 600 Hz, received the data measured from the ESP modules through the data cables and then sent the data to a personal computer. The sampling frequency in this paper was 50 Hz, and the record time was 12 s in the pressure measurements.
2.3. Numerical simulations
In the present work, 3D transient simulations were employed to simulate the flow around a blunt-nose slender body. The small vortex structures in the region near the body play a significant role in determining the overall flow field (Moskovitz 1990). Similar to Anwar et al 2005, we used the shear–stress transport k-ω turbulence model that considers the unsteady Reynolds-averaged Navier–Stokes equations, which are solved using the finite-volume method. This turbulence model can resolve the turbulent flow far from the wall and the boundary-layer flow close to the wall, thereby ensuring a highly accurate prediction of the flow separation with adverse pressure gradients (Menter 1993). This turbulence model has been used by Zhou et al (2010) and Liu et al (2016) in their simulations of turbulent flows around bluff or slender bodies.
The computational domain is a cylinder with a diameter of 60D and a length of 90D. The inlet boundary was at 30D upstream of the model tip (i.e., origin of the coordinate system), and the outflow boundary was located at the 60D downstream of the model tip. The pressure far field condition was applied to the computational domain, and the constant free-stream velocity (i.e., V∞) was imposed. The AoA of the slender body model was determined by the two components of V∞ along the x- and z-directions. The wall condition was applied to the surfaces of the blunt-nose slender body and the microperturbation, whereas the 'no-slip' condition was applied to the model surface.
The distance between the model surface and the nearest grid points was y+ < 1. A progression ratio of approximately 1.1 was used to cluster the grid points radially outward from the body surface. A total of 200 grids were presented around the cylinder circumference and yielded 5 million cells in the entire computational domain. The finite volume discretization of a second-order upwind scheme was applied for the momentum and temporal discretization. The velocity–pressure coupling was based on the algorithm of Semi-Implicit Method for Pressure-Linked Equations-Consistent.
3. Results and discussion
3.1. Effect of perturbation location
Figure 3 presents the variations of Cy with x/D when the microperturbation was placed at different circumferential angles θ (α = 50°, γ = 10°). Cy is defined as  where p(i) is the time-averaged static pressure measured at the ith tap. The data from the wind tunnel tests were included. The Cy–x/D curves were divided into two families that are nearly symmetric about Cy = 0 within the entire x/D range. In particular, the two families of curves revealed that the side forces were stabilized into two regular states when the microperturbation was induced on the nose at θ = 0° to θ = 180° or θ = 180° to θ = 360°. The special Cy–x/D curve of θ = 180° showed that the critical perturbation locations of the transform between both regular states produced a weak side force. The behavior of Cy for these different θ indicated the sectional side force. Thus, the overall side force acting on the slender body was determined in the presence of perturbation.

Figure 3. Variation of Cy with x/D in the presence of a micro perturbation (γ = 10°). Test are carried out at the AoA α = 50° and different circumferential angles θ.
Download figure:
Standard image High-resolution imageFigure 4 presents the variation with θ of the sectional side force coefficient (Cy) at different sections (x/D) in the presence of microhemispherical perturbation (γ = 10°, α = 50°, and r/D = 0.012). The square-wave shape was observed for any an x/D when θ was increased from 0° to 360°. This result implies that only two values of the side forces, either positive or negative, existed. For example, given x/D = 3, the switch from the negative Cy to the positive Cy occurred at θ ≈ 180°, where the symmetrical xz-plane was located. The magnitudes of Cy were almost uniform at 0° < θ < 180° or 180° <θ < 360°. These observations indicated that the sectional side force acting on the slender body was manageable in the presence of the perturbation. Notably, the magnitudes of Cy were slightly different at 0° < θ < 180° and 180° < θ < 360°. This difference may be due to the effects of the uncertain natural perturbations over the slender body (Pick 1971).

Figure 4. Variation with θ of Cy at different sections (α = 50°, γ = 10°) in the presence of a micro perturbation, which is a hemisphere with a radius of r/D = 0.012.
Download figure:
Standard image High-resolution image3.2. Asymmetric vortices flow structure
Given the predominant role of microperturbation in asymmetric vortex patterns, a singly periodic square wave was observed for the side-force variation with the circumferential angle (θ) of microperturbation set from 0° to 360° around the body axis (figure 4). However, the characteristic of a single period differed from that of a double period in a pointed-nose slender body (Chen et al 2002). The flow structure over a pointed-nose body at a high AoA was described in detail by Deng and Wang (2004), but no study has described the flow structure over a blunt-nose body at a high AoA. The detailed asymmetric vortex structure over a blunt-nose body at a high AoA (α = 50°) was discussed in this section.
Figure 5 presents the variations of Cy with x/D when the microperturbation was placed at the circumferential angle θ = 90° and the meridian angle γ = 10° (α = 50°). Data from both numerical simulations and wind tunnel tests were included. The numerical data were in good agreement with the experimental data and hence validated the present numerical simulations. The Cy variation with x/D was sinusoidal with reducing amplitudes. This trend suggested that the curve was inherently related to the evolution of the complicated asymmetric vortices along x/D. In particular, figure 6 presents the distributions of instantaneous pressure and the streamlines of asymmetric vortices at high AoA values (α = 50°, θ = 90°, and γ = 10°). These distributions were closely related to the curve shown in figure 5. Therefore, the Cy variation with x/D (figure 5) was divided into different regions along x/D based on the development of flow structure over the blunt-nose slender body. These regions included the inception region at x/D ≤ 3.0, the triple-vortex region at 3.0 ≤ x/D ≤ 6.0, the four-vortex region at 6.0 ≤ x/D ≤ 8.5, and the five-vortex region at 8.5 ≤ x/D ≤ 12. The evolution of asymmetric vortices along the body axis was described in detail through the pressure distributions of sections (figure 7).
- (1)Inception region (A–B) and fully developed region (B–C) of asymmetric vortices
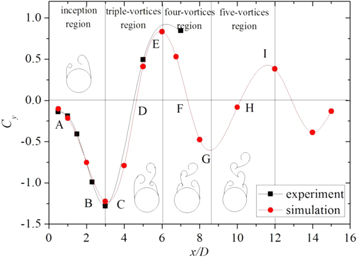
Figure 5. Region division and variation of Cy with x/D in the presence of a micro perturbation (α = 50°, γ = 10° and θ = 90°).
Download figure:
Standard image High-resolution image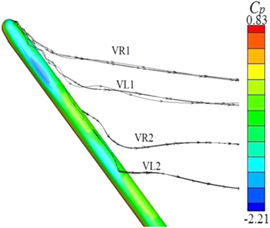
Figure 6. Distributions of instantaneous pressure and streamlines of asymmetric vortices at high AoA (α = 50°, θ = 90°, and γ = 10°).
Download figure:
Standard image High-resolution image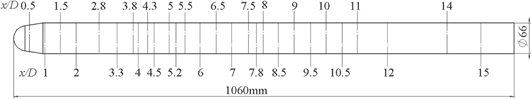
Figure 7. Sketch of pressure-tapped stations of model.
Download figure:
Standard image High-resolution imageFigure 8 presents the variations of the pressure coefficient Cp with the sectional angle θs and distributions of instantaneous vorticity at x/D = 1, 1.5, and 2 (α = 50°, θ = 90°, and γ = 10°). Cp is defined as  where p(θs) is the time-averaged static pressure obtained at the location corresponding to θs. Numerical simulation data were included. Figure 8(a) presents the pressure distributions at x/D = 1, 1.5, 2 located in the inception region (A–B). The reattachment pressure peak on the lee side θs = 180°, which is a typical feature of twin vortices, indicated that asymmetric twin vortices occurred in this region. This occurrence can be verified in figure 8(b), which presents the instantaneous vorticity at x/D = 1, 1.5, 2. The magnitude of attachment peak, which decreases with the increasing x/D, implied the increase of vortex structure asymmetry. The magnitude of suction peak at θs = 160°, which was increased, indicated formation of the left vortex (VL1). However, the decreasing suction peak at θs = 200° suggested that the right vortex (VR1) was lifted from the surface. The separation points, which are indicated by the separation locations where the wall shear stress vanishes, moved to the sides (θs = 90°, 270°) with x/D. These phenomena indicate that VR1and VR2 developed in this region (A–B). However, VR1 grew faster than VL1, and this difference increased the Cy magnitude with x/D in the region (A–B) (figure 5). The (A–B) region was therefore named the inception region of asymmetric vortices.
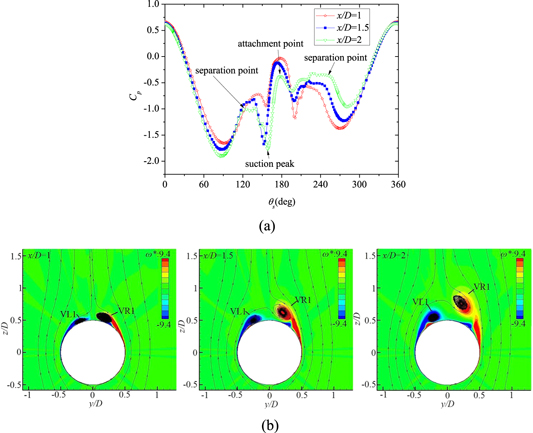
Figure 8. Asymmetric twin vortices region in (A–B) (α = 50°, θ = 90°, and γ = 10°). (a) Variations of Cp with the sectional angle θs; (b) distributions of instantaneous vorticity.
Download figure:
Standard image High-resolution imageFigure 9 presents the variations of the pressure coefficient Cp with the sectional angle θs and the distributions of instantaneous vorticity at x/D = 2.5, 2.8, 3.3 (α = 50°, θ = 90°, and γ = 10°). These distributions corresponded to the fully developed region of asymmetric twin vortices. This result can be further confirmed by the disappearance of the reattachment pressure peak and the emergence of a strong suction peak near the lee side of θs = 175° (figure 9(a)). Such disappearance and emergence can be verified in figure 9(b), which presents the instantaneous vorticity at x/D = 2.5, 2.8, 3.3, and the breaking away of VR1 from the surface. Thus, the Cy–x/D curves (figure 5) collapsed at x/D = 3.3. This collapse indicated that the maximum asymmetry was achieved. Thus, this region (B–C) was named as the fully developed region of asymmetric vortices.
- (2)Asymmetric triple vortex region (C–E) and peculiar points C and D.
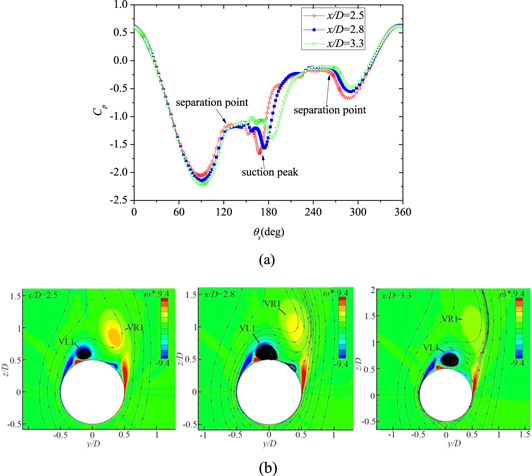
Figure 9. Asymmetric twin vortices region in (B–C) (α = 50°, θ = 90°, and γ = 10°). (a) Variations of Cp with the sectional angle θs; (b) distributions of instantaneous vorticity.
Download figure:
Standard image High-resolution imageIn figure 5, the sectional side force continuously increased with x/D in the twin-vortex region and decreased after the maximal point C. Figure 10 shows the variations of the pressure coefficient Cp with the sectional angle θs and the distributions of instantaneous vorticity at x/D = 3.3, 3.8, 4, 4.3 (α = 50°, θ = 90°, and γ = 10°) to explain the collapse at point C. Figure 10(b) reveals that VR1, which was the high vortex (further away from the surface), broke away from the surface at x/D = 3.3, and a new vortex VR2 was generated because of the separated shear layer downstream of point C. VR2, which grew along the body axis (x/D), increased the negative pressure and thus reduced the sectional side force. Therefore, the maximal point C in the curves of Cy–x/D signified the breakaways of the right vortex VR1 from the surface and the generation of a new vortex VR2. Figure 10(b) presents the flow structure, which was an asymmetric triple-vortex system that included three vortices, i.e., VL1, VR1, and VR2. VR2 was at the low position, whereas VL1 was at the high position near the body surface. However, VR1 was shed off from the surface and was positioned higher than its previous one. The induction of this triple-vortex system explains why the pressure distribution at the downstream of point C (x/D = 3.8) differed from that in the twin-vortex region (B–C) (figure 10(a)).
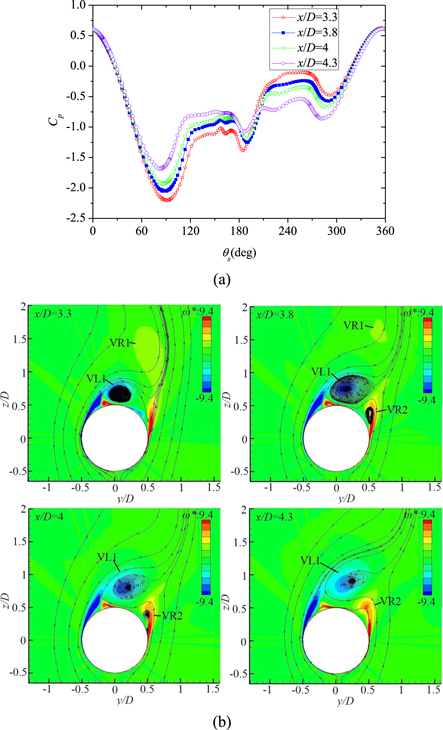
Figure 10. Asymmetric triple vortices region in (C–D) (α = 50°, θ = 90°, and γ = 10°). (a) Variations of Cp with the sectional angle θs; (b) distributions of instantaneous vorticity.
Download figure:
Standard image High-resolution imageFigure 11 shows the variations of the pressure coefficient Cp with the sectional angle θs and the distributions of instantaneous vorticity at x/D = 4.3, 4.5, 5, 5.2 (α = 50°, θ = 90°, and γ = 10°). Figure 5 reveals that the sectional side force continued to decrease to a positive value at these sections because of the further development of VR2 in the downstream direction. The D point (x/D = 4.5), which is shown in figure 5, was a peculiar point marking a sectional side force of zero. Figure 11(a) illustrates the curve of Cy–x/D at x/D = 4.5, and the sectional pressure distribution was nearly symmetric about θs = 180°. However, the symmetric pressure distribution at x/D = 4.5, which was in the asymmetric triple-vortex region, differed from that of the symmetric twin vortices (pressure coefficient Cp variation with the sectional angle θs at x/D = 1, as presented in figure 8(a)). The former exhibited the suction peak near the symmetric plane on the lee side (figure 11(a)), whereas the latter attained a pressure peak because of flow reattachment.

Figure 11. Asymmetric triple vortices region around station D (α = 50°, θ = 90°, and γ = 10°). (a) Variations of Cp with the sectional angle θs; (b) distributions of instantaneous vorticity.
Download figure:
Standard image High-resolution imageWith the further development of the triple vortices, especially the new vortex VR2, the right negative pressure increased and resulted in the continual increase in the sectional side force at the positive direction (figure 5). Finally, a positive maximum was reached at point E (x/D = 6). Figure 11(a) depicts the curves of Cy–x/D at x/D = 4.3, 5.2. These curves displayed different features and were separated in the inception region (C–D) and the fully developed region (D–E) of the asymmetric triple-vortex region. VR2 was weak in the inception region (C–D) of the asymmetric triple-vortex region, and the pressure distribution was mainly controlled by the vortices VR1 and VL1. As a result, a typical step shape was attained (figure 10(a)). By contrast, vortex VR2 began strong enough in the fully developed region (D–E) of the asymmetric triple-vortex region, and the pressure distribution in this region varied smoothly under the control of the triple vortices at x/D = 5.2 (figure 11(a)).
- (3)Asymmetric four vortex region (E–G), five vortex region (G–I) and peculiar points.
Figure 12 presents the variations of the pressure coefficient Cp with the sectional angle θs and the distributions of instantaneous vorticity at x/D = 5.5, 6, 6.5 (α = 50°, θ = 90°, and γ = 10°). The sectional side force reached the positive maximal at point E (x/D = 6) (figure 5). The high-position vortex broke away, and a new vortex was generated. These findings were similar to those at x/D = 3.3 in the asymmetric triple-vortex region. Figure 12(b) shows that the high left vortex (VL1) began to break away at the E point (x/D = 6), and the generation of a new vortex (VL2) was initiated. These observations indicated the formation of the inception region of the asymmetric four vortices. The asymmetric four-vortex system included four vortices, i.e., VL1, VR1, VR2, and VL2. Figure 12(a) presents that the profile of the curves of Cy–x/D in this inception region (E–F) was similar to that in the fully developed triple-vortex region (D–E).

Figure 12. Asymmetric four vortices region around station E (α = 50°, θ = 90°, and γ = 10°). (a) Variations of Cp with the sectional angle θs; (b) distributions of instantaneous vorticity.
Download figure:
Standard image High-resolution imageThe evolution of flow structures in the four-vortex region was similar to that in the triple-vortex region. Figure 13 presents the variations of the pressure coefficient Cp with the sectional angle θs and the distributions of instantaneous vorticity at x/D = 7, 7.5, 7.8 (α = 50°, θ = 90°, and γ = 10°). With the development of the left vortex VL2 from the E point (x/D = 6) to the downstream, the negative pressure on the left side of the model increased, but the negative pressure on the right side decreased. These effects resulted in the variation of the sectional side force from a positive value down to zero at the F point (x/D = 7) (figure 5). Furthermore, the pressure distribution of the zero sectional side force at station F point (x/D = 7) in the four-vortex region exhibited symmetric distribution similar to that at station D point (x/D = 4.5) in the triple-vortex region.

Figure 13. Asymmetric four vortices region around station F (α = 50°, θ = 90°, and γ = 10°). (a) Variations of Cp with the sectional angle θs; (b) distributions of instantaneous vorticity.
Download figure:
Standard image High-resolution imageFigure 14 displays the variations of the pressure coefficient Cp with the sectional angle θs and distributions of instantaneous vorticity at x/D = 8, 8.5, 9 (α = 50°, θ = 90°, and γ = 10°). A new right vortex (VR3) was generated at G point (x/D = 8.5), wherein the sectional side force of the fully developed four-vortex system reached the negative maximum, and the inception region of the asymmetric five vortices was formed.
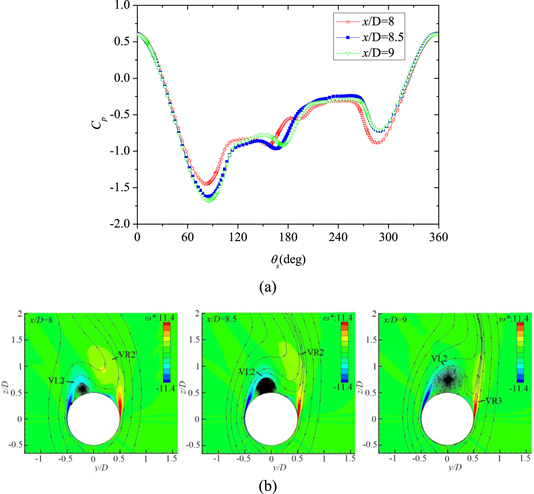
Figure 14. Asymmetric four vortices region around station G (α = 50°, θ = 90°, and γ = 10°). (a) Variations of Cp with the sectional angle θs; (b) distributions of instantaneous vorticity.
Download figure:
Standard image High-resolution imageFigure 15 reveals the variations of the pressure coefficient Cp with the sectional angle θs and the distributions of instantaneous vorticity at x/D = 9.5, 10, 10.5 (α = 50°, θ = 90°, and γ = 10°). The sectional side force of the asymmetric five-vortex system reached zero at the H point (x/D = 10) in region (G–I) with VR3 development. Six or more asymmetric vortices were possibly generated with the development of the vortex system downstream after the five-vortex region (G–I). This phenomenon will occur at a low (up to 0) magnitude of sectional side force.

Figure 15. Asymmetric five vortices region in (G–I) (α = 50°, θ = 90°, and γ = 10°). (a) Variations of Cp with the sectional angle θs; (b) distributions of instantaneous vorticity.
Download figure:
Standard image High-resolution image
4. Conclusions
The asymmetric flow over a blunt-nose slender body at a high AoA α = 50° was extensively investigated through wind tunnel tests and numerical simulations at a ReD = 1.54 × 10⁵. The microperturbation was induced by a hemispherical protrusion (r = 0.012D), which was attached onto the nose surface at the meridian angle γ = 10°. The characteristics of square-wave situation for the side force were observed when the circumferential angle (θ) of perturbation location was increased from 0° to 360°. This result implied that only two values of the side forces, either positive or negative, existed. The switch between negative or positive values was triggered by the circumferential angle of the perturbation location on the model nose. Moreover, the side force was relatively stable for a wide range of circumferential angles, i.e., θ = 0° to θ = 180° and θ = 180° to θ = 270°. The evolution of sectional side force, which was connected to the pattern of the asymmetric vortices over the blunt-nose slender body, was instituted along the body axis (x/D). The evolution pattern of the asymmetric multi-vortex flow along the body axis in the regular state was observed at the asymmetric twin-vortex inception region and its fully developed region, the asymmetric triple-vortex region, the four-vortex region, the five-vortex region, and the multi-vortex region in sequence. The physical model of asymmetric multi-vortex flow structure was developed based on the body-axis flow analysis.
Acknowledgments
The study is co-supported by the National Natural Science Foundation of China (11472028), Foundation of State Key Laboratory of Aerodynamics (SKLA20160101), China Aerospace Science and Technology Corporation Innovation Fund, Aeronautical Science Foundation of China (2016ZA51) and Pre-research Fund 2015.