
Abstract
Stem cell therapy, achieved using mesenchymal stem cells (MSCs), has been highlighted for the treatment of liver fibrosis. Infusion into the circulatory system is a traditional application of MSCs; however, this approach is limited by phenotypic drift, stem cell senescence, and vascular embolism. Maintaining the therapeutic phenotype of MSCs while avoiding adverse infusion-related reactions is the key to developing next-generation stem cell therapy technologies. Here, we propose a bioreactor-based MSCs therapy to avoid cell infusion. In this scheme, 5% liver fibrosis serum was used to induce the therapeutic phenotype of MSCs, and a fluid bioreactor carrying a co-culture system of hepatocytes and MSCs was constructed to produce the therapeutic medium. In a rat model of liver fibrosis, the therapeutic medium derived from the bioreactor significantly alleviated liver fibrosis. Therapeutic mechanisms include immune regulation, inhibition of hepatic stellate cell activation, establishment of hepatocyte homeostasis, and recovery of liver stem cell subsets. Overall, the bioreactor-based stem cell therapy (scheme) described here represents a promising new strategy for the treatment of liver fibrosis and will be beneficial for the development of 'cell-free' stem cell therapy.
Export citation and abstract BibTeX RIS

Original content from this work may be used under the terms of the Creative Commons Attribution 4.0 license. Any further distribution of this work must maintain attribution to the author(s) and the title of the work, journal citation and DOI.
List of abbreviations
| MSCs | mesenchymal stem cells |
| UCMSCs | umbilical cord-derived mesenchymal stem cells |
| SASP | senescence-associated secret phenotype |
| BSCT | bioreactor-based stem cell therapy |
| PLA | polylactic acid |
| FDM | fused deposition modeling |
| SEM | scanning electron microscopy |
| α-SMA | alpha smooth muscle actin |
| ASL | argininosuccinate lyase |
| F2 | coagulation factor II |
| NAGS | N-acetylglutamate synthase |
| OTC | ornithine transcarbamylase |
| CPS1 | carbamoyl phosphate synthase 1 |
| NK | natural killer cells |
| MMPs | matrix metalloproteinases |
| TIMPs | tissue inhibitors of matrix metalloproteinases |
| HSCs | hepatic stellate cells |
| GGT | gamma-glutamyl transferase |
1. Introduction
Fibrosis is an adaptive response of the liver to chronic injuries such as hepatitis B or C infection, nonalcoholic fatty liver disease, high alcohol consumption, and autoimmune diseases. The pathological process can be divided into four stages: hepatocyte damage, immune dysfunction, myofibroblast activation, and destruction of the regenerative microenvironment. After nearly 40 years of continuous exploration, liver fibrosis is considered reversible; however, there is still a lack of effective treatments [1–3]. Stem cell therapy, particularly MSC therapy, has inspired hope for the treatment of liver fibrosis.
MSCs are adult stem cells obtained from umbilical cord, bone marrow, fat, amniotic membranes, dental pulp, and other tissues. Over the past decade, allogeneic or autologous MSC infusion has been viewed as a promising treatment for liver fibrosis [4]. Clinical trials have suggested that MSC infusion improves liver function and clinical symptoms in patients with HBV, HCV, and alcoholic cirrhosis [5–8]. The main therapeutic mechanism of MSCs is to produce soluble factors such as TGF-β, PGE2, IDO, NO, and HGF through a paracrine effect to alleviate liver inflammation and promote tissue regeneration [9]. However, the large-scale clinical application of MSCs is limited by immune rejection, abnormal cell phenotypes, and vascular obstruction associated with cell infusion [10]. Because the therapeutic effect of MSCs mostly depends on paracrine signaling, the development of safer, cheaper, and more effective 'cell-free' treatments based on the MSCs secretome has become a new path for the development of stem cell therapy [11].
Obtaining an effective MSC secretome is the key to developing 'cell-free' schemes. It is worth noting that MSCs exhibit phenotypic polarization in response to changes in the microenvironment. For example, high levels of inflammation induce the anti-inflammatory phenotype of MSCs (expressing IDO, PGE4, and NO), whereas low inflammation promotes the proinflammatory phenotype of MSCs (expressing CXCL9, CXCL10, and CXCL11) [12]. The wrong secretome not only fails to produce a therapeutic effect but also accelerates the pathological process. It is important to ensure the curative effect by inducing the effective secretome of MSCs in an appropriate culture environment. Wangler et al exposed MSCs to healthy, traumatic, and degenerative intervertebral disc microenvironments and found that the cells had different therapeutic effects in response to different microenvironments [13]. Chen et al showed that MSCs treated with serum from patients with nerve injury provide a conditioned medium that produced significant anti-inflammatory effects and nerve regeneration [14]. Therefore, inducing a special phenotype in MSCs through disease microenvironmental cues is an effective method for obtaining a therapeutic secretome.
In this study, we developed a treatment scheme for liver fibrosis based on the liver fibrosis microenvironment and a bioreactor system using the MSC secretome as the core. Liver fibrosis serum (5%) was used to induce the therapeutic phenotype of MSCs while avoiding senescence. A fluid bioreactor system, including a co-culture system of hepatocytes and MSCs, was used to enhance the therapeutic effect and prepare a therapeutic medium. Treatment in a rat liver fibrosis model suggested that the therapeutic medium derived from 5% liver fibrosis serum had a significant therapeutic effect. The therapeutic mechanisms include immune regulation, inhibition of HSC activation, establishment of hepatocyte homeostasis, and recovery of liver stem cell subsets. In conclusion, BSCT is a new 'cell-free' stem cell therapy targeting liver fibrosis, which has translational potential in the clinical treatment of liver fibrosis.
2. Materials and methods
2.1. Cell culture
Human UCMSCs were collected after obtaining written informed consent from women with uncomplicated pregnancies who underwent elective cesarean section at term in the obstetrics department of the first hospital of Lanzhou University. This study was performed in accordance with the declaration of Helsinki. All procedures were approved by the ethics committee. Fresh umbilical cords were soaked in sterile phosphate-buffered saline (PBS) (Biological Industries, Israel) and transferred to sterile operation tables. The arteries and veins in the tissue were removed and sheared into 1 × 1 mm tissue particles. Tissue particles were evenly spread on the bottom of a T75 cell culture bottle (Corning) and 15 ml Dulbecco's modified Eagle's medium/Ham's F12 nutrient medium (DMEM/F12) (GIBCO, USA) containing 10% fetal bovine serum (FBS) (GIBCO, USA) was added. When large numbers were at the bottom of the culture bottle, they were detached using 10% trypsin-digested medium (Biological Industries) and transferred to a new culture bottle. The culture medium was replaced with a serum-free medium (Biological Industries, Israel). UCMSCs were identified using cell surface markers (figure S1).
Rat hepatocytes BRL-3A were obtained from Procell Life & Technology (China) and cultured in DMEM supplemented with 10% FBS and 1% penicillin and streptomycin (GIBCO, USA). Cells were maintained at 37 °C and 5% CO2 in a humidified incubator.
2.2. Cell senescence
The MSC-serum-free medium (Biological Industries, Israel) was the basic medium used to evaluate UCMSC senescence. Rat liver fibrosis serum was mixed with MSC-specific serum-free medium (v:v) as intervention solution. A Senescence β-Galactosidase Staining Kit (Beyotime Biotechnology, China) was used to evaluate cell senescence, and the stained cells were senescence-positive cells. The operation was conducted in accordance with the manufacturer's instructions, including washing with PBS once, fixing at 25 °C for 15 min, and incubating with the dye solution at 37 °C overnight. Images were acquired using a microscope (CKX53; Olympus, Tokyo, Japan).
2.3. Co-culture of UCMSCs and rat hepatocytes (BRL-3 A cell lines) in 6-well plates
UCMSCs (4 × 10⁵ cells well−1) were inoculated into 6-well plates with 2.5 ml of culture medium. Hepatocytes (6 × 10⁵ cells well−1 or 1 × 10⁵ cells well−1) were inoculated into 6-well transwell inserts (Corning Life Sciences, USA) containing 1.5 ml of culture medium. Liver fibrosis serum and MSC-specialized serum-free culture medium (Biological Industries, Israel) (5:95, v/v) were used in the co-culture system. After 12 h of cultivation, the conditioned medium was obtained after filtration with a 0.2 μm filter.
2.4. Co-culture of UCMSCs and rat hepatocytes on PLA discs
PLA discs (24 mm in diameter and 1 mm in thickness) suitable for a 6-well plate were manufactured. Gradient-density MSCs (0, 2 × 10⁴, 6 × 10⁴, 1 × 10⁵ cells well−1) and hepatocyte BRL-3A (3 × 10⁵ cells well−1) were implanted on the surface of the PLA discs. Culture medium (3 ml) was added to each well.
2.5. SEM
SEM was performed according to a general procedure. Briefly, samples fixed in electron microscope fixative buffer (Servicebio, China) were dehydrated with an ascending ethanol series (30%–100%), subjected to critical point drying (Quorum K850), and sputtered with a platinum–palladium Denton Vacuum (HITACHI MC1000). Field-emission SEM (HITACHI Regulus 8100; EHT = 15.00 kV, WD = 4 mm, detector in lens) was used for observation.
2.6. Assessment of hepatocyte function: ammonia clearance, urea generation, and albumin secretion
NH4Cl powder (Sangon Biotech, China) was dissolved in DMEM/F12 basal medium to a concentration of 3 mmol l−1 and filtered through a 0.2 μm filter. The culture medium was collected at 6, 12, and 24 h after the addition of the NH4Cl medium to determine the remaining concentration. An ammonia assay kit (Nanjing Jiancheng Bioengineering Institute) was used for ammonia determination following the manufacturer's instructions. DMEM/F12 basic culture medium was used for the cell culture for the urea production and albumin secretion assays. We added 3 ml of the medium to a 6-well plate (Corning, Corning, NY, USA) and 40 ml of the medium to the bioreactor. After 12 h of culture, urea and albumin concentrations in the culture medium were measured. Urea and albumin assay kits (Nanjing Jiancheng Bioengineering Institute, Nanjing, China) were used for urea and albumin determination, respectively, according to the manufacturer's instructions.
2.7. qPCR
Total RNA was extracted from cultured cells using TRIzol reagent (TAKARA, Japan). One microgram of total RNA was reverse-transcribed using a RevertAid First Strand cDNA Synthesis Kit (Thermo Fisher Scientific, USA). Real-time qPCR was conducted in a 20 µl final volume using 1 ng µl−1 cDNA and forward and reverse primers (500 nM each) with TB Green Premix Ex Taq II (TAKARA, Japan) in a CFX Connect PCR System (Bio-Rad, USA). The primer sequences are shown in table S1.
2.8. Rat liver fibrosis model construction and serum collection
Male Sprague-Dawley rats weighing approximately 130 ± 10 g were purchased from Charles River Laboratories (Beijing, China), carefully maintained under standard laboratory conditions, acclimated for 7 d before the experiments, and allowed free access to food and water. Hepatic fibrosis was induced in rats with CCl4 (1 ml kg−1, CCl4: olive oil = 1:1 v/v) via intraperitoneal injection twice per week for 8 weeks. At the end of the modeling, the rats were quickly anesthetized and blood samples were collected by abdominal aortic puncture and centrifuged for 10 min at 1000 × g to acquire serum. Before preparing the induction medium, all liver fibrosis serum was mixed and stored at −80 °C.
2.9. Construction of fluid bioreactor with three-dimensional-printing FDM
A commercial 3D printer (Ultimaker S5, Utrecht, Netherlands) was used for the FDM. Specifically, commercial PLA filaments with a diameter of 2.85 ± 0.10 mm (Ultimaker, Utrecht, Netherlands) were used in this study. The glass transition temperature of the PLA filaments was 60 °C, and the melting temperature was approximately 145 °C–160 °C. The detailed mechanical and thermal properties of the commercial PLA are listed in tables S2 and S3. The digital bioreactor model used for 3D printing was constructed using the Autodesk Inventor 3D CAD software (Autodesk, San Rafael, CA, USA). The models were exported into the.stl format, imported into slicing software CURA (Ultimaker, Utrecht, Netherlands), and configured for the FDM printer with a 0.4 mm brass nozzle, a layer height of 0.1 mm, and an infill of 70%. The hot-end temperature was set to 210 °C, and the printing bed temperature was set to 60 °C. The printing speed was 60 mm s−1, which enabled retraction and print cooling. Support structures were not required for the printing process. After FDM, the printed bioreactor was carefully cleared for cell culture.
The bioreactor sizes are shown in figure 5. The internal space of the bioreactor included an upper storage tank, a lower storage tank, and a vertical liquid flow channel. The total storage volume was 43.5 ml. The upper and lower storage tanks were undivided spaces, with a storage volume of 21.3 ml per tank. The liquid flow channel in the vertical section was divided into 12 channels of equal width by partitions, each with a length of 5.4 cm, a width of 0.5 cm and a cross-sectional area of 0.15 cm2. The cells adhered to one side of the fluid flow channel with a total adhesion area of 32.4 cm2. During the operation of the bioreactor, the culture medium was first injected into the lower storage tank and then into the upper storage tank through 12 regular liquid flow channels in the vertical section. The peristaltic pump provided power and silicone tubing provided a pathway for the circulation of the culture medium.
2.10. Co-cultures UCMSCs and rat hepatocytes in bioreactor and preparation of therapeutic medium
Satisfactory disinfection was achieved via UV irradiation and circulation of a 75% ethanol solution for 1 h. The sterilized bioreactor system was rinsed five times with sterile PBS (Biological Industries, Israel). During cell implantation, a vertical section of the bioreactor was laid flat to ensure cell sedimentation and adhesion to the sides of the flow channel. MSCs and hepatocytes were implanted into the bioreactor at cell densities of 0.15 × 105 cm−2 and 0.75 × 105 cm−2, respectively, with a culture medium volume of 10 ml. The bioreactor was then left at 37 °C and 5% CO2 in a humidified incubator for 12 h. After cell adhesion, the culture medium was discarded and the bioreactor was rinsed three times with sterile PBS at a low flow rate (5 ml min−1) for 30 s each. After emptying, 40 ml of diluted serum was injected into the bioreactor, and a specific fluid shear force was set based on the shear force calculation formula. The diluted serum was comprised of MSC-specialized serum-free culture medium (Biological Industries, Israel) mixed with rat serum (v/v). The shear rate at the cell adhesion surface was calculated with the equation σ = 6 μQ/(WH2), where Q is the flow rate, μ is the viscosity coefficient of the diluted serum (μ = 0.86 × 10⁻² dynes·s cm−2), W is the channel width, and H is the channel height. After 12 h of cyclic cultivation, the culture medium was obtained, and the therapeutic medium was obtained after filtration with a 0.2 μm filter. Throughout the process, the bioreactor was left at 37 °C and 5% CO2 in a humidified incubator.
To freeze-dry the medium, they were removed from −80 °C storage and loaded into a vacuum freeze-dryer (Shanghai Jingxin Industrial Development, China). Samples were lyophilized in batches for 20 h following the manufacturer's protocol. Lyophilized samples were stored in a refrigerator at 4 °C and sealed with parafilm to protect them from moisture absorption. Immediately before use, aliquots were rehydrated to 20% of their original volume with sterile distilled water (Invitrogen, USA) and then briefly vortexed.
2.11. Preparing metabolomics samples
We mixed 500 μl of extraction solution containing internal standard (methanol acetonitrile in a volume ratio of 1:1, internal standard concentration of 20 mg l−1) with 100 μl of liquid sample, then vortexed the mixture and sonicated it in an ice-water mixture for 10 min. The samples were incubated at −20 °C for 1 h and centrifuged at 12 000 × g for 15 min at 4 °C. Then, 500 μl of the supernatant was dried in a vacuum concentrator, and 160 μl of the extraction solution (acetonitrile:water in a volume ratio of 1:1) was added to the dried metabolites for redissolution. After vortexing for 30 s, the samples were sonicated in an ice water bath for 10 min. The solution was centrifuged at 10 000 × g and 4 °C for 15 min, which was then prepared for machine testing.
2.12. Untargeted metabolomics
The LC-MS system used for metabolomic analysis consisted of a Xevo G2-XS QTOF high-resolution mass spectrometer (Waters, USA). The column used was a UPLC HSS T3 column (1.8 µm; 2.1 × 100 mm; Waters Acquity). In the positive ion mode, mobile phase A was a 0.1% formic acid aqueous solution, and mobile phase B was 0.1% formic acid in acetonitrile. In the negative ion mode, mobile phase A was a 0.1% formic acid aqueous solution, and the mobile phase was 0.1% formic acid/acetonitrile. In each data acquisition cycle, dual-channel data acquisition was simultaneously performed at both low and high collision energies. The low collision energy was 2 V, the high collision energy range was 10 ∼ 40 V, and the scanning frequency was 0.2 s for a mass spectrum. The parameters of the ESI ion source were as follows: capillary voltage: 2000 V (positive ion mode) or −1500 V (negative ion mode); cone voltage: 30 V; ion source temperature: 150 °C; desolvent gas temperature: 500 °C; backflush gas flow rate: 50 l h−1; desolvent gas flow rate: 800 l h−1. The raw data collected using MassLynx V4.2 were processed using Progenesis QI software for peak extraction, peak alignment, and other data processing operations based on the Progenesis QI software online METLIN database and Biomark's self-built library for identification. Theoretical fragment identification and mass deviation were within 100 ppm.
2.13. Proteomics
Proteins in the therapeutic medium were digested using sequencing-grade trypsin. Label-free mass spectrometry was performed using an Orbitrap Fusion mass spectrometer (Thermo Fisher Scientific, USA). The scan events were set as a full MS scan of m/z 250–1450 at a mass resolution of 120 000, followed by a CID MS/MS scan repeated for the 20 most intense ions selected from the previous full MS scan, with an isolation window. The normalized collision energy was set to 30% and the activation time was 50 ms. The second-stage linear ion trap fast mode was used for data acquisition with a 7000 automatic gain control, a maximum injection time of 35 ms, and a dynamic exclusion time of 18 s. The UniProt _HUMAN (2019.4.20 Download) database was used. The resulting MS/MS data were processed using MaxQuant version 1.5.2.8. Protein identification was set as follows: precursor ion mass tolerance: ±15 ppm; fragment ion mass tolerance: ±0.5 Da; max missed cleavages: 2; static modification: carboxyamidomethylation (57.021 Da) of Cys residues; dynamic modification: oxidation modification (+15.995 Da) of Met residues.
2.14. Treatment of rat liver fibrosis
The liver fibrosis modeling was obtained as described in section 2.8. After establishment of the model, the concentrated treatment medium (1 ml kg−1) was injected twice a week through the abdominal cavity or tail vein. The control group was injected with PBS using the same method. The health of rats was monitored regularly. All the animals received humane care in accordance with the criteria outlined in the 'Guide for the Care and Use of Laboratory Animals.' All procedures were approved by the ethics committee.
2.15. Tissue examination
At the end of the treatment period, the livers were fixed in 4% paraformaldehyde (Solarbio, China) and embedded in paraffin for hematoxylin and eosin (HE), Sirius Red, Masson, immunohistochemical, and immunofluorescence staining. Antibodies against CD68 (28058-1-AP, Proteintech, USA), MPO (22225-1-AP, Proteintech, USA), CD3 (ab16669, abcam, USA), NK-P44 (GB11616, Servicebio, China), S100β (15146-1-AP, Proteintech, USA), α-SMA (GB111364, Servicebio, China), desmin (16520-1-AP, Proteintech, USA), γh2Ax (GB111841, Servicebio, China), Ki-67 (27309-1-AP, Proteintech, USA), CK-19 (ab52625, abcam, USA), and GGT (GB113421, Solarbio, China), as well as the HE stain kit (Solarbio, China), TUNEL apoptosis assay kit (Beyotime, China), and Masson's trichrome stain kit (Solarbio, China) were used according to the manufacturers' instructions. Sections were observed under a microscope (CKX53; Olympus, Tokyo, Japan). The positive cell count was based on five random fields of view and performed by two experienced pathologists. The positive area measurement was based on five random fields of view, and area recognition was performed using the ImageJ software.
2.16. Statistical analysis
Data were analyzed using SPSS Statistics 25.0 (IBM, USA) and Prism 6.0 software (GraphPad Software, USA). Data are presented as mean ± SD. The unpaired Student's t-test or Mann–Whitney U test was used to compare the means of the two groups. Specific statistical methods were selected based on the purpose of the study and the normality and homogeneity of the sample variance. Statistical significance was set at p < 0.05.
Omics analysis was performed using R version 3.6.1. Principal component analysis (PCA) was based on prcomp (R base function) 3.6.1, OPLS-DA was conducted based on ropls 1.6.2, and enrichment analysis was performed using clusterProfiler 4.4.4 and enrichplot 1.2.0. The t-test was used to calculate the differences in the significant p-values of each compound. Data with p < 0.05 and difference ratio >1 were selected for further analysis (VIP > 1 included in the metabolomic analysis).
3. Results
3.1. Liver fibrosis serum (FS, 5%) induced phenotypic changes in UCMSCs without inducing cell senescence
Stem cell senescence induced by toxic microenvironments exacerbates inflammation through the SASP, which leads to deterioration of the pathological status of tissues [15]. To induce the potential therapeutic phenotype of UCMSCs while avoiding the adverse effects of cell senescence, the cells were treated with different concentrations of FS. The β-galactosidase staining results showed that UCMSCs were stable in normal medium, and 5% FS did not significantly induce senescence in UCMSCs within 12 h. At a serum concentration of 10%–100%, senescence and apoptosis of UCMSCs were widespread, and this effect occurred quickly (<12 h) (figure S2). Therefore, using 5% FS to intervene in UCMSCs was effective for inducing a therapeutic phenotype and avoiding cell senescence.
Next, we evaluated the response of UCMSCs to 5% FS (figure 1(b)). Transcriptome analysis showed that 5% FS induced the upregulation of 142 genes and downregulation of 249 genes in UCMSCs (figure 1(b)). The analysis of gene expression differences was based on p < 0.05 and fold change (FC) > 2.0. KEGG enrichment analysis showed that the upregulated genes were mainly enriched in NF-kappa B signaling pathway, cytokine-cytokine receptor interaction, TNF signaling pathway, and neuroactive ligand-receptor interaction (figure 1(c)). In addition, the downregulated genes were mainly enriched in TGF-β signaling pathway, cell adhesion molecule, hippo signaling pathway, and calcium signaling pathway (figure 1(d)).
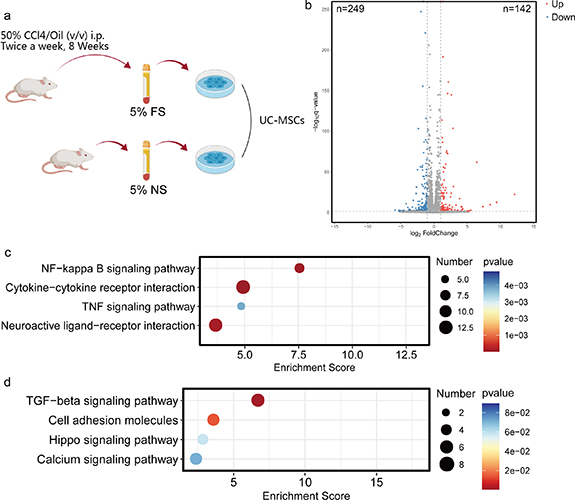
Figure 1. Transcriptome changes of MSCs in response to liver fibrosis serum. (a) The modeling method of rat liver fibrosis model and liver fibrosis serum intervention; the intervention medium included serum (NS, normal serum; FS, liver fibrosis serum) and MSC-specialized serum-free culture medium (5:95, v/v). (b) The volcano plot of differentially expressed genes between 5% NS group and 5% FS group; the cut-off value was P < 0.05, FC > 2.0. (c) Annotation of high expression genes in 5% FS group compared with 5% NS group based on KEGG pathway database; the cut-off value was P < 0.05, FC > 2.0. (d) Annotation of low expression genes in 5% FS compared with 5% NS group based on KEGG pathway database; the cut-off value was P < 0.05, FC > 2.0. *P < 0.05; **P < 0.01; ***P < 0.001.
Download figure:
Standard image High-resolution image3.2. Conditioned medium of UCMSCs induced by 5% FS did not alleviate liver fibrosis
Based on the special response of UCMSCs to FS, we investigated whether this response mode had a therapeutic effect on liver fibrosis. Five-fold concentrated UCMSC-conditioned medium derived from 5% FS and 5% normal serum (5% NS) was injected into the body via the abdominal cavity or tail vein (figure 2(a)). Tissue evaluation showed that the four groups did not exhibit any significant therapeutic effects (figures 2(b)–(d)). Notably, the group of intraperitoneal injection of UCMSC-conditioned medium induced by 5% FS showed a trend of improvement in fibrosis degree. Considering the toxic effects of FS, the introduction of cells with metabolic and paracrine activities may have beneficial effects.
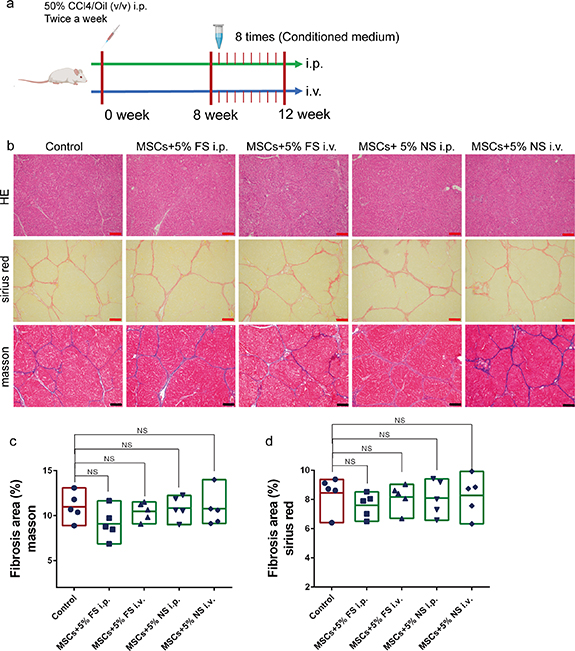
Figure 2. The conditioned medium of MSCs induced by 5% liver fibrosis serum did not have therapeutic effect. (a) The modeling method and treatment process of rat liver fibrosis model. (b) HE, Sirius red and Masson staining images of liver after intraperitoneal injection (i.p.) or tail vein injection (i.v.) of different medium; MSCs + 5% FS, the conditioned medium of MSCs induced by 5% liver fibrosis serum; MSCs + 5% NS, the conditioned medium of MSCs induced by 5% normal serum; control, PBS; scale bar, 200 µm. (c) Quantitative analysis of fibrosis area in Masson staining images of different medium group; ImageJ for area measurement; n = 5. (d) Quantitative analysis of fibrosis area in Sirius red staining images of different medium group; ImageJ for area measurement; n = 5. Data were analyzed using ANOVA. *P < 0.05; **P < 0.01; ***P < 0.001.
Download figure:
Standard image High-resolution image3.3. Conditioned medium derived from the co-culture system of hepatocytes and UCMSCs had therapeutic effects on liver fibrosis
To induce metabolic and paracrine activities, we introduced rat hepatocytes (BRL-3A cells) into the induction system (figure 3(a)). The conditioned medium derived from the co-culture system and 5% FS were used for the treatment of liver fibrosis in rats. Tissue evaluation showed that the intraperitoneal injection of conditioned medium derived from the co-culture system containing high-density (6 × 10⁵ cells well−1) hepatocytes had a significant therapeutic effect (figures 3(b)–(d)). However, conditioned medium derived from a co-culture system containing low-density (1 × 10⁵ cells well−1) hepatocytes and isolated high-density hepatocytes did not produce significant therapeutic effects. In addition, we found that a change in the injection mode of the conditioned medium led to a loss of the therapeutic effect. These results suggest that co-culture with hepatocytes plays a key role in the therapeutic effect of UCMSCs in response to 5% FS, and that the specific mode of administration is critical. Therefore, the further enhancement of hepatocyte activity is a key step in improving the therapeutic ability of co-culture systems.

Figure 3. The conditioned medium induced by 5% liver fibrosis serum in the co-culture system of MSCs and hepatocytes alleviated liver fibrosis in rats. (a) Different group of hepatocytes and MSCs coculture system; the medium of upper and lower chambers was 5% liver fibrosis serum; MSCs + high HEP, coculture system of MSCs and high-density hepatocytes (6 × 10⁵ cells well−1); MSCs + low HEP, coculture system of MSCs and low-density hepatocytes (1 × 10⁵ cells well−1); high HEP, high-density hepatocytes (6 × 10⁵ cells well−1). (b) HE, Sirius red and Masson staining images of liver after intraperitoneal injection (i.p.) or tail vein injection (i.v.) of different medium; control, PBS; scale bar, 200 µm. (c) Quantitative analysis of fibrosis area in Masson staining images of different medium group; ImageJ for area measurement; n = 5. (d) Quantitative analysis of fibrosis area in Sirius red staining images of different medium group; ImageJ for area measurement; n = 5. The data represent the mean ± S.D. Data were analyzed using ANOVA. *P < 0.05; **P < 0.01; ***P < 0.001.
Download figure:
Standard image High-resolution image3.4. Construction of a fluid bioreactor to enhance the therapeutic ability of the co-culture system of hepatocytes and UCMSCs
To further enhance hepatocyte function in the co-culture system and increase the production of therapeutic medium, we introduced a bioreactor system based on bionics and FDM. At this stage, the evaluation of cell adhesion and function on the surface of printing materials, optimization of the hepatocyte-UCMSC co-culture ratio, and generation of appropriate fluid shear force were gradually implemented.
The determination of cell adhesion and toxicity was a preliminary step. The implantation and functional determination of hepatocytes reflect the adhesion and toxicity of the PLA plane constructed using FDM. SEM revealed that the hepatocytes adhered well to the PLA surface and formed a cell layer (figure 4(a)). Ammonia scavenging and urea production suggested that the functioning of hepatocytes grown on the PLA surface was stronger than that of hepatocytes grown on the surface of 6-well plates (figures 4(b) and (c)). Analysis of the mRNA expression of key enzymes during ureagenesis showed that the PLA surface enhanced the expression of several key enzymes in hepatocytes, including ASL, coagulation factor II (F2), NAGS, OTC, and CPS1 (figure 4(d)). The albumin concentration in the culture medium and albumin mRNA expression in hepatocytes showed that the PLA surface did not have a promoting effect compared to the surface of the 6-well plate (figure 4(e)).

Figure 4. Polylactic acid (PLA) plane derived from fused deposition modeling and coculture promoted cell adhesion and hepatocyte function. (a) Electron microscopic image of hepatocytes forming cell layer on PLA plane; blue arrow indicating cell layer; red arrow indicating PLA surface; scale bar, 30 µm. (b) Comparison of ammonia metabolism rate of hepatocytes on PLA surface and 6-well plate surface. (c) Comparison of urea formation rate of hepatocytes on PLA surface and 6-well plate surface. (d) Comparison of key enzymes mRNA expression of urea metabolism hepatocytes on PLA surface and 6-well plate surface. (e) Comparison of albumin mRNA expression and protein secretion in hepatocytes on PLA surface and 6-well plate surface. (f) Schematic diagram of gradient proportion MSCs co-cultured with hepatocytes. (g) Ammonia clearance rate of gradient UCMSCs cocultured with hepatocytes. (h) Urea production rate of UCMSCs co-cultured with hepatocytes. (i) Albumin production rate of UCMSCs co-cultured with hepatocytes. (j) The adhesion state of 30% UCMSCs cocultured group and hepatocytes group under fluid shear stress; the fluid shear force was provided by the shaking table at 40 r min−1 for 2 h in cell incubator; scale bar, 30 µm. The data represent the mean ± S.D. of three independent experiments. Data were analyzed using independent unpaired two-tailed student's t-tests or ANOVA. *P < 0.05; **P < 0.01; ***P < 0.001.
Download figure:
Standard image High-resolution imageThe second step was to optimize the proportion of hepatocytes and UCMSCs in a co-culture system on the PLA surface. Hepatocytes were co-cultured with MSCs in gradient ratio (0, 15:1, 5:1 and 3:1) (figure 4(f)). A comprehensive analysis of ammonia clearance, urea production, and albumin secretion showed that hepatocytes mixed with UCMSCs at a ratio of 5:1 strongly promoted hepatocyte function (figures 4(g)–(i)). Next, a strong fluid shear force was applied to the cells that adhered to the PLA surface, with constant-speed shaking (40 rpm). SEM showed that the adhesion performance of the co-culture system was stronger, and the detachment of adherent cells in the fluid environment was avoided (figure 4(j)).
The third step involves the generation of an appropriate fluid shear force. Fluid is an important component of the liver microenvironment and an appropriate fluid shear force provides a specific microphysiological environment for hepatocytes and UCMSCs. To establish a stable fluid microenvironment, a novel bioreactor with regular flow channels, storage tanks, and gas valves was designed and fabricated. In this bioreactor, the cell adhesion surface with regular flow channels was the most critical (figures 5(a)–(d)). Twelve regular flow channels were included on the cell adhesion surface with cross-sectional dimensions of 0.5 × 0.3 cm. Hepatocytes and UCMSCs were co-cultured on one side of the fluid flow channel at a ratio of 5:1, and the ascending culture medium provided an appropriate fluid shear force for the cells (figure 5(e)). The culture medium was introduced into the lower storage tank at a constant flow rate and then into the upper storage tank through a regular flow channel (figures 5(e) and (f)). Different flow rates were used to determine the optimal fluid shear force. A comprehensive analysis of ammonia clearance, urea production, and albumin secretion showed that 0.6 dynes cm−2 most strongly promoted hepatocyte function (figures 5(g)–(i)).
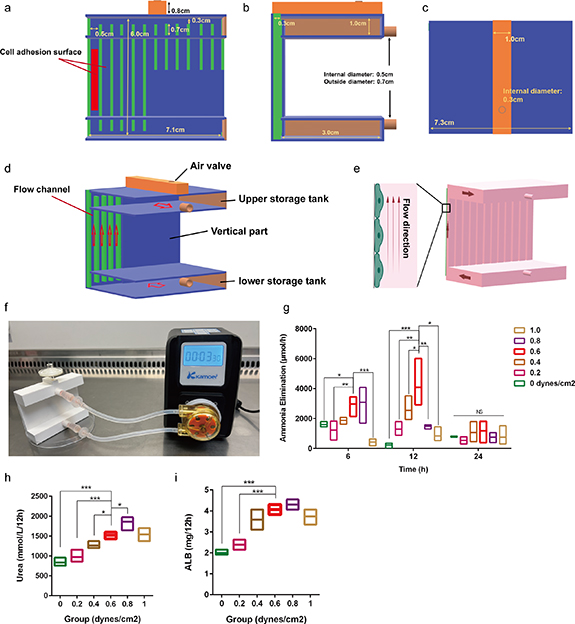
Figure 5. Suitable fluid shear force was provided for cells based on bioreactor. (a) Front parameters of reactor structure; the red box emphasizes the side of cell adhesion. (b) Side parameters of reactor structure. (c) Upper parameters of reactor structure. (d) Three dimensional model of reactor; the red arrow indicates the flow direction. (e) Liquid circulation status inside the bioreactor; the red entity represents the liquid in circulation; the red arrow indicates the flow direction. (f) The internal fluid circulation of the reactor driven by pump. (g) Ammonia clearance rate of reactor under gradient shear stress. (h) Urea formation rate in the reactor under gradient shear stress. (i) Albumin formation rate in the reactor under gradient shear stress. The data represent the mean ± S.D. of three independent experiments. Data were analyzed using ANOVA. *P < 0.05; **P < 0.01; ***P < 0.001.
Download figure:
Standard image High-resolution imageIn conclusion, bioreactors were designed and constructed to enhance the therapeutic effect of hepatocytes and UCMSCs co-culture system, including an appropriate co-culture ratio and fluid shear force. Next, 5% FS was introduced into the bioreactor to prepare the therapeutic medium.
3.5. Therapeutic medium derived from 5% FS and the bioreactor significantly alleviated liver fibrosis
5% FS was used as the circulating medium, with a circulation time of 12 h. Circulating 5% FS was concentrated five times by freeze-drying and redissolving the therapeutic medium. Therapeutic medium was intraperitoneally administered to treat liver fibrosis in rats (figure 6(a)). After four weeks of treatment, we analyzed the degree of liver fibrosis using Masson and Sirius Red staining and found that intraperitoneal injection of the therapeutic medium derived from 5% FS (5% FS-TM) significantly reduced collagen deposition (figures 6(b)–(d)). However, the direct use of 5% FS did not show a therapeutic effect. NS (5%) and its derived therapeutic medium (5% NS-TM) failed to alleviate liver fibrosis. These results suggest that intraperitoneal injection of 5% FS-TM is an effective method for alleviating liver fibrosis. Notably, this therapeutic effect did not rely on stem cell infusion but rather on changes in the secretion of stem cells in response to the FS environment in the bioreactor.
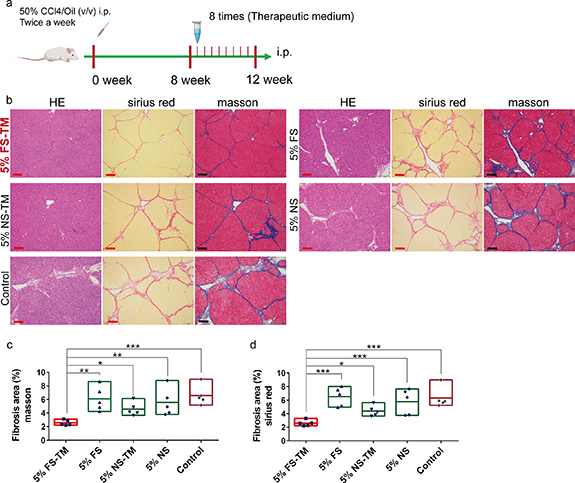
Figure 6. The therapeutic medium derived from 5% liver fibrosis serum and bioreactor promotes the regression of liver fibrosis. (a) The modeling method and treatment process of rat liver fibrosis model. (b) HE, Sirius red and Masson staining images of liver after intraperitoneal injection (i.p.) of different medium; 5% FS-TM, therapeutic medium derived from 5% liver fibrosis serum; 5% FS, 5% liver fibrosis serum; 5% NS-TM, therapeutic medium derived from 5% normal serum; 5% NS, 5% normal serum; control, PBS; scale bar, 100 µm. (c) Quantitative analysis of fibrosis area in Masson staining images of different medium group; ImageJ for area measurement; n = 5. (d). Quantitative analysis of fibrosis area in Sirius red staining images of different medium group; ImageJ for area measurement; n = 5. The data represent the mean ± S.D. Data were analyzed using ANOVA. *P < 0.05; **P < 0.01; ***P < 0.001.
Download figure:
Standard image High-resolution imageIn addition, we evaluated the therapeutic ability of these media via tail vein injection and the staining results showed that none of the media had a therapeutic effect (figure S3). These results emphasize the importance of using a therapeutic medium.
To further understand the response patterns and potential fibrosis regulatory mechanisms of the co-culture system in the bioreactor for FS, we used proteomics and metabolomics to identify differences in the medium before and after circulation.
3.6. Proteomics analysis suggested that immune regulation mediated the therapeutic effect
A total of 522 proteins were identified in the treatment medium. The PCA results showed that the four media clustered separately with significant differences between them (figure S4(a)). Reactome pathway annotation revealed that 63.4% of these proteins are associated with the immune system (figure 7(a)). The protein expression heatmap showed significant differences between the pre-reaction and reaction media, as well as between normal and fibrosis serum (figure 7(b)). The analysis of protein expression differences was based on p< 0.05 and FC > 1.5. The results showed a significant difference in 156 proteins between serum with fibrosis and normal serum, including 61 upregulated and 95 downregulated proteins (figure 7(c)). Reactome pathway annotation showed that 33.3% of the differentially expressed proteins were enriched in the immune system (figure 7(d)). After circulation, 5% NS-TM had 50 upregulated and 57 downregulated proteins, and 30.8% of the differentially expressed proteins were enriched in the immune pathway (figures 7(e) and (f)). 5% FS-TM had 49 upregulated and 23 downregulated proteins after circulation; 40.2% of the differentially expressed proteins were enriched in the immune pathway (figures 7(g) and (h)). KEGG analysis showed that normal serum mainly induced reactions related to the Salmonella infection pathway and microRNAs in the cancer pathway in the bioreactor, whereas FS mainly induced the biosynthesis of amino acids and carbon metabolism pathway-related reactions (figures S4(b) and (c)). Owing to the significant therapeutic effect of 5% FS-TM, we further analyzed the common protein expression differences compared to those of the other three treatment media. Fourteen differentially expressed proteins were identified, of which 10 were upregulated and four were downregulated (figure 7(i)). Among the set of common differentially expressed proteins, NUTF2, NCL, COTL1, RAB1B, PFN1, moesin, PGK1, GAPDH, PDIA4, tenascin C, complement C6, complement C8, and CFHR4 were associated with immune regulation [16–27]. Therefore, the significant changes in protein levels in 5% FS-TM were mainly concentrated in immune regulatory proteins compared with those of other media.
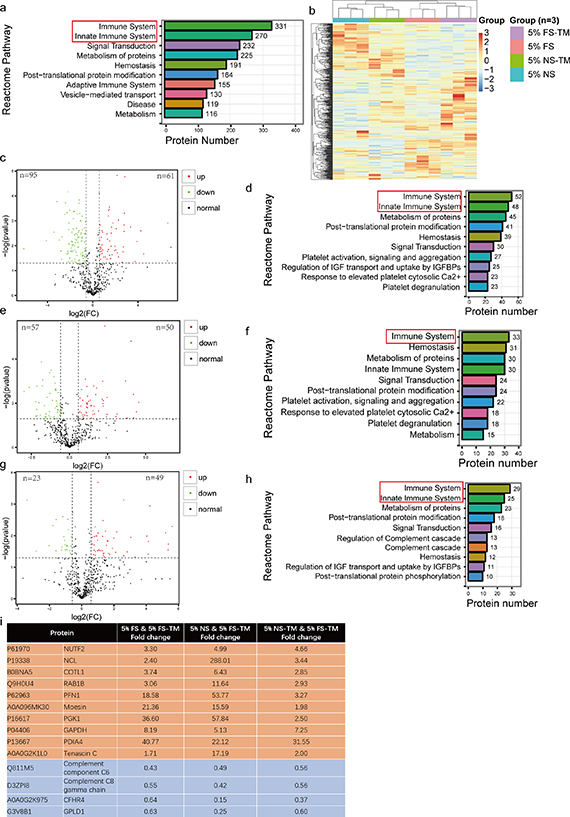
Figure 7. The reactor circulation significantly changed the protein composition of the pre-reaction medium. (a) The identified proteins were annotated through the Reactome pathway database. (b) Heatmap of protein expression in four groups of medium; 5% FS-TM, therapeutic medium derived from 5% liver fibrosis serum; 5% FS, 5% liver fibrosis serum; 5% NS-TM, therapeutic medium derived from 5% normal serum; 5% NS, 5% normal serum. (c) The volcano plot of differentially expressed proteins between 5% NS and 5% FS; the cut-off value was P < 0.05, FC > 1.5. (d) Annotation of differential proteins between normal serum and liver fibrosis serum based on Reactome pathway database; the cut-off value was P < 0.05, FC > 1.5. (e) The volcano plot of differentially expressed proteins between 5% NS and 5% NS-TM; the cut-off value was P < 0.05, FC > 1.5. (f) Annotation of differential proteins between 5% NS and 5% NS-TM based on Reactome pathway database; the cut-off value was P < 0.05, FC > 1.5. (g) The volcano plot of differentially expressed proteins between 5% FS and 5% FS-TM; the cut-off value was P < 0.05, FC > 1.5. (h) Annotation of differential proteins between 5% FS and 5% FS-TM based on Reactome pathway database; the cut-off value was P < 0.05, FC > 1.5. (i) Common differential proteins and fold changes between 5% FS-TM and the other three medium; yellow represents elevated proteins in 5% FS-TM; blue represents the reduced proteins in 5% FS-TM; the cut-off value was P < 0.05, FC > 1.5.
Download figure:
Standard image High-resolution image3.7. Untargeted metabolomic profiling suggested a correlation between the therapeutic effect and immune regulation
The analysis of metabolites in the medium was based on the LC-QTOF platform, with 4613 metabolites annotated (1846 annotated in negative ion mode, 2767 annotated in positive ion mode). The metabolite classification focused on lipids and lipid-like molecules, organic acids and derivatives, organic oxygen compounds, organoheterocyclic compounds, benzenoids, phenylpropanoids, and polyketides (figure S5(a)). The PCA results showed that the four media clustered separately with significant differences between them (figure S5(b)). The heatmap of metabolite expression shows a wide range of changes in the metabolites in the pre-reaction and reaction media (figure 8(a)). The following analysis of the differences in metabolite expression was based on p < 0.05 and FC > 1.5. Compared with normal serum, FS contained 1560 differential metabolites, including 1257 upregulated and 303 downregulated metabolites (figure S5(c)). The results of the KEGG enrichment analysis showed that primary bill acid metabolism was the most relevant pathway (figure 8(b)). Compared with 5% NS, 521 and 829 metabolites were upregulated and downregulated, respectively, in 5% NS-TM (figure S5(d)). KEGG enrichment analysis showed that glutathione metabolism was the most relevant pathway, consisting of six upregulated and six downregulated metabolites (figures 8(c) and (d)). A total of 552 metabolites were downregulated and 826 metabolites were upregulated in the 5% FS-TM group (figure S5(e)). KEGG enrichment analysis showed that glutathione metabolism was the most relevant pathway, consisting of six upregulated and four downregulated metabolites (figures 8(e) and (f)). The glutathione metabolic pathway is a common pattern, in which the bioreactor responds to both normal and fibrosis serum. Furthermore, common differential metabolites were identified between 5% FS-TM and the other three media, including 241 upregulated and 78 downregulated metabolites. Additionally, the results of KEGG enrichment analysis showed that arachidonic acid metabolism was the most relevant pathway for common differential metabolites (figures 8(g) and (h)). Arachidonic acid metabolic pathway is closely associated with immune regulation [28–30]. The unique enrichment of arachidonic acid-related metabolites in 5% FS-TM suggests an association between fibrotic regression mechanisms and immune regulation.
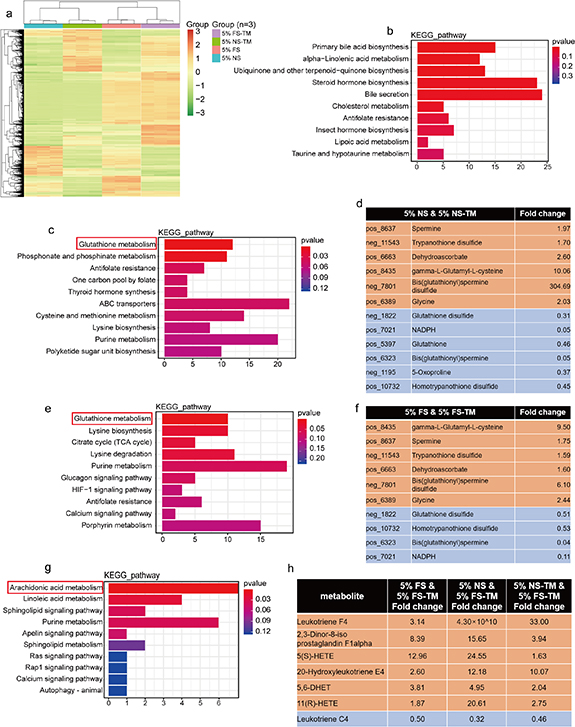
Figure 8. The circulation in bioreactor significantly changed the composition of metabolites in the pre-reaction medium. (a) Heatmap of metabolites expression in four groups of medium; 5% FS-TM, therapeutic medium derived from 5% liver fibrosis serum; 5% FS, 5% liver fibrosis serum; 5% NS-TM, therapeutic medium derived from 5% normal serum; 5% NS, 5% normal serum. (b) Enrichment analysis of differential metabolites between 5% NS and 5% FS using KEGG database; the cut-off value was P< 0.05, FC > 1.5. (c) Enrichment analysis of differential metabolites between 5% NS and 5% NS-TM using KEGG database; the cut-off value was P< 0.05, FC > 1.5. (d) The specific metabolites in the Glutamine metabolism pathway enriched from differential metabolites between 5% NS and 5% NS-TM; yellow represents elevated metabolites in 5% NS-TM; blue represents the reduced metabolites in 5% NS-TM. e. Enrichment analysis of differential metabolites between 5% FS and 5% FS-TM using KEGG database; the cut-off value was P< 0.05, FC > 1.5. (f) The specific metabolites in the Glutamine metabolism pathway enriched from differential metabolites between 5% FS and 5% FS-TM; yellow represents elevated metabolites in 5% FS-TM; blue represents the reduced metabolites in 5% FS-TM. g. Enrichment analysis of common differential metabolites between 5% FS-TM and the other three medium using through KEGG database; the cut-off value was P< 0.05, FC > 1.5. (h) The specific metabolites in the Arachidonic acid metabolism pathway enriched from differential metabolites between 5% FS-TM and the other three medium; yellow represents elevated metabolites in 5% FS-TM; blue represents the reduced metabolites in5% FS-TM; the cut-off value was P < 0.05, FC > 1.5.
Download figure:
Standard image High-resolution image3.8. Fibrotic liver inflammation subsided after treatment
Based on the results of proteomic and metabolomic analyses suggesting potential immune regulation by 5% FS-TM, we further analyzed the evolution of the immune state of the fibrotic liver induced by treatment. Macrophages, neutrophils, and natural killer (NK) cells are key immune subpopulations involved in liver fibrosis [31–34]. The immune state changes induced by the treatments were evaluated by determining the degree of infiltration of different immune cells (figure 9(a)). We found that the degree of infiltration of macrophages, neutrophils, and NK cells in the fibrotic liver was significantly increased and that 5% FS-TM significantly reversed this pathological process (figure 9(b)). The inflammatory status of the liver was evaluated based on mRNA expression levels of pro- and anti-inflammatory cytokines. 5% FS-TM reduced the expression levels of pro-inflammatory factors such as IL-6, TGF-β1, and TNF in the fibrotic liver but did not affect other cytokines (figure 9(c)).

Figure 9. The therapeutic medium derived from 5% liver fibrosis serum induced immune infiltration changes in the fibrotic liver. (a) Identification of infiltration levels of macrophages (CD68+), neutrophils (MPO+), and NK cells (NKP44+) in the normal group (health liver), control group (fibrotic liver with intraperitoneal injection of PBS), and treatment group (fibrotic liver with intraperitoneal injection of 5% FS-TM; 5% FS-TM, therapeutic medium derived from 5% liver fibrosis serum) through immunohistochemistry; scale bar, 100 µm. (b) Quantitative analysis of the infiltration degree of macrophages (CD68+), neutrophils (MPO+), and NK cells (NKP44+) in the three groups through cell counting; n = 5. (c) mRNA expression of key inflammatory factors in three groups; n = 5. (d) mRNA expression of six matrix metalloproteinases (MMPs) and three tissue inhibitor of matrix metalloproteinases (TIMPs) in three groups; n = 5. Data were analyzed using ANOVA. *P < 0.05; **P < 0.01; ***P < 0.001.
Download figure:
Standard image High-resolution imageMMPs are another direct tool used by immune cells to influence fibrosis [35]. MMPs promote the remodeling of fibrotic tissue and are regulated by TIMPs. We further evaluated the mRNA expression levels of MMPs and TIMPs in different treatment groups. Most MMPs and TIMPs in the fibrotic liver remained stable except for the high expression levels of MMP13 and TIMP1 (figure 9(d)), and 5% FS-TM did not alter MMP expression levels. Therefore, the regression of fibrosis induced by 5% FS-TM could be partly explained by the improvement in the inflammatory environment, but not by tissue remodeling mediated by MMPs.
3.9. Therapeutic medium induced immune regulatory effects before fibrosis relief
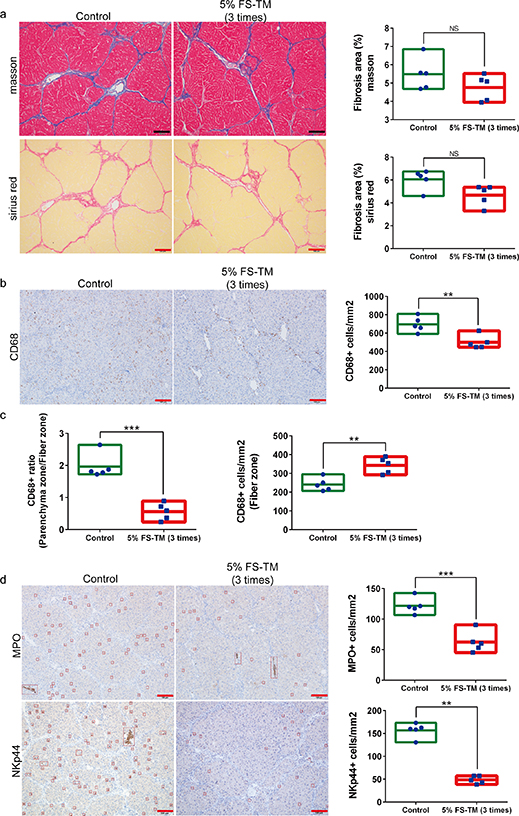
Immune infiltration and MMP secretion respond quickly to pathological changes; however, this response disappears after steady-state recovery. The results of our investigation after fibrosis relief did not detail the dynamic changes in the tissue remodeling process. Therefore, we further evaluated fibrotic liver status in the early treatment stages. Treatment with 5% FS-TM thrice did not significantly improve the degree of liver fibrosis (figure 10(a)). The results of the immune infiltration analysis showed changes in macrophage infiltration, including a decrease in the degree of infiltration and redistribution of the infiltrated areas (figures 10(b) and (c)). The main characteristic of macrophage redistribution was a decrease in infiltration in the parenchymal area, accompanied by an increase in infiltration in the fibrotic area (figure 10(c)). Neutrophils and NK cells showed decreased infiltration (figure 10(d)). In addition, the results of mRNA expression analysis showed a significant decrease in the expression of pro-inflammatory factors including IL-6, TGF-β1, and TNF, as well as a significant increase in the expression of anti-inflammatory factor IL-10 (figure S6(a)). Evaluation of MMPs and TIMPs showed a significant increase in MMP3 and MMP9 expression, and a decrease in TIMP1 and TIMP2 expression (figure S6(b)). These results suggest that 5% FS-TM induced immune redistribution, inflammation regression, and initiation of tissue remodeling processes; this evolution occurred during the initial treatment stages.
Figure 10. The therapeutic medium derived from 5% liver fibrosis serum induced inflammation regression and macrophage redistribution in the initial stage of treatment. (a) Comparison of the degree of liver fibrosis between the treatment group (intraperitoneal injection of 5% FS-TM; 5% FS-TM, therapeutic medium derived from 5% liver fibrosis serum) and the control group (intraperitoneal injection of PBS) in the initial stage of treatment; scale bar, 100 µm; n = 5; ImageJ is used for area calculation. (b) Comparison of macrophage infiltration in the liver between the treatment group and the control group at the initial stage of treatment; scale bar, 100 µm; n = 5. (c) Comparison of macrophage infiltration in fibrous and parenchymal regions between the treatment group and the control group in the early stage of treatment; n = 5. (d) Comparison of NK cell infiltration in the liver between the treatment group and the control group at the initial stage of treatment; scale bar, 100 µm; n = 5. Data were analyzed using independent unpaired two-tailed student's t-tests. *P < 0.05; **P < 0.01; ***P < 0.001.
Download figure:
Standard image High-resolution image
3.10. Other characteristics of liver fibrosis relief: inhibition of HSCs activation, restoration of liver cell homeostasis, and restoration of oval cell subpopulations
HSC activation in response to an inflammatory environment is a key event in the progression of liver fibrosis [36–39]. The proliferation and activation of HSCs before and after treatment were evaluated based on α-SMA and desmin staining [40]. α-SMA staining results showed an increase in the number of activated HSCs in the fibrotic liver, whereas the number of activated HSCs significantly decreased after treatment with 5% FS-TM (figures S7(a) and (b)). Desmin is a marker of all HSCs. Desmin staining indicated significant proliferation of HSCs in the fibrotic liver, and 5% FS-TM treatment significantly reduced the number of HSCs (figures S7(c) and (d)).
Hepatocyte damage including apoptosis, DNA damage, and proliferation was evaluated histologically. TUNEL staining results showed an increase in hepatocyte apoptosis in the fibrotic liver and a significant decrease in the number of apoptotic cells after treatment with 5% FS-TM (figures S8(a) and (d)). γH2Ax is a specific marker of cellular DNA damage. γH2Ax staining showed an increase in hepatocyte DNA damage in fibrotic livers, and 5% FS-TM treatment reduced the degree of DNA damage (figures S8(b) and (d)). Ki-67 staining revealed a fibrosis-induced hepatocyte proliferation phenotype, which could be a cellular response to tissue damage and the inflammatory microenvironment (figures S8(c) and (d)). Owing to tissue remodeling and an improved microenvironment, 5% FS-TM reduced the degree of hepatocyte proliferation. In summary, fibrosis-induced stress in hepatocytes and treatment with 5% FS-TM improved this state.
Oval cells are key components of liver tissue remodeling and have been identified in rats via dual labeling with CK19 and GGT [41]. We evaluated the status of the oval cells in the fibrotic liver before and after treatment using dual-fluorescence staining. We observed the presence of CK19+/GGT+ oval cells in the bile duct tree region and a significant decrease in the number of oval cells, accompanied by a significant increase in the number of cholangiocytes in the fibrotic liver (figures S9(a)–(c)). After treatment, the number of oval cells recovered and the new bile ducts disappeared.
4. Discussion
Allogeneic MSCs transplantation is a classical strategy in stem cell therapy. This therapy benefits from the low immunogenicity and strong immune-regulatory ability of MSCs. However, MSCs may not be immune-privileged but rather achieve immune escape through immunosuppressive efficacy, which also explains the rapid clearance of MSCs after infusion [42]. In addition, the phenotypic plasticity of stem cells leads to the unpredictable drift and aging of immune regulation under the effects of the microenvironment [12, 15]. Stem cell infusion is a common cause of these adverse effects. Transferring the therapeutic phenotype of MSCs in vitro using bioreactors is a promising strategy. In this study, we report the therapeutic phenotype of MSCs induced by the combination of a bioreactor and special microenvironmental medium. Owing to the presence of various disease-related inducible components, 5% FS was used to induce the therapeutic phenotype of UCMSCs. In addition, we introduced hepatocytes and an appropriate fluid shear force into the bioreactor system, which provided metabolic and paracrine activity while providing a simulated liver microphysiological environment for UCMSCs. Injection of a reaction medium containing immune regulatory components had a significant therapeutic effect on liver fibrosis in rats. Owing to the isolation between the production of the therapeutic medium and the microenvironment in the body, the BSCT scheme can provide continuous and stable therapy. Additionally, BSCT has advantages such as easy storage, increased batch consistency, and no adverse reactions related to cell infusion (e.g. vascular embolism) compared with cell infusion.
Immune regulation is the main mechanism of action of therapeutic media. Liver fibrosis is a pathological state that occurs in a multistep cascade involving immune disorders, HSC activation, hepatocellular damage, and loss of regenerative ability, ultimately leading to excessive fiber proliferation and liver structure damage. The excessive activation of inflammatory reactions induces changes in the liver microenvironment and promotes other pathological processes. First, the secretome of inflammatory cells promotes the activation of HSCs and deposition of fibers in tissues [43]. Second, excessive inflammation damages hepatocyte function and disrupts the regenerative microenvironment. The regulation of immune disorders is critical for the treatment of liver fibrosis. The inhibition of inflammatory cells may promote the repair of liver fibrosis, emphasizing the importance of anti-inflammatory therapies [37]. However, promoting the function of specific inflammatory cells may lead to fiber degradation [32]. These two treatments seem contradictory, but can be reconciled in reality. In the present study, the immunomodulatory effects of the therapeutic medium were not limited to immunosuppression or enhancement. In the initial stages of treatment, the decrease in inflammatory factor levels and inflammatory cell infiltration in the liver represented a decrease in overall inflammatory levels. Notably, we observed a significant increase in the number of macrophages in the fibrotic region accompanied by an increase in MMP expression. MMP secretion by macrophages is an important factor in fiber degradation [44]. The redistribution of macrophages from the parenchymal area to the fibrotic area suggests that the therapeutic effect involves immune regulation rather than simple immunosuppression. Therefore, the treatment of liver fibrosis involves two synergistic pathways: inhibition of the overall inflammatory level and promotion of the redistribution of inflammatory cells related to fiber degradation.
Improvements in the immune microenvironment promote the formation of a tissue regenerative environment. We observed a decrease in the number of HSCs after the treatment. HSCs are a key cell subset that produce collagen during liver fibrosis. The reduction in HSCs, combined with enhanced fiber degradation, promoted the rapid regression of fibrotic tissue in the liver. Second, in fibrotic livers, we observed an increase in hepatocyte apoptosis and genomic damage, as well as the elimination of oval cells. The hepatocytes showed a strong tendency to proliferate. Inflammation, hypoxia, and other injury-related factors can induce hepatocyte proliferation. Genomic damage, accompanied by active proliferation, can further promote genomic instability, which is a factor initiating tumorigenesis [45, 46]. The tendency to form tumors is worse than the damage to hepatocyte function in the fibrotic microenvironment. The BSCT scheme blocks this process through immune regulation and fiber degradation. Therefore, BSCT targets immune disorders and induces cascading therapeutic effects, including fiber degradation, HSCs inhibition, and recovery of the regenerative microenvironment.
The BSCT scheme has good potential for translational approval. Before clinical translation, several key issues in the BSCT scheme must be resolved. First, 5% FS is key to inducing the therapeutic effect of the bioreactor system; however, FS is not a defined medium. Identifying the components with inductive effects in the FS is an important step in the development of an induction medium with defined components. An induction medium with a known composition can encourage a BSCT scheme to enter the clinical trial stage. Second, hepatocyte co-culture and fluid shear force are only a few of the factors used in the construction of the MSCs therapeutic environment. Hypoxia, adhesion interface stiffness, and multicellular co-culture systems are important factors in the microenvironment that induce the therapeutic phenotype of MSCs. Further screening and introduction of multidimensional factors related to tissues into the bioreactor system is an important step to enhance the therapeutic effect of the BSCT scheme and promote clinical translation.
5. Conclusions
In conclusion, the BSCT scheme can be called a 'stem-cell-free' stem cell therapy. This scheme replaces the infusion of stem cells in vivo with in vitro preparation of the therapeutic medium. Therapeutic media promoted a cascade of fibrotic liver repair through immune regulation. Owing to the replaceability of the culture medium in the bioreactor, the BSCT scheme can be easily adapted for other diseases, particularly inflammation-related diseases.
Acknowledgments
This was the outcome of a continuing partnership among all the authors. The authors acknowledge the staff of the Key Laboratory of Biotherapy and Regenerative Medicine of Gansu Province and Biomarker Technologies Company for their assistance.
Data availability statement
The data cannot be made publicly available upon publication because they contain sensitive personal information. The data that support the findings of this study are available upon reasonable request from the authors.
Conflict of interest
The authors declare that they have no competing interests.
Ethics approval and consent to participate
All procedures were approved by the Ethics Committee of the First Hospital of Lanzhou University (ethics approval number: LDYYLL2020-280).
Funding
This work was supported by the National Natural Science Foundation of China (Nos. 82060119 and 32160230) and the Medical Innovation and Development Project of Lanzhou University (No. lzuyxcx-2022-167).
Authors' contributions
Mengchao Yan: Conceptualization, methodology, formal analysis, validation, investigation, and writing of the original draft. Jia Yao: Methodology, formal analysis, and validation. Ye Xie: Methodology, validation, and formal analysis. Pan Jiang: Investigation and visualization. Jun Yan: Investigation. Xun Li: Conceptualization, methodology, funding acquisition, writing–review and editing, supervision, data curation, and project administration.
Supplementary data (12. MB DOCX)