

Abstract
3D printing has rapidly become a critical enabling technology in tissue engineering and regenerative medicine for the fabrication of complex engineered tissues. 3D bioprinting, in particular, has advanced greatly to facilitate the incorporation of a broad spectrum of biomaterials along with cells and biomolecules of interest for in vitro tissue generation. The increasing complexity of novel bioink formulations and application-dependent printing conditions poses a significant challenge for replicating or innovating new bioprinting strategies. As the field continues to grow, it is imperative to establish a cohesive, open-source database that enables users to search through existing 3D printing formulations rapidly and efficiently. Through the efforts of the NIH/NIBIB Center for Engineering Complex Tissues, we have developed, to our knowledge, the first bioink database for extrusion-based 3D printing. The database is publicly available and allows users to search through and easily access information on biomaterials and cells specifically used in 3D printing. In order to enable a community-driven database growth, we have established an open-source portal for researchers to enter their publication information for addition into the database. Although the database has a broad range of capabilities, we demonstrate its utility by performing a comprehensive analysis of the printability domains of two well-established biomaterials in the printing world, namely poly( -caprolactone) and gelatin methacrylate. The database allowed us to rapidly identify combinations of extrusion pressure, temperature, and speed that have been used to print these biomaterials and more importantly, identify domains within which printing was not possible. The data also enabled correlation analysis between all the printing parameters, including needle size and type, that exhibited compatibility for cell-based 3D printing. Overall, this database is an extremely useful tool for the 3D printing and bioprinting community to advance their research and is an important step towards standardization in the field.
Export citation and abstract BibTeX RIS
1. Introduction
The fields of 3D printing and bioprinting have witnessed a phenomenal rise in tissue engineering and regenerative medicine applications in the last decade. The earliest rapid prototyping technologies for layer-by-layer fabrication of 3D constructs were developed in the 1980s for stereolithography-based 3D printing [1, 2]. Since then, new techniques such as selective laser sintering, fused deposition modeling, laminate object manufacturing, and electron beam melting (EBM) have been developed [3] for a broad range of materials including metals [4], ceramics [5], and various thermoplastics [6]. Notably, 3D printing as a way of additive manufacturing has been successfully applied in various sectors such as automotive, manufacturing, aerospace, and health. With growing interest for more accessible 3D printers and the development of the RepRap printer platform in the 2000s, 3D printing has become a more desktop-accessible and cheaper process. The ability to fabricate complex constructs in a layer-by-layer fashion is particularly useful for developing in vitro tissue engineered models composed of cells and biomaterials. Various modalities of 3D printing have been investigated for engineering complex tissues including bone, cartilage, heart, muscle, and liver, and have been extensively reviewed in literature [2, 7–10]. Not surprisingly, the number of research articles that mention 3D printing and bioprinting on PubMed has increased almost 300 fold and 160 fold respectively since 2010 (figure 1), underscoring the tremendous interest and potential impact of leveraging 3D printing techniques in regenerative medicine.
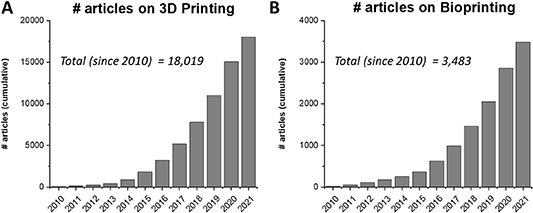
Figure 1. 3D printing and bioprinting trends over the last 10 years. The article numbers were determined via a PubMed search that mention the term (A) '3D printing' or (B) 'Bioprinting' in the tile or abstract.
Download figure:
Standard image High-resolution imageMirroring the development of new 3D printing techniques is the ever-increasing library of 3D-printable materials. Specifically for tissue engineering applications, there is constant innovation in the development of various synthetic and natural polymers [11–13], decellularized extracellular matrix (dECM) materials [14, 15], nanomaterials [16–18], high internal phase emulsions [19], ceramic composites [20–22], and conductive materials [23–25] for 3D printing. This material complexity is further compounded by the incorporation of cells and bioactive molecules within the bioink that demands modifications to its printing conditions.
Despite bioprinting being a nascent field, there has been a conscious effort to address important issues pertaining to the standardization and assessment approaches for factors such as printed construct shape fidelity, reproducibility, material properties, and the hardware and software involved, from regulatory and clinical perspectives [26–28]. However, this does not address the large variability in printing conditions that are unique for each printing modality and to the 3D printer being utilized and published by researchers across the world. Consequently, there is a wealth of published data that is both useful, overwhelming, and at times contrasting, for any newcomer entering this field or interested in experimenting with new biomaterials for 3D printing applications.
Facilitating new bioink research and 3D printing demands a comprehensive, easily searchable, and publicly available database that systematically collates the complex set of parameters that dictate biomaterial 3D printing. Databases in the biomedical research field such as NIH's GenBank, various GEO datasets, Basic Local Alignment Search Tool (BLAST), or FlowRepository for flow cytometry have been extremely valuable research and user tools. Our database would be particularly useful to address the complexity of multi-material bioink formulations and conditions that are more conducive for cell and biological printing. Furthermore, this would need to be a community-driven approach that allows other researchers and users to easily add their own bioink formulations and print parameters to the database, thus keeping it self-sustained and prompting its growth over the years.
Here, we present the establishment of the first bioink database for 3D bioprinting that is open-source and allows users to easily access and add their research to the repository. This database currently focuses solely on microextrusion printing and collates critical print parameters such as bioink composition, pressure, temperature, speed, needle type, and cell type used. The database is openly available at https://cect.umd.edu/3d-printing-database and is currently composed of more than 800 discrete datapoints from almost 350 peer-reviewed articles. Importantly, anyone using the database can easily find and cite the original publication for the selected datapoints. Moreover, researchers can conveniently add their own articles to the database through an online survey form available at https://umdsurvey.umd.edu/jfe/form/SV_ahIl2SK4amMiIIJ. Given the rapid advancements in the field of bioprinting, we propose that such an open-source database will be crucial in facilitating bioprinting research, reduce optimization times for printing existing and new bioink formulations, and be a knowledge base that ultimately fosters innovation in tissue engineering and regenerative medicine.
2. Methods
2.1. Peer-reviewed article selection
All articles for the database were selected from PubMed. Search strings using 'Extrusion 3D Printing', 'Hydrogel', 'Cells', 'Thermoplastics', and combinations thereof were entered into the PubMed advanced search database. Articles were then screened for relevance with review papers, duplicates, and those not involving extrusion printing removed from the list. Additionally, non-peer reviewed articles, papers describing extrusion printing that is not press-driven, unclear description of the bioink formulation, and those missing more than two parameters across pressure, temperature, speed, and needle type, were also screened out. We thus have 347 articles with 810 discrete data points (as of 31 May 2021) and the screening process is show in figure 2.
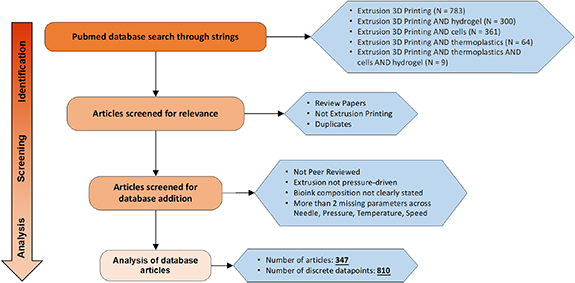
Figure 2. Flow chart for the selection of extrusion-based 3D printing articles for the database. All searches were conducted on PubMed using the search strings described in the figure and screened for relevance. Last date of publication entry in the database is 31 May 2021.
Download figure:
Standard image High-resolution image2.2. Open-source survey for data entry
We have created an open survey form for the entry of new bioink parameters using the Qualtrics platform hosted by the University of Maryland. The survey link is https://umdsurvey.umd.edu/jfe/form/SV_ahIl2SK4amMiIIJ. It requires the user to input information pertaining to the printing dataset such as article DOI, the printer used, bioink composition (up to 3 at a time), crosslinking mechanisms, needle parameters (nozzle type, diameter), pressure (units, high and low range values), temperature (print head, platform, enclosure), speed (high and low range values), and any flow adjustments made. Users wishing to enter more than three bioinks will have to redo the survey.
2.3. Online database upload
The database is openly available and can be found on the website for the NIBIB/NIH Center for Engineering Complex Tissues (CECT), a 3D printing and biofabrication center. The website link is as follows: https://cect.umd.edu/3d-printing-database. The data from the survey is downloaded, parsed for errors and the nomenclature made uniform across existing bioinks. Subsequently, the datapoints are uploaded on a google drive excel file. We are using the Google feature called 'Publish to the Web', which has an option to choose CSV format. The CECT website is run on the Drupal content management system that allows us to read in the CSV file using the URL provided by the google feature mentioned above. Using PHP, we process and parse the CSV file and add the data to an HTML table. The filtering is done in javascript loaded to the web page. For the graphing, we are using a javascript library from Plotly: https://plotly.com/javascript/. The online version of the database allows users to select up to two materials that are co-printed, along with the option of searching for cells of interest. The display is composed of two heat maps: (a) Temperature heat map with the x-axis as bioink wt% and y-axis as pressure (bar); (b) Speed heat map with the x-axis as bioink wt% and y axis as pressure (bar). For datasets that included a range of parameter values, e.g. a high and low of printing pressure or temperature, all combinations of the parameters were plotted in the heat map. Additionally, all data is tabulated at the bottom. The heat map allows the user to visualize the print parameter space for the selected bioink, while the tabulated data provides all the published parameter values. The user can select a datapoint of interest on the heat map to find the specific article DOI. Finally, the selected data can be downloaded by the user as an excel file for additional analysis. A step-by-step procedure for using the database is described in figure 3.
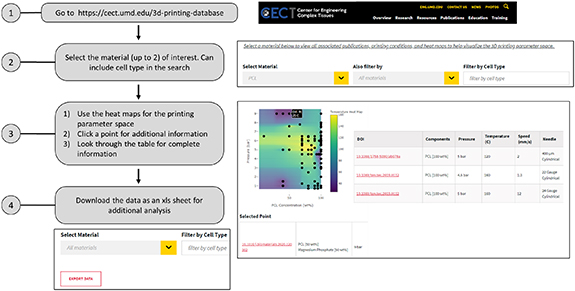
Figure 3. A flow chart depicting the process for using the database. The users can refer to the database to quickly find the material of interest and additional printing conditions. Alternatively, the entire dataset can be downloaded for extensive analysis based on the available published data.
Download figure:
Standard image High-resolution image2.4. Data analysis
All data analysis was performed using Python scripts (see supplemental data) and the contour heat maps were plotted using OriginPro. In case of a high and low range for a particular parameter (e.g. pressure printing at 4–5 bar), a combination of all the printing conditions at the given range values were used for the generation of the heat maps. In all the contour heat maps, the z-axis used for contouring is labeled to help visualize contour construction. Pearson correlation coefficients were calculated using the OriginPro software.
3. Results
3.1. Evaluation of bioink compositions
We tabulated a total of 220 distinct bioink components that were used for 3D printing. This included thermoplastics (such as poly(-caprolactone) (PCL), PLA, PLGA), natural and synthetic polymers (such as PEGs, collagen, alginate, dECMs), ceramics (such as hydroxyapatite, β tri-calcium phosphate), various nanomaterials and nanocomposites, biomolecules, and proteins that were used as additives in the extruded bioinks. The entire list of the biomaterials can be found on the database website mentioned in the section 2. We note the top ten biomaterials that were used as bioink components in figure 4(A). We further tabulated the top polymer combinations that were extruded for 3D printing. These signified not just the biomaterials, but the entire bioink compositions that were 3D printed. The top ten polymer combinations can be seen in figure 4(B) and the complete bioink composition for a particular biomaterial can be found in the online database tables as described in the section 2.

Figure 4. Most common biomaterials and polymer combinations. (A) The top ten biomaterials printed via extrusion 3D printing. (B) The top ten polymer combinations 3D printed. Note that the most common biomaterials such as PCL, alginate, or gelatin are often printed in combination with other biomaterials.
Download figure:
Standard image High-resolution image3.2. Case study for PCL printing
PCL is a commonly used thermoplastic that is used in 3D printing applications for its biocompatibility, ease of printing, and strong mechanical properties. As observed from our database, researchers have used PCL of varying molecular weights for 3D printing. We examined the impact of printing parameters, namely pressure, temperature, speed, and needle size, on the extrusion of PCL when printed at 100 wt%. The heat maps in figure 5 effectively provide a printing parameter space for PCL. Not surprisingly, the choice of molecular weight impacts the pressure and temperature at which it can be successfully printed, with the highest pressure being 8 bar and the highest temperature being upwards of 180 °C for extrusion (figure 5(A)). To effectively evaluate the role of needle size on PCL printing at various molecular weights, we mapped it as a function of both pressure and temperature (figure 5(B)). PCL is a thermoplastic that exhibits decreasing viscosity with increasing temperatures. Consequently, the pressure at which PCL is extruded is inversely proportional to the extrusion temperature. We observe that for a given pressure and temperature combination, the needle size used is relatively constant across all molecular weights. We further examined the Pearson Correlation coefficients between each printing parameter in a pairwise manner. The heat map in figure 5(C) denotes no strong correlations between either of the parameters. As expected, a positive correlation (green color on the heat map) is observed between molecular weight and pressure, temperature, and needle size. This indicates that as PCL molecular weight is increased, a higher pressure, temperature, or needle size is needed for extrusion. Correspondingly, the printing speed is reduced (red color on the heat map). The correlation coefficients values are provided in supplementary table 1.
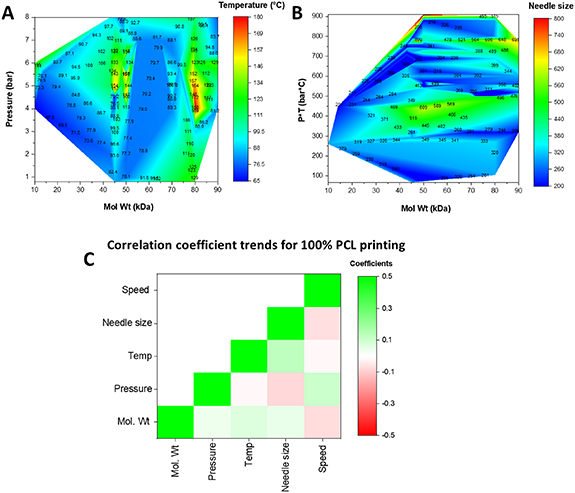
Figure 5. Contour heat map of the printing parameters for 100 wt% PCL at different molecular weights. (A) Impact of molecular weight on the pressure and temperature needed for extrusion. (B) Impact on needle size. (C) A heat map of the pearson correlation coefficients for each of the parameters with green showing a positive correlation and red indicating a negative correlation between the parameters. Units: speed (mm s−1); needle size (um), temp (C); pressure (bar); Mol Wt (kDa).
Download figure:
Standard image High-resolution imageWe further expanded our analysis to include all PCL printing conditions across all molecular weights. As seen in figure 6(A), the PCL printability domain extends from 10 to 100 wt% for various combinations of temperatures and pressures. Overall, a strong positive correlation (p < 0.001) is observed between wt% and the pressure and temperature needed for extrusion (figure 6(C)). This is further verified by the heat map that shows either high pressure, temperature, or a combination of both needed as the PCL wt% increases. Similarly, a strong negative correlation is observed between printing speed and PCL wt% (p < 0.05) as well as between needle size and extrusion pressure (p < 0.001). Overall, these maps help identify the tradeoffs between the printing parameters for the desired bioink composition. The correlation coefficients values for PCL printing are provided in supplementary table 2.

Figure 6. Contour heat map of the printing parameters for PCL across all wt%. (A) Contour heat map depicting the relationship between PCL wt%, the extrusion pressure, and temperature for printing. (B) Contour heat map depicting the relationship between PCL wt%, temperature, and printing speed. (C) A heat map of the Pearson correlation coefficients for each of the parameters with green showing a positive correlation and red indicating a negative correlation between the parameters. Units: speed (mm s−1); needle size (μm); temp (°C); pressure (bar) * p < 0.05; ** p < 0.01; *** p < 0.001.
Download figure:
Standard image High-resolution image3.3. Case study for GelMA printing
We examined the impact of 3D printing gelatin methacrylate (GelMA) either own its own (i.e. the only bioink component, GelMA-only) or when mixed within a multicomponent bioink composed of other biomaterials (all-GelMA) such as alginate or methylcellulose. Not surprisingly, the range of concentration (wt% or w/v% depending on the reporting) at which GelMA was printed broadened when mixed with other biomaterials, particularly at lower concentrations. This is likely due to the unfavorable rheological properties and low viscosity observed for low densities that impact extrusion-based 3D printing, which was then offset by the high viscosity biomaterials. As seen in the heat maps (figures 7(A)–(D)), an increase in GelMA wt% broadly corresponded to an increase in either pressure or temperature, or a combination thereof. This was verified by the correlation coefficient heat maps for both GelMA-only and all-GelMA bioinks (figures 7(E) and (F)). Interestingly, the correlation of pressure and wt% is significantly higher compared to temperature and wt%. This indicates that at higher GelMA concentrations, it is better to use higher pressures for extrusion rather than increase temperature to reduce viscosity. GelMA printing occurs at higher speeds of up to 20 mm s−1 or more, compared to the more viscous PCL printing (∼10 mm s−1). Temperature and speed are negatively correlated for both GelMA-only and all-GelMA bioinks, but only pressure was significantly correlated with wt% for the all- GelMA bioinks. Finally, we observe that needle size correlated strongly and negatively with temperature, and to a weak extent with wt% and pressure. This suggests that should higher print resolution be needed, the temperature of the print should be considered first before altering either pressure or wt%. The correlation coefficients values for GelMA printing are provided in supplementary tables 3 and 4.

Figure 7. Contour heat maps and correlations for GelMA printing. (A), (B) Contour heat maps of pressure, temperature, and speed as a function of GelMA wt% for cases where GelMA was the only biomaterial. (C), (D) Contour heat maps of pressure, temperature, and speed as a function of GelMA wt% for cases where GelMA was a component of a multi-component bioink. (E), (F) A heat map of the Pearson correlation coefficients for each of the parameters with green showing a positive correlation and red indicating a negative correlation between the parameters for GelMA-only prints (E) and for all cases all GelMA printing (F). * p < 0.05; ** p < 0.01; *** p < 0.001.
Download figure:
Standard image High-resolution image3.4. Case study for cell printing
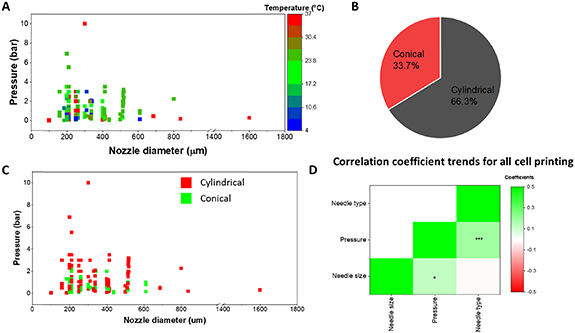
We further examined all bioink printing conditions that involved printing cellular components. A complete list of all cells currently in the database can be found in supplementary table 6. Of note, this list only represents cells that were included in the database and the absence of a cell type in the list does not imply that it cannot be 3D printed. Users can search via cell type to further filter the biomaterial-based search results. As seen in figure 8(A), most of the cellular printing occurs at pressures below 4 bar, as increased shear forces within the needle are detrimental to cell viability [29, 30]. A temperature range of between 15 °C and 25 °C is used for cell printing, although some conditions reach a high of 37 °C or lows of below 10 °C. Needle diameter and whether the extrusion tip is cylindrical or conical is also known to impact cell viability and shape fidelity [31]. Almost 2/3 of all cell-based prints were conducted using cylindrical needles while the rest were performed using conical needles (figure 8(B)). Interestingly, the type of needle used strongly correlated with the extrusion pressure needed for printing as can be seen both in figures 8(C) and (D). For the heat map, we denoted conical needles as 1 and cylindrical needles as 2. Our results indicate that switching from conical to cylindrical needles resulted in significantly higher pressures needed for extrusion and had no bearing on the needle diameter. The correlation coefficients values for all cell printing are provided in supplementary table 5.
Figure 8. Parameter space for conditions involving cell printing. (A) Correlation between nozzle diameter, pressure, and temperature for all bioinks used in cell printing. (B) Ratio of prints using either conical or cylindrical needles for cell-based printing. (C) The impact of needle type (cylindrical vs. conical) on the extrusion pressure. (D) Correlation coefficient heatmap for all cell-based printing. Units: needle size (um), pressure (bar). * p < 0.05; *** p < 0.001.
Download figure:
Standard image High-resolution image
4. Discussion
A major component of 3D printing, particularly extrusion-based, is the optimization of bioink compositions and their printing parameters. This is further influenced by external factors not directly under a researcher's control such as ambient temperature, humidity, type of printer, batch variability of the biomaterial, human error etc. Additionally, researchers may choose to formulate bioink compositions that are uniquely relevant to their applications. As a result, despite there being an overwhelming number of papers on 3D printing as seen in figure 1, it is a non-trivial task to identify the optimal combination of key printing parameters such as pressure, temperature, speed, bioink composition, needle size and type that are perfectly suited to the researchers' needs. This is quite evident from the contour heat maps seen in figures 5–7 that highlight the broad variation in the printing domain for a single material.
We undertook the endeavor of building a publicly available database to directly address this need. It is essential for the 3D printing and tissue engineering community to both support and be supported by the wealth of knowledge generated in this field to accelerate the speed of innovation. We focused on extrusion-based 3D printing as it is one of the most commonly used printing modalities capable of incorporating cells and biologics. A systematic screening of hundreds of articles on PubMed as described in figure 2 established the foundation for our existing database. One of the challenges associated with selecting articles was that certain papers did not provide sufficient or complete information regarding the printing parameters. We chose to screen out any articles that were missing more than 2 parameters across pressure, temperature, speed, and needle type in order to minimize the gaps in our dataset. The selected papers are all reflected in the online database and can be readily accessed as shown in figure 3. We have endeavored to make the interface user-friendly while providing key elements of the printing parameter space of biomaterial combinations for rapid analysis. Critically, we have enabled users to download the parameter information in a single excel file for in-depth statistical analysis, thereby facilitating studies in machine learning that are supported by large, published datasets to drive 3D printing research. Apart from a direct analysis of the downloaded data, some of the other practical applications of this database include targeted search for extrusion-based 3D printing papers on a particular material, cell type, or combinations thereof; rapid visualization of the printability domains of a material which can then be leveraged by a user for their specific printing application; and a source of reference for all researchers keen on experimenting with modifications of established bioinks.
Our database allows us to map trends in the various biomaterials used for extrusion-based 3D printing. An important distinction must be made between extrusion inks comprised of single or multiple biomaterials, and the biomaterials themselves that are being printed. For example, figure 4(A) shows common biomaterials such as alginate, gelatin, PCL, and GelMA that are routinely used in tissue engineering applications were among the top ten biomaterials used, either by themselves, or in combination with other biomaterials. However, while alginate is the top biomaterial used, it is preferably printed with gelatin presumably for more favorable thixotropic and rheological properties for 3D printing as indicated in figure 4(B). We further recognize that the type and model of printer used also impacts printing conditions, likely due to differences in software or operating conditions. This variability in printing hardware further highlights the importance of the database. Supplemental figure 1 shows the top ten 3D printing companies whose printers were used for each of the printed bioinks. While the choice of a printer is secondary, differences in printing outcomes could potentially be ascribed to differences in their operating conditions and must be considered.
In order to analyze the printability domains of various biomaterials, we developed contour heat maps to simultaneously visualize up to 3 parameter combinations. Case studies were made for the commonly printed thermoplastic PCL and the hydrogel GelMA as shown in figures 5–7. A key outcome of these heatmaps is the presence of white spaces across the map. These indicate a lack of data at those specific parameter combinations, either because they have not yet been tested, or simply because material printing at those combinations is not feasible. We believe this to be an important tool for new researchers in helping them guide their optimization efforts for these or similar bioink combinations. The heat maps also project anomalies in the printing conditions. For example, a region of low temperature printing (<50 °C) at high PCL wt% can be seen in figure 6(A) that defies the printing conditions of the neighboring regions. Such anomalies can be seen throughout all maps and are a consequence of specialized printing parameters. PCL can be dissolved in a solvent such as DMSO to drastically reduce its printing temperature to under 50 °C even at 100 wt% [32]. However, the database heat map only records the low printing pressure and temperature and cannot inform the user about the solvent condition. It would be up to the user to investigate these anomalies while using the database. Our analysis of the Pearson Correlation coefficient further provides valuable insights into multi-parameter relationships. For example, higher temperatures and pressures are required to extrude higher weight fractions of PCL. Interestingly, a negative correlation between extrusion pressure and needle size corresponds to the Hagen–Poiseuille equation, which states that the pressure difference across two ends of a pipe is inversely correlated to the fourth power of the pipe's radius [33]. Similar trends and observations could be made for GelMA printing.
Finally, this database can be leveraged to facilitate improved parameter selection for cell-based 3D printing. Cells and biomolecules are highly sensitive to extrinsic cues and are known to perish under high shear stresses experienced within the needle during extrusion. Notably, factors such as cell concentration, their phenotype, and size, will impact material viscosity and consequently, printability. Therefore, biomaterial printability might have to be further tuned in the presence of cells, especially at high cell concentrations, for optimal printability and high cell viability. Optimization of cellular printing can be a long and expensive process and can benefit from metrics provided by the database. For example, despite a majority of cell-based prints being done using cylindrical needles, our correlation analysis indicates that in fact conical needles requires lower extrusion pressures compared to cylindrical and are likely to have lower cell death. Heat maps that describe the printability domain for various biomaterials (discussed specifically for PCL and GelMA here) can be derived for all biomaterials and conditions provided in the database. It provides further insight into why each material is printed under specific conditions and its correlation to other factors, such as cell viability. For example, a positive correlation between pressure and needle size indicates that to obtain viable cells post-printing, materials that require high pressure (due to inherent bioink properties) require larger needle sizes for reduced shear stress on the cells. By downloading and analyzing data for their specific biomaterials of interest, users are encouraged to draw similar conclusions for their applications.
One of the most exciting aspects of 3D printing is the constant innovation in the development of new biomaterials for various regenerative medicine applications. This drives the formulation of new bioinks that now need to undergo the arduous optimization process for printability. We propose that the database can be a valuable tool for facilitating this process by using the existing materials in the database as a guidepost for the selection of their printability domains. It is crucial to determine under what combination of printing factors (temperature, pressure, speed, needle type) the bioink is not printable, does not maintain shape fidelity, or does not promote high cell viability in a rapid manner. Furthermore, the shape fidelity of a printed construct is critical to the success of a 3D print. For example, biomaterials with a low modulus might be prone to buckling under their own weight and as dictated by the overlying geometry, result in structural collapse. It is entirely reasonable to expect that printability and bioink requirement for tall structures (50 or 100 layer) would be different than those of shorter or fewer layers (e.g. 10 or less). Of course, researchers will have to define their own thresholds for printability success before establishing 3D printing applications for their new formulations.
It is important to note that beyond the basic parameters of temperature, pressure, speed, and needle type, biomaterial printability is also determined by other input parameters such as bioink viscosity, storage and loss modulus, shear thinning properties, and output process parameters such as print resolution, line width, shape fidelity, cell viability, that overall determine the success of a print. The modes for measuring printability and the threshold for success are expected to vary across users as well as applications. Consequently, this data was not included in our compilation of this database to provide users with unbiased information regarding material printability. Ultimately, we aim for the database to provide trends and metrics to enable a more rational and systematic experimental design for 3D printing. By making this database open source, both for access as well as data entry, we hope to reach a broader audience of scientists, engineers, and researchers, who can benefit from this tool. Additionally, we are keen to work with scientific journals, publishers, and other academic entities to encourage their readers and users to use this database on a regular basis, thus developing an active user base.
5. Conclusion
We have developed to our knowledge the first open-source 3D printing database for bioinks and biomaterials. The database can be accessed online through the CECT website and provides users with a searchable list of bioinks and cells used for 3D printing. All data is displayed in both graphic and tabular format and is also available for download for further analysis by any user. Finally, we have created an open-source survey link for researchers to add their publications to the database. Moving forward, we aim to work with the biomedical community to fuel further innovation in 3D printing through the use of our database. We hope that independent analysis of this openly available data by researchers as well as their inputs on incorporating new printing modalities will play a pivotal role in the maintenance and expansion of this database.
Acknowledgments
The authors would like to express their sincere gratitude to the staff from Engineering Information Technology at the University of Maryland for all their help with the development and publication of the database website. This work was supported by the National Institute of Biomedical Imaging and Bioengineering/National Institutes of Health (NIBIB/NIH) Center for Engineering Complex Tissues (P41 EB023833).
Data availability statement
All data that support the findings of this study are included within the article (and any supplementary files).
Conflict of interest
No competing financial interests exist.
Supplementary data (0.1 MB PDF)
Supplementary data (0.1 MB CSV)