
Abstract
Multicellular agglomerates in form of irregularly shaped or spherical clusters can recapitulate cell–cell interactions and are referred to as microtissues. Microtissues gain increasing attention in several fields including cardiovascular research. Cardiac microtissues are evolving as excellent model systems for drug testing in vitro (organ-on-a-chip), are used as tissue bricks in 3D printing processes and pave the way for improved cell replacement therapies in vivo. Microtissues are formed for example in hanging drop culture or specialized microwell plates; truly scalable methods are not yet available. In this study, a novel method of encapsulation of cells in poly-N-isopropylacrylamid (PNIPAAm) spheres is introduced. Murine induced pluripotent stem cell-derived cardiomyocytes and bone marrow-derived mesenchymal stem cells were encapsulated in PNIPAAm by raising the temperature of droplets formed in a microfluidics setup above the lower critical solute temperature (LCST) of 32 °C. PNIPAAM precipitates to a water-insoluble physically linked gel above the LCST and shrinks by the expulsion of water, thereby trapping the cells in a collapsing polymer network and increasing the cell density by one order of magnitude. Within 24 h, stable cardiac microtissues were first formed and later released from their polymer shell by washout of PNIPAAm at temperatures below the LCST. Rhythmically contracting microtissues showed homogenous cell distribution, age-dependent sarcomere organizations and action potential generation. The novel approach is applicable for microtissue formation from various cell types and can be implemented into scalable workflows.
Export citation and abstract BibTeX RIS

Original content from this work may be used under the terms of the Creative Commons Attribution 4.0 license. Any further distribution of this work must maintain attribution to the author(s) and the title of the work, journal citation and DOI.
1. Introduction
Mouse and human pluripotent stem cells (PSCs) serve as model systems to study cell development and a source of organotypic cells for various applications worldwide. Particularly, the discovery of induced pluripotent stem cells (iPSCs) has increased the chance to obtain and use human pluripotent cells from healthy and diseased donors. Scientists work on refined protocols to generate various organotypic cells from iPSCs. In order to initiate differentiation, PSCs are traditionally cultivated in spheroids called embryoid bodies (EBs) that spontaneously form when PSCs are cultivated in suspension cultures or hanging drop cultures or on non-adhesive cell culture wells [1]. The spontaneous differentiation of PSCs in EBs gives rise to descendants of all three germ layers including cardiomyocytes (CMs). The CMs can be purified by antibiotic lineage selection approaches to yield pure cells for downstream assays [2].
The spontaneous differentiation approach using EBs has been replaced by 2D differentiation protocols in most applications with human iPSCs [3–6]. The advancing knowledge of differentiation pathways has paved the way for shaping the differentiation process to generate the desired cell types at high efficiencies. The traditional EB approach in combination with growth factor induction was further implemented in 3D bioreactor cultures [7]. In the light of the high quality of 2D differentiation methods, bioreactor-based methods tend to be restricted to applications where massive scales of differentiation are required. These developments have shifted the approach of PSC differentiation from a 3D culture to a 2D based culture in many laboratories.
Although 2D cultures can be used to address uncounted scientific questions the interaction of cells in a 3D environment opens new avenues in many applications. In cardiac cell therapy, it was shown early that single PSC-derived CMs (PSC-CMs) hardly engraft in the diseased murine tissue while the addition of connective tissue cells substantially enhances the cell engraftment in vitro and in vivo [2, 8, 9]. Based on such findings, we have developed a simple method of generating microtissues from mesenchymal stem cells (MSCs) and murine iPSC-CMs (miPSC-CMs) resulting in >10-fold enhanced early engraftment of PSC-CMs. The idea of generating microtissues for cardiac cell therapy was further explored by Monsanto et al demonstrating that a triple combination of c-Kit+ cardiac interstitial cells, endothelial progenitors and MSCs, referred to as 'CardioClusters', not only engrafts efficiently into the infarcted rodent heart but also helps to restore cardiac function [10]. Another popular application of multi-cellular clusters involving CMs is the establishment of in vitro models for screening pharmaceutics. Recently, a multicellular model of spherical cardiac microtissues, including CMs, endothelial cells and cardiac fibroblasts, was found to successfully recapitulate human arrhythmogenic cardiomyopathy in vitro [11]. Finally, the use of cell spheroids is not limited to the establishment of cell therapies in vivo or drug screening in vitro. Spheroidal microtissues are also utilized as tissue bricks in novel 3D bioprinting approaches to assemble bioartificial tissue from intact microtissues instead of single cells [12, 13] (for a review see [14]).
The above-mentioned applications have in common that microtissues are mainly generated by non-scalable methods. A simple but rather uncontrolled method is the generation of cell patches composed of one or multiple cell types from thermo-responsible polymer surfaces [8]. More defined methods use hanging drop cultures to combine cells in individual drops of cell suspension hanging at the lid of a petri dish for one to two days. During the culture period, cells cluster in the tip of the drop and form spheroids [15]. An advanced technology based on hanging drops is the 'cardiac spheroid' approach described by Polonchuk et al [16]. This technology combines the three most abundant cells of the human heart, namely CMs, endothelial cells and cardiac fibroblasts, at exactly defined ratios into functional microtissues [16]. Figtree et al applied a similar strategy of generating cardiac microtissues in hanging drops and demonstrated formation of vessel-like structures [17]. Moreover, the vascularized cardiac microtissues responded to inducers of cardiac fibrosis and recapitulated the cardiotoxic effects described for cardiac tissue in vivo. These studies underline the significance of cardiac microtissues as model systems to study cardiac physiology and even recapitulate pathophysiological settings in vitro.
Another possibility to generate cell spheroids under defined conditions is the use of microwell plates with bottoms shaped like an inverted pyramid to collect the cells at the tip of the well and support their assembly into spherical microtissues [18]. Using hanging drop cultures or suitable microwell plates results in the generation of homogenous cell spheroids with defined cell number and composition.
Microtissues can be produced by combining matrix protein gels and cells: Thavandiran employed collagen I gel as a matrix for the generation of cardiac microtissues that were successfully used as an in vitro model for tachycardia related arrhythmia [19]. The use of matrix proteins and casting molds for the generation of bioartificial cardiac tissue is not only applicable in the field of microtissue production, but allows fabrication of engineered cardiac tissue with macroscopic dimensions used for disease modeling in vitro and therapeutically applications in vivo as well [20, 21]. Such engineered tissues show a high degree of complexity at the cost of limited scalability of the production process. In order to generate vascular microtissues Annamalaia et al developed a water in oil emulsion technology to produce fibrin based spheroidal microtissues in a scalable workflow [22].
Hanging drop protocols usually capture 500–1000 cells per 20 µl drop as the number of cells is limited by the low medium volume of the drop. As an example of downstream application, it is estimated that cardiac cell therapy in a porcine model of cardiac infarction can be successful when using 109–1010 PSC-CMs for intramyocardial injection. To combine the cells into microtissues, 106–107 hanging drops on ten thousand of petri dishes would be required to produce the proper amount of microtissues. Further cells such as endothelial cells and connective tissue cells were not included in the calculation. The scalability of microwell-based methods is comparable low. From this simple example it can be deduced that novel methods need to be evolved to produce microtissues for various applications in 3D printing, drug screening and cell replacement therapy in a scalable fashion.
One such approach of scalable microtissues generation is the coencapsulation of a defined number of cells, and controlled release of the cell preparation at a later stage. Alginate is commonly used as a basis for cell encapsulation and it allows easy, reproducible and reversible encapsulation of various cell types as has been shown in many scientific reports (for a review see [23]). Alginate converts from a solution into a gel by ionic crosslinking with divalent cations such as Ca++ and Ba++. The process is reversed by chelating agents such as Ethylendiamintetraessigsäure (EDTA). The method has been implemented into countless applications in life science, such as encapsulation of pharmaceutically active substances and different types of cells. Chayosumrit et al used alginate to encapsulate human PSCs and induced endodermal differentiation [24]. Analysis of the encapsulated cell for more than a week indicates the formation of individual and separated clusters of proliferating stem cells inside the alginate capsules.
Encapsulation of neonatal rat CMs in alginate revealed that pure preparation of CMs were not viable inside the capsules [25]. To solve the problem, alginate was modified with collagen to allow the cells attachment to the capsule material, resulting in the formation of cell islet within three days and dense multilayer clusters within two months [25]. In a recent approach, alginate capsules were used to culture cardiac microtissues in vitro [26]. When loaded with preformed cardiac cell spheroids and a suspension of endothelial cells, an increase in metabolic activity of encapsulated cells was observed within 15 days. Loading of the capsules with a combined single-cell suspension of CMs, endothelial cells and MSC did not produce compact microtissues of these three cell types inside the capsules. In conclusion, the alginate encapsulation method is suitable to generate microenvironments for cardiac microtissues. However, alginate encapsulation is not the method of choice to generate cardiac microtissues from cell suspensions de novo.
Here we report a method for a microtissue generation that can be implemented into scalable workflows. The thermoresponsive polymer poly-N-isopropylacrylamid (PNIPAAm) is used to encapsulate miPSC-CMs and bone-marrow derived MSCs in a microfluidic approach. PNIPAAm is water-soluble below 32 °C and nontoxic. Above a critical temperature of 32 °C, PNIPAAm molecules undergo a coil-to-globule phase transition and become essentially water-insoluble. During the phase transition, the physically entangled PNIPAAm gel shows substantial thermoshrinkage. This shrinkage can be explained by the expulsion of water from hydrophilic groups due to entropic reasons [27]. We speculate that non-crosslinked thermoshrinking PNIPAAM gels entrap cells in a dense network of contracting strings of polymer, thereby fostering the generation of spherical microtissues in a short time. The concept is proven by the encapsulation of miPSC-CMs and MSCs and subsequent harvesting of functional cardiac microtissues.
2. Material and methods
2.1. PNIPAAm synthesis
The synthesis was carried out at room temperature. In an evacuated, and subsequently, N2 flooded 250 ml round bottom flask with magnetic stirrer, 150 ml deionized water and 10 g (88 mmol) N-isopropylacrylamide were added. After dissolving the solid monomer while stirring, 120 mg (0.53 mmol) ammonium peroxodisulfate was added. After homogenization, 61.5 mg (0.53 mmol) Tetramethylethylenediamine (TEMED) was added, and the reaction was carried out for 2 h while stirring. After reaction time, the viscosity of the reaction solution was increased, and the product was precipitated in deionized water at 60 °C. The precipitate was vacuum filtered through a Büchner funnel with standard filter paper, washed with 80 °C hot deionized water and freeze-dried for further use.
2.2. PNIPAAm solution
The freeze-dried polymer was weighed and then sterilized by supercritical carbon dioxide in presence of peracetic acid. Freeze-dried PNIPAAm was added to a 100 ml Erlenmeyer flask and the flask was packed into a Tyvek sterilization bag and sealed. For sterilization, a Novagenesis bench top device (Novasterilis, NY) with 1.0 l vessel was used. A sterilizing supplement containing peracetic acid (NovaKill™, Novasterilis, NY) was added according to the manufacturer's instructions. A Tyvek sealed flask with PNIPAAm was placed in the vessel. The vessel was filled with liquid carbon dioxide and a booster pump was used to raise the vessel pressure to 1500 PSI. The temperature was set to 35 °C, and the magnetic stirrer was activated. Sterilization was performed for 90 min. The pressure was released slowly, and remaining traces of NovaKill™ were removed under vacuum. Dulbecco's phosphate buffered solution without calcium and magnesium (DPBS -/-, Gibco) was then added to create a PNIPAAm solution at a concentration of 1.8 wt/vol%. PNIPAAm was left on a magnetic stirrer at 50 rounds per minute (rpm) for 24 h to allow the freeze-dried PNIPAAm to solve.
2.3. Microfluidic setup
A microfluidics chip was generated at the workshop of the medical faculty, University of Cologne. The exact dimensions of the chip are illustrated by the technical drawing in figure 1. The chip was connected to the tubing system via Luer-Lock Connectors (Carl Roth, Karlsruhe, Germany). To create a constant flow at preset rates, two infusion pumps (Landgraf Laborsysteme HLL GmbH, Langenhagen, Germany) were used. Pump 1 was loaded with two 20 ml syringes, both containing rapeseed oil. Rapeseed oil is used because it is environmentally friendly; furthermore, it easily separates from the aqueous phase due to lower density. From these syringes, fluorinated ethylene propylene (FEP) inflow tubes with an inner diameter of 1.58 mm ran to the Y-shaped side port channels of a flow-focusing microfluidic chip. The exact dimensions of the chip are provided in figure 1(A).
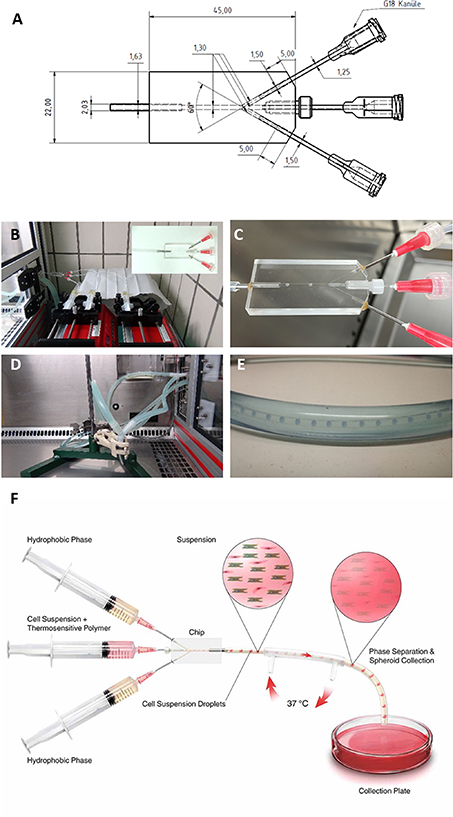
Figure 1. Microfluidic setup for microtissue formation by thermo-reversible encapsulation. (A) Technical drawing of the microfluidics chip. (B) Setup of perfusor pumps at room temperature with microfluidic chip. (C) Generation of droplets from PNIPAAm solution in rapeseed oil fluid stream. (D) Double wall heated tube setup inside a heated laminar flow bench. The tube carrying the liquid stream from the microfluidic chip is warmed to 37 °C by a counter flow heater. (E) Enlarged image of the counterflow heater tube with inner tube transporting the droplets/hydrogel spheres. (F) Schematic drawing of the setup.
Download figure:
Standard image High-resolution imageThe central channel was connected to a 20 ml syringe mounted on pump 2 and used to inject PNIPAAm solutions or PNIPAAm enriched cell suspension into the microfluidic chip. Homogenous droplets of the PNIPAAm containing solution (water phase) are generated as oil flows into the chip through the side ports. The resulting PNIPAAm containing droplets were transported in a continuous oil flow and enter a tube that is heated to 37 °C by a counter-streaming tube heater (see figure 1 for illustrations). After 40 cm in the heated tube, the gelled PNIPAAm spheroids left the tubing system under a sterile hood heated to 39 °C and were transferred to a 37 °C humidified cell culture incubator with 5% CO2.
2.4. Sterilization of microfluidics parts
Parts of the microfluidics system were sterilized for 30 min in hydrogen peroxide vapor followed by low-pressure oxygen plasma treatment for 30 min. Briefly, the dry parts of the microfluidic were sealed in Tyvek pouches and brought into the plasma chamber. A −20 °C cold aliquot of 30% H2O2 was opened and placed in the chamber. The device was rapidly evacuated to 0.15 mbar and the pump was stopped to allow H2O2 to evaporate. After 30 min, the chamber was again evacuated to 0.2 mbar. Oxygen was automatically injected to keep the working pressure at 0.2 mbar. Plasma was ignited and samples were sterilized in plasma for 30 min. The process was performed in a Plasma Flecto 30 (Plasma Technologies, Germany).
2.5. Production of PNIPAAm beads
To produce cell-free polymer beads, the middle inflow tube of the microfluidic setup was connected to a 20 ml syringe containing PNIPAAm solution. This solution was created by mixing the 1.8 wt/vol% solution of PNIPAAm in DPBS -/- and Dulbecco's Modified Eagle's Medium (DMEM) containing 4.5 g glucose l−1 (Thermo Fisher Scientific, Germany) at room temperature (20 °C–22 °C) at 50/50 ratio to obtain a cell suspension containing a final PNIPAAm concentration of 0.9 wt/vol%. The syringes connected to the outer inflow tubes contained rapeseed oil.
The PNIPAAm beads were produced by setting the flow rate of the PNIPAAm solution to 0.025 ml min−1 and the flow rates of the oil to 0.1 ml min−1. The beads were collected in a 10 cm cell culture dish (Sarstedt Laborbedarf, Nümbrecht, Germany) containing rapeseed oil pre-warmed to 39 °C.
The beads were measured with light microscopy and NIS-Elements software (Nikon Europe, Amsterdam, Netherlands). To visualize the beads' surface, the sample was mounted on a heated stage on an upright light microscope (Carl Zeiss Microscopy Deutschland GmbH) equipped with dipping objectives and Orca Flash 4.0 V2 camera (Hamamatsu Photonics Deutschland, Herrsching am Ammersee, Germany). The sample was illuminated from the side by two gooseneck LED lights to allow visualization of the surface.
2.6. Cell culture and generation of miPS cell-derived CMs
Human renal carcinoma cells (cell line 786-O) engineered to express an enhanced green fluorescent protein (eGFP) were used for the initial establishment of the methods. The unmodified cell line was kindly provided by the Clinic II for Internal Medicine, University Hospital of Cologne. The cells were transfected by nucleofection with the eGFP control plasmid (pmaxGFP™) provided by Lonza (Lonza Group Ltd, Basel, Switzerland) along with the nucleofector kit. Stably transfected green fluorescent cells were enriched by limiting dilution and selection of GFP positive colonies. The cells were cultured in complete DMEM (4.5 g) glucose l−1 with 15% fetal calf serum (FCS) (Sigma-Aldrich, Taufkirchen, Germany). MSCs were prepared as described previously [8] and cultured in complete DMEM containing (1 g) glucose l−1 (Thermo Fisher Scientific) and 15% FCS. For a generation of miPS-CMs, TαP4 [28] cultivated on mitomycin inactivated embryonic feeder cells in Iscove's modified Dulbecco's medium (IMDM) supplemented with 15% FCS and 1000 units ml−1 leukemia inhibitory factor (ORF Genetics, Reykjavik, Iceland). Start of differentiation was counted as day 0. On day 0 miPSCs were dissociated into single cells by 0.05% trypsin/EDTA (Gibco by Thermo Fisher Scientific) and 106 cells were re-suspended in 12 ml IMDM with 20% FCS and 200 µg ml−1 L-ascorbic acid phosphate magnesium salt n-hydrate (Wako Chemicals GmbH, Neuss, Germany). The cell suspension was transferred to a 10 cm bacteriological petri dish (Sarstedt Laborbedarf, Nümbrecht, Germany) and cultured in a humidified incubator on a rocking table at 40 rpm for two days. In suspension, miPSC form cell spheroids and/or clusters, referred to as EBs. On day 2, EBs were collected and diluted to 800 EBs per 10 cm bacteriological petri dish in 14 ml IMDM with 20% FCS and 50 µg ml−1 ascorbic acid. Plates were left on a rocking table inside the cell culture incubator. On day 7, EBs from two plates were collected to one plate and the medium was changed to IMDM with 5% FCS. On day 8, EBs from two plates were pooled to one plate and the medium was changed (IMDM 5% FCS). Puromycin (Invivogen, Toulouse, France) was added to a final concentration of 10 µg ml−1 to eliminate all non-CMs. Steps from day 8 were repeated on day 9. The medium was changed daily with IMDM plus 5% FCS and 10 µg ml−1 puromycin. On weekends IMDM with 20% FCS was used instead to maintain cells without medium change.
Puromycin-selected iPS cell-derived CMs (iPSC-CMs) were dissociated on day 12. The day before dissociation, 10 cm cell culture dishes were coated with 10 µg ml−1 fibronectin in PBS overnight at 4 °C. One plate per 10–15 × 106 CMs was prepared. Dissociation was performed on the shaker at 37 °C for 30–35 min. Trypsin was blocked with undiluted FCS and cells were dissociated by gentle pipetting (10–15 repetitions). (Note: Rigorous pipetting destroys the CMs.) miPSC-CMs were spun down at 180 g and resuspended in PBS. The cells were filtered through a 40 µm cell sieve to obtain a single-cell suspension. miPS-CMs were counted in a Neubauer counting chamber, spun down at 180 g for 5 min, and re-suspended in IMDM with 10% FCS supplementation.
2.7. Cluster formation
On day 13 of differentiation, miPSC-CMs were harvested by trypsinization and viable cells were counted after trypan blue (Gibco by Thermo Fisher) staining. For further processing, the cells were re-suspended in IMDM supplemented with 10% FCS and chilled on ice. MSCs and 786-0 were treated the same way but resuspended in their respective culture medium.
For the encapsulation of cells, a cell suspension with a total absolute cell count of 2 × 10⁶ cells was prepared. If miPSC-CMs and MSCs were encapsulated together, their suspensions were combined to a cell ratio of 4:1 (miPSC-CMs:MSCs). After centrifugation of the cell suspension, the supernatant was discarded carefully. The cells were resuspended in 100 µl of cell culture medium and 100 µl PNIPAAm 1.8 wt/vol%. This polymer-cell suspension was then transferred to a 1 ml syringe (BD, Heidelberg, Germany). The cell suspension in PNIPAAm solution was injected into the middle inflow tube manually. (Hence, after loading the microfluidic system the cell suspension is now in place in the tube connected to the middle port of the chip. Next, the encapsulation suspension is transported forward into the chip for cell encapsulation.) Flow rates were set at 0.1 ml min−1 for the lateral inflow tubes and 0.425 ml min−1 for the middle inflow tube. For the middle channel, the oil is used to push forward the PNIPAAm containing cell suspension. Once the PNIPAAm-cell suspension reached the microfluidic chip, the flow rate of the middle inflow tube was reduced to 0.025 ml min−1. The recurrent flow tube heater was operated at 37 °C. Polymer beads leaving the tube heater in their hydrogel phase were collected in 10 cm culture dishes with pre-warmed IMDM 10% FCS inside a heated sterile cabinet. For handling and transport of the spheres, caution was taken to keep temperature of the medium above the critical temperature of 32 °C. After 24 h of incubation at 37 °C and 5% CO2, the polymer beads were cooled to room temperature by letting them stand under a sterile hood for 15 min. The culture medium was carefully discarded and replaced by DPBS -/- at room temperature. This process was repeated twice for washing the cell aggregates with DPBS -/- and removing the PNIPAAm which had been solved in the culture medium.
2.8. Hanging drop culture
A cell suspension with a density of 250 cells µl−1 was prepared. The cell suspension contained 80% miPSC-CMs and 20% MSCs. Five square shaped polystyrene plates were prepared by adding 15 ml DPBS per plate. With a multichannel pipette, the cell suspension was dispersed in droplets of 20 µl each onto the lids of the square plates. The lids were carefully placed back on the plates and the hanging drops were incubated for 24 h in a humidified incubator at 37 °C, 5% CO2. During this incubation time cell spheroids formed at the tips of the hanging drop. For harvesting of the spheroids the lids were flushed with cell culture medium and spheroids were transferred to a non-adhesive 10 cm dish. The dishes were further cultured on a rocking table inside a cell culture incubator.
2.9. Spheroid cell counting
For cell counting, a single cluster in 30 µl DPBS -/- was transferred to a well of a 96-well plate (Greiner bio-one) manually by a microliter pipette. Then, 70 µl 0.05% trypsin/EDTA were added. After 2 min of incubation at 37 °C, the cells were separated mechanically by repeated pipetting with a 200 µl pipette with a 'yellow tip'. After 2 more minutes of incubation at 37 °C, the obtained single cells were counted by trypan blue staining using a hematocytometer.
2.10. Cell staining
A live-dead cell assay kit based on calcein AM and ethidiumhomodimer-1 (Thermo Fisher Life Technologies, Germany) was used according to the manufacturer's instructions. Cell aggregates in 200 µl IMDM were incubated with 200 µl staining solution containing calcein AM 1:1000, ethidium homodimer-1 1:500, and 5 µg ml−1 Hoechst dye for 30 min. Staining was evaluated immediately after the incubation by fluorescence microscopy. For detection of apoptosis in sections of microtissues a Click-iT Plus TUNEL assay conjugated with Alexa Fluor 488 (Invitrogen, #C10617) was used.
For immunofluorescence staining, cell aggregates were unleashed from the PNIPAAm hydrogel, the aggregates were fixed and permeabilized with 100% methanol (Sigma-Aldrich, Taufkirchen, Germany) at −20 °C for 10 min. The aggregates were washed with DPBS -/- and then incubated with 3% bovine serum albumine (BSA) (Sigma-Aldrich) for 1 h at room temperature. After washing with DPBS -/- once more, the cell aggregates were incubated with primary anti-α-actinin monoclonal IgG (Sigma-Aldrich, clone EA-53, isotype IgG1) in 3% BSA for 16 h at 4 °C. For staining of MSCs monoclonal anti-vimentin antibodies produced in mouse (Sigma-Aldrich, clone LN-6, isotype IgM) were used. After a further washing step, secondary detection was performed by goat anti-mouse IgG Alexa Fluor 647 and goat anti-mouse IgM Alexa Fluor 555 (both from Thermo Fisher Scientific). Conjugated monoclonal anti-CD29 IgG (Miltenyi Biotec, Bergisch Gladbach, Germany) was used to stain total cells. About 1 µg Hoechst 33342 dye (Sigma-Aldrich) in 3% BSA were added to the aggregates in order to stain nuclear DNA. Samples were incubated for 60 min in the dark at room temperature. After multiple washing steps, the stained aggregates were analyzed with a fluorescence microscope (Axiovert 200, Carl Zeiss Microscopy Deutschland GmbH) using AxioVision 4.5 software as well as by an SP8 confocal microscope (Leica Microsystems).
2.11. Action potential (AP) measurement
Intracellular AP measurements with sharp glass microelectrodes (20–50 MΩ resistance when filled with 3 mol l−1 KCl; World Precision Instrument, Sarasota, USA) have been performed as described previously [29, 30]. APs of TαP derived CMs were measured in cell cluster containing CMs and MSCs. Recordings were performed at two different time points, 24 h (directly after removal of PNIPAAm) and 72 h (24 h in PNIPAAm plus 48 h in culture) after preparing the cell cluster. APs of iPSC-CM were measured without external stimulation. The recording electrode was connected to an SEC-10LX amplifier (npi electronic, Tamm, Germany), and the signal was acquired with the Pulse software (HEKA, Lambrecht/Pfalz, Germany). Data were analyzed with Mini Analysis (Synaptosoft, Fort Lee, USA). All data from AP measurements are presented as mean ± SEM. Differences of AP parameters were tested for statistical significance by Student's t-test. A two-sided p-value <0.05 was considered statistically significant. GraphPad Prism version 8 (GraphPad Software, San Diego, California, USA) was used for all calculations and creating AP graphs.
2.12. Statistical analysis
Differences between the experimental groups were determined by using one-way analysis of variance. An unpaired and Bonferroni corrected t-test was used as post-hoc test. A difference was considered significant when p < 0.05. All values are presented as mean ± standard deviation (mean ± SD). Statistical analysis and graphing were performed using Microsoft Excel.
2.13. Preparation of mMSC-PNIPAAm beads for scanning electron microscopy
The microfluidic method was used to encapsulate murine mesenchymal stromal cells (MMSCs) inside PNIPAAm beads. Therefore, a total number of 2.0 × 10⁶ mMSCs was resuspended in 100 µl DMEM with 15% FCS mixed with 100 µl 1.8% PNIPAAm suspension and injected into the system for cell encapsulation. When the mMSC-PNIPAAm beads left the heated tubing system, they were dropped into liquid nitrogen, transferred as frozen beads to a centrifuge tube inside a −20 °C pre-chilled aluminum block and transferred to an ultralow freezer at −80 °C until further processing. Next, the mMSC-PNIPAAm beads were freeze dried for 24 h. To remove the remaining rapeseed oil, 20 ml of dry ethanol were added to the tube with the mMSC-PNIPAAm beads, mixed gently, and agitated on a shaker at room temperature for 4 h at 300 rpm. Beads were separated from ethanol by gravity. To remove residual ethanol, the samples were kept in a vacuum desiccator for 2 h. Because of some remaining oil, the washing step with the absolute ethanol was repeated. For the second washing step, the samples were incubated with 2 ml dry ethanol overnight on a shaker and vacuum dried in a desiccator. Samples were mounted on a stub using a double sided adhesive carbon tape and sputter coated with a 12 nm gold layer. Examination was done by a FEI Quantus 250 scanning electron microscope.
2.14. Synthesis of PNIPAAm-co-rhodamin
The synthesis was carried out at room temperature. In an evacuated and subsequently, N2 flooded 50 ml round bottom flask with magnetic stirrer, 2 g (18 mmol) N-isopropylacrylamide and 30 ml deionized water were added. Then 20 mg acryloxyethyl thiocarbamoyl rhodamine B was added. After dissolving the solid monomer under stirring, 24 mg (0.1 mmol) ammonium peroxodisulfate were added. Following homogenization, 12.3 mg (0.1 mmol) TEMED was added, and the reaction was carried out for 2 h while stirring. With the increasing reaction time, the viscosity of the reaction solution increases, and the product was precipitated in deionized water at 60 °C. The precipitate was vacuum filtered through a Büchner funnel with standard filter paper, washed with 80 °C hot deionized water and dried overnight in the vacuum drying oven at 40 °C.
2.15. PNIPAAm-co-rhodamin washout
For the experiment 1.8% PNIPAAm-co-rhodamine solution was diluted with 1.8% unlabeled PNIPAAm solution in a ratio of 1:10. This solution is referred to as 'Rhodamine-PNIPAAm'. Rhodamine-PNIPAAm was used to encapsulate mMSC with the microfluidic method. Therefore 2.0 × 10⁶ cells in total were resuspended in 100 µl of DMEM with 15% FCS and mixed with 100 µl of the rhodamine-PNIPAAm before injected into the system. After the mMSC-PNIPAAm beads were generated and collected in 10 cm dishes filled with 15% DMEM. Beads were incubated for 24 h at 37 °C, 5% CO2 before the rhodamine-PNIPAAm was washed out. To remove the rhodamine-PNIPAAm capsule, the cell-PNIPAAm beads were incubated in a petri dish with 10 ml DPBS at room temperature. The plate was gently swirled. PBS was removed as complete as possible and replaced by fresh PBS (room temperature). This step was repeated in total six times to remove dissolved PNIPAAM and rapeseed oil. The washing procedures took about 10 min in total. For further analysis, the washed cell spheroids were transferred to a petri dish filled with fresh cell culture medium and incubated on a rocking table inside a cell culture incubator for 24 h. Spheroids were stained with Hoechst dye and analyzed under a fluorescent microscope.
3. Results
3.1. Production of PNIPAAm beads
In order to produce PNIPAAm spheroids, a microfluidics chip was designed (figure 1(A)). The chip is equipped with two ports that transport the hydrophobic phase (rapeseed oil) at an angle of 60° to the central channel. A central port is used to inject the PNIPAAm containing an aqueous phase into the oil stream (figure 1(B)). At the tip of the cannula, a spherical droplet is formed and buds off once the forces produced by the flow of the hydrophobic phase exceed the retraction forces at the interphase of the hydrophobic phase and aqueous solution (figure 1(C)). Using a flow of 25 µl min−1 for the aqueous phase, a production rate of 28 droplets per minute was estimated. Droplets moved forward to the exit of the chip and entered a tube with a heated mantle inside a heated sterile cabinet (figures 1(D) and (E)). Heating the droplets to above the lower critical solute temperature (LCST) of 32 °C resulted in the phase change of the PNIPAAm and precipitation of solid and hydrophobic PNIPAAm. The droplets turned from fully transparent liquid drops to opaque hydrogel spheres at this stage. A schematic drawing of the setup is provided in figure 1(F).
For a demonstration of the change in transparency, droplets were imaged in a non-heated (room temperature) tube (figure 2(A)) and collected in a multiwell plate filled with 37 °C warm medium (figure 2(B)). For the further experiments, the setup outlined in figure 1(F) was used and operated with cell-free PNIPAAm solution. The resulting transmission light microscopy revealed that a spherical shape of the PNIPAAm beads was generated by this setup (figure 2(C)). Dark field microscopy showed that the polymer had formed 3D interwoven meshes at the surface of the spheroids (figure 2(D)). When PNIPAAm solution without cells was injected into the system, round beads with a mean diameter of 718 ± 28 µm (n = 115) formed (figure 2(E)). After 4 h of incubation above the LCST spheroids reduced in size to a mean diameter of 516 ± 25 µm (n = 35) (figure 2(F)).
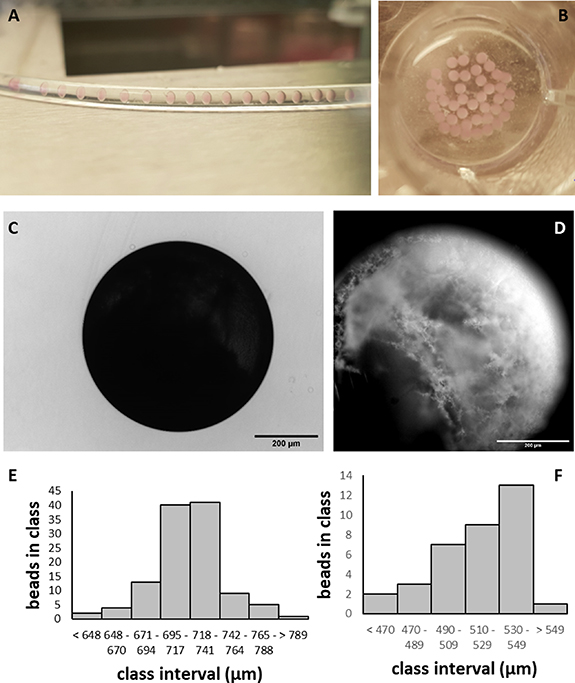
Figure 2. Characterization of cell-free PNIPAAm hydrogel spheroids. (A) Cell-free PNIPAAm solution droplets in a non-heated tube. (B) Collected droplets heated to 37 °C and converted into PNIPAAm hydrogel spheroids. (C) Transmission light image of PNIPAAm spheroid generated in the microfluidic system and warmed to 37 °C. (D) Darkfield image of PNIPAAm spheroid illustrating the surface structure. (E) Size distribution of PNIPAAm hydrogel spheroids soon after phase transition. (F) Size distribution of PNIPAAM hydrogel spheroids 4 h after phase transition.
Download figure:
Standard image High-resolution image3.2. Generation of cell aggregates with renal carcinoma cells
In the next step, the ability of PNIPAAm to encapsulate cells and promote the formation of cell aggregates was tested. Initial experiments were conducted with eGFP expressing 786-0 renal carcinoma cells. First, we experimented to check whether incubation of the cells within the hydrogel capsule is necessary to form cell aggregates. 786-0 cells were encapsulated and the PNIPAAm capsules were transferred to room temperature shortly after they had been collected at the outlet of the production unit. Directly after transfer to room temperature, capsules appeared non-transparent to light (figure 3(A)). After 2 min at room temperature, the hydrogel started to become transparent (figure 3(B)). After 4 min at room temperature, the capsules dissolved as PNIPAAm underwent phase transition, and encapsulated cells were released (figure 3(C)). No formation of aggregates was observed at this stage. Therefore, an incubation of the cells inside the hydrogel shell was necessary to form aggregates. The number of cells released per capsule when dissolved immediately after encapsulation was estimated as 3636 ± 1575 single cells (n = 22).
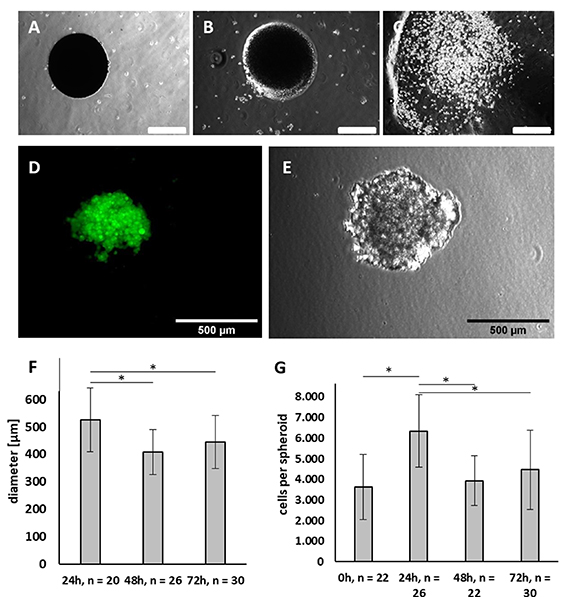
Figure 3. Characterization of renal carcinoma cell aggregates generated by PNIPAAm encapsulation. PNIPAAm capsule loaded with 768-0 tumor cells and transferred to room temperature directly after the encapsulation process without further incubation period at 37 °C. (A) Immediately after transfer to room temperature, (B) 2 min after transfer to room temperature, (C) 4 min after transfer to room temperature. Note that the spheroid dissolved after 4 min and released its content in form of single cells. (D) Green fluorescent protein expressing 768-0 tumor cells encapsulated and cultivated for 24 h prior to release. (E) 768-0 tumor cells encapsulated and cultivated for 24 h prior to release in transmission light. (F) Size of 768-0 tumor cell clusters encapsulated for 24, 48 and 72 h in PNIPAAm. (G) Cell number of 768-0 tumor cells released directly (0) or 24, 48 or 72 h after encapsulation. (A)–(E) Scale bars: 500 µm.
Download figure:
Standard image High-resolution imageAfter 24 h of incubation in PNIPAAm, cell aggregates formed and showed a round, spheroid-like shape (figures 3(D) and (E)). Cell aggregates were obtained 24 h after encapsulation by washing out the hydrogel shell and showed a mean diameter of 525 ± 116 µm (n = 20) (figure 3(F)). These aggregates contained 6346 ± 1753 cells (n = 26) (figure 3(G)). That is 1.7-fold more than directly after the encapsulation, pointing to cell proliferation in the first 24 h. Incubation of the cells inside the hydrogel shell for 48 or 72 h instead, resulted in a significantly (p < 0.001) reduced cell count of 3932 ± 1209 (n = 22) and 4467 ± 1932 (n = 30), respectively. In line with this observation, the clusters obtained after 48 and 72 h of incubation had a significantly (p < 0.001 and p = 0.01) smaller diameter of 407 ± 82 µm (n = 26) and 445 ± 97 µm (n = 30), respectively, as compared to cell clusters released after 24 h.
3.3. Generation of aggregates using different PNIPAAm concentrations and oil flow rates
Encapsulation experiments in this work were performed using a 1.8% PNIPAAm stock solution. The PNIPAAm stock solution is diluted 1 + 1 with the cell suspension to result in a final PNIPAAm concentration of 0.9% in the microfluidics. In order to test if an increase of the PNIPAAm concentration reduces the time for microtissue formation PNIPAAm stock solutions of 1.8%, 2.4% and 3.0% were tested for encapsulation of MSCs (supplementary figure 1 (available online at stacks.iop.org/BF/14/035017/mmedia)). When 1.8% PNIPAAm solution was used, no compact microtissues were formed after 4 h. In contrast, 24 h were sufficient for microtissue formation. About 2.4% and 3.0% PNIPAAm facilitated microtissue formation within 4 h. To further reduce the duration of encapsulation, MSCs were encapsulated in 2.4% for 1 or 3 h, respectively. While 1 h did not result in compact microtissues, encapsulation for 3 h produced microtissues that appear less compact as compared to approaches with longer encapsulation times. An increase of the PNIPAAm stock solution to 3.6% did not produce microtissues in either 1 or 3 h.
In some applications it could be necessary to fine tune not only the cellular composition of the microtissues but also its absolute size. To address the relation between flow parameters and final size of microtissues, we varied the flow rate of rapeseed oil while keeping the flow rate of the cell suspension constant. It was found that an increase of the hydrophobic phase flow rate results in a decrease in the diameter of the resulting microtissues (supplementary figure 2).
3.4. Generation of microtissues from miPSC-CMs and MSCs
In a proof-of-concept approach to generate functional cardiac microtissues, purified miPSC-CMs and MSCs were used. When miPSC-CMs were encapsulated together with MSCs at a 4:1 ratio, the diameter of the microtissues that were released after 24 h in the hydrogel shell had an average diameter of 341 ± 31 µm (n = 20) (figure 4(A)). If the aggregates were recovered from the hydrogel after 48 or 72 h, they showed an increased diameter of 363 ± 74 µm (n = 39) and 391 ± 51 µm (n = 73) respectively. When microtissues were released from PNIPAAm after 24 h and further cultivated for 24 h (video 1) or 48 h (video 2) they retained their spherical shape and were found to contract autonomously and regularly.

Figure 4. Generation of cardiac microtissues by PNIPAAm encapsulation. (A) Diameter of cardiac microtissues from murine iPSC-CMs and MSCs (ratio 4:1) encapsulated in PNIPAAm and released after 24, 48 and 72 h. (B) Cell number of cardiac microtissues encapsulated for 0, 24, 48 and 72 h in PNIPAAm. (C)–(F) Live (calcein AM)–dead (ethidiumhomodimer) and Hoechst staining of cardiac microtissues encapsulated for 24 h in PNIPAAm and analyzed immediately after release ((C) Hoechst dye, (D) calcein AM, (E) ethidiumhomodimer, (F) overlay). Figures (G)–(N) show cardiac microtissues released after 24 h and cultivated two additional days on a rocking table inside a cell culture incubator.
Download figure:
Standard image High-resolution imageHydrogel beads dissolved directly after the encapsulation of iPSC-CMs and MSCs contained 5020 ± 1741 cells per microtissue (n = 25) (figure 4(B)). After 24 h of incubation in the hydrogel shell, the clusters contained 4485 ± 1574 cells (n = 34). While this decrease in cell number was not significant (p = 0.23), aggregates obtained after 48 and 72 h of incubation in the polymer showed significant (p < 0.001) cell count decreases to 3477 ± 1331 (n = 44) and 3044 ± 1211 (n = 57) cells per aggregate.
Staining of live cells with calcein dye (green) and dead cells with ethidiumhomodimer (red) was performed and qualitatively analyzed. All nuclei were stained with Hoechst dye (blue). After release of cardiac microtissues from the hydrogel shell the majority of cells were found to be alive and only a few nuclei positive for ethidiumhomodimer were identified (figures 4(C)–(F)). To exclude that cell death occurs with delay another fraction of the microtissues were released from the polymer shell after 24 h and cultured for two days on a rocking table inside a cell culture incubator. Live-dead staining again revealed only single dead cells as indicated by ethidiumhomodimer positive nuclei (figures 4(G)–(N)).
3.5. Characterization of cardiac microtissues—confocal microscopy
As the aggregates obtained after 24 h of incubation in PNIPAAm contained the highest cell counts, further analysis focused on this group. Once released from the polymer shell, the cardiac microtissues showed spontaneous contractions. Directly following release from the hydrogel shell, microtissues were labeled with antibodies against the cardiac protein α-actinin and the common surface marker CD29 (ß1-integrin) known to be highly expressed by MSCs and imaged by confocal microscopy (figures 5(A)–(D)). It was noted that the surface presented itself as rough with cells standing out above the general surface level. As yet, tunnels or canals reaching into the interior of the spheroids, which could result from the removal of PNIPAAm, could not be observed. This description of the surface is in line with the impression gained by transmission light microscopy. As far as the antibodies reached into the microtissues, the different cell types appeared to be homogenously intermingled.
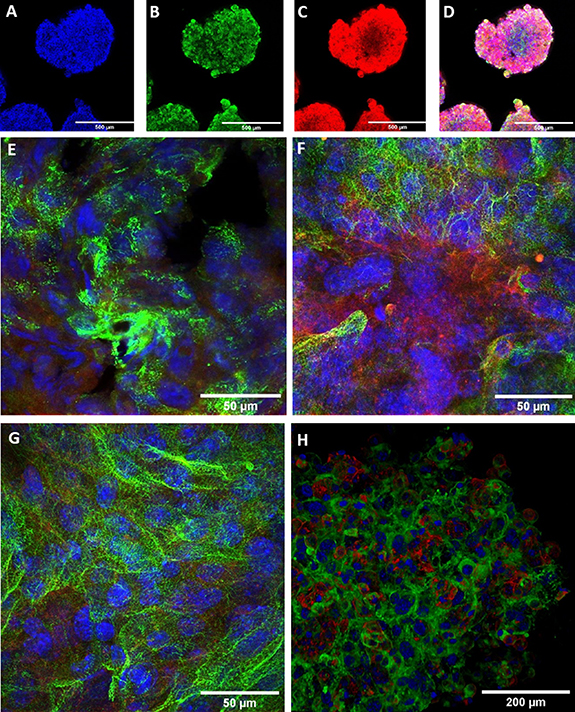
Figure 5. Confocal imaging of cardiac microtissues. (A)–(D) Cardiac microtissue shortly after release from the hydrogel shell. (E) Higher power magnification of cardiac microtissue shortly after release from the shell. (F) Cardiac microtissue cultured for one additional day after release. (G) Cardiac microtissue cultured for two additional days after release. (H) Cardiac microtissue directly after release from the hydrogel shell. Three-dimensional surface rendering after confocal z-stacking. Blue: Hoechst dye, green: sarcomeric α-aktinin, red: CD29. Scale bare 500 µm for (A)–(D), and 50 µm for (E)–(H).
Download figure:
Standard image High-resolution imageAt the time point of release from the polymer, the miPSC-CMs were at day 14 of differentiation. Confocal imaging of z-disc protein α-actinin revealed nascent striation of their sarcomeres (figure 5(E)). To further investigate the CMs' fate within the spheroids, PNIPAAm was washed out of some microtissues after 24 h of incubation. These microtissues were then further incubated under continuous agitation to prevent adhesion of the microtissues to each other. After 24 and 48 h of shaker culture, the microtissues still exhibited a round shape. The surface appeared smoothened. After 24 h the clusters' diameter was reduced to (309 ± 25) µm (n = 12). This is significantly (p = 0.007) less than at the time of release from the hydrogel. Aggregates that were incubated on a shaker for 48 h had a diameter of (341 ± 21) µm (n = 10), which does not differ significantly (p = 0.94) from the diameter at the time of release from the hydrogel. The clusters which had been released from the hydrogel and further incubated on a shaker were fixed and stained with antibodies against α-actinin and CD29 and examined by confocal microscopy. CMs at day 15 showed improved striation (figure 5(F)). miPSC-CMs at day 16 showed further signs of the sarcomeric organization (figure 5(G)), indicating an ongoing process of sarcomere maturation. Confocal z-stacking was conducted on microtissues after removal of the hydrogel shell and planar projections were generated (figure 5(H)). The surface projection supports the conclusion that the microtissues exhibit rough surfaces right after removal of PNIPAAm.
3.6. Electrophysiological characterization of cardiac microtissues
Sharp electrode AP measurements in miPSC-CMs/MSC microtissues (figure 6) were performed to analyze electrophysiological properties after 48 h (24 h + 24 h (24 h in the PNIPAAm shell + 24 h in culture post PNIPAAm washout), n = 6), 96 h (24 h + 72 h, n = 8), 8 days (n = 11) and 15 days (n = 6). Hanging drop clusters generated from equal cell numbers as found per PNIPAAm capsule were measured after 48 h (24 h + 24 h, n = 7) and 72 h (24 h + 48 h, n = 3).
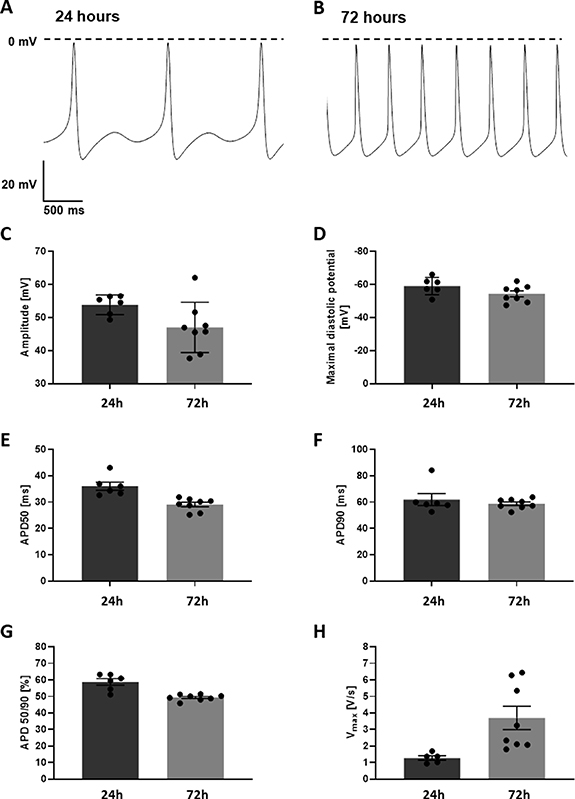
Figure 6. Action potential recordings of cardiac microtissues. Spontaneous action potentials of cardiac microtissues 24 h (A) and 72 h (B) after release from the hydrogel shell. (C) Amplitude of action potentials. (D) Mean diastolic potentials. (E) Action potential duration until 50% depolarization (APD50). (F) Action potential duration until 90% depolarization (APD90). (G) APD50/APD90 ratio. (H) Maximum upstroke velocity.
Download figure:
Standard image High-resolution imageIn PNIPAAm capsule-derived microtissues, CMs showed typically cardiac AP-shape of young, unmature CMs. Analyses of AP properties showed significant differences between 48 h, 96 h, 8 days and 15 days in in amplitude (48 h: 53.8 ± 1.2 mV; 96 h: 48.26 ± 2.69 mV; 8 days: 58.14 ± 1.7 mV; 15 days: 37.46 ± 5.06 mV, p < 0.001) AP duration at 50% of repolarization (APD50; 48 h: 36.05 ± 1.55 ms; 96 h: 28.70 ± 0.86 ms; 8 days: 20.32 ± 0.34 ms; 15 days: 19.17 ± 4.94 ms; p < 0.001), AP duration at 90% of repolarization (APD90; 48 h: 61.98 ± 4.57 ms; 96 h: 58.25 ± 1.31 ms; 8 days: 54.45 ± 1.96 ms; 15 days: 45.00 ± 9.93 ms; p < 0.001) the ration of AP duration at 50% of repolarization and the AP duration of 90% of repolarization (APD 50/90; 48 h: 58.79 ± 2.02%; 96 h: 49.2 ± 0.65%; 8 days: 37.50 ± 0.94%; 15 days: 42.97 ± 5.66%, p < 0.001), the upstroke velocity (Vmax; 48 h 1.28 ± 0.14 V s−1; 96 h: 3.7 ± 0.7 V s−1; 8 days: 13.52 ± 2.6 V s−1; 15 days: 4.18 ± 0.81 V s−1, p < 0.001) and spontaneous contraction frequency (48 h: 0.6 ± 0.2 Hz; 96 h: 3.4 ± 0.2 Hz; 8 days: 4.78 ± 0.18 Hz; 15 days: 5.87 ± 0.81 Hz, p < 0.001). Comparison of AP properties revealed no significant differences between 48 h, 96 h, 8 days and 15 days old microtissues in the maximal diastolic potential (MDP; 96 h: −59.08 ± 2.13 mV; 96 h: −55.89 ± 1.78 mV; day 8: −57.31 ± 0.83 mV; day 15: −51.38 ± 6.95, p = 2.476; table 1).
Table 1. Electrophysiological parameters of cardiac microtissues generated in PNIPAAm capsules.
| Age of microtissue | Amplitude (mV) | MDP (mV) | APD50 (ms) | APD90 (ms) | APD 50/90 (%) | Vmax (V s−1) | Frequency (Hz) |
|---|---|---|---|---|---|---|---|
| 24 h + 24 h | 53.88 ± 1.21 | −59.08 ± 2.13 | 36.05 ± 1.55 | 61.98 ± 4.57 | 58.79 ± 2.02 | 1.28 ± 0.14 | 0.6 ± 0.2 |
| 24 h + 72 h | 48.26 ± 2.69 | −55.89 ± 1.78 | 28.70 ± 0.86 | 58.25 ± 1.31 | 49.20 ± 0.65 | 3.7 ± 0.7 | 3.4 ± 0.2 |
| 8 days (pacemaker like APs) | 16.92 ± 2.3 | −44.74 ± 3.36 | 55.69 ± 8.9 | 114.68 ± 17,5 | 48.34 ± 0.52 | 1.07 ± 0.31 | 4.33 ± 0.81 |
| 8 days (non-pacemaker-like APs) | 58.14 ± 1.70 | −57.31 ± 0.83 | 20.32 ± 0.34 | 54.45 ± 1.96 | 37.50 ± 0.94 | 10.63 ± 0.48 | 4.78 ± 0.18 |
| 15 days | 37.46 ± 5.06 | −51.38 ± 6.95 | 19.17 ± 4.94 | 45.00 ± 9.93 | 42.97 ± 5.66 | 4.18 ± 0.81 | 5.87 ± 0.81 |
| p-value | Amplitude | MDP | APD50 | APD90 | APD 50/90 | Vmax | Frequency |
| 48 h vs 96 h | 0.060 | 0.111 | 0.001 | 0.463 | <0.001 | 0.022 | <0.001 |
| 8 days—pacemaker vs 8 days other CM | 0.001 | 0.006 | 0.001 | 0.001 | <0.001 | 0.006 | 0.490 |
| 8 days vs 15 days | <0.001 | 0.058 | 0.156 | 0.007 | 0.031 | 0.003 | 0.133 |
Analyses of AP properties in hanging drop cluster (supplementary figure 3 and table 2) revealed significant differences between 48 h and 72 h cluster in amplitude (48 h: 41.59 ± 4.29 mV; 72 h: 23.90 ± 3.3 mV, p = 0.037), MDP (48 h: −48.03 ± 2.76 mV; 72 h: −37.3 ± 1.97 mV, p = 0.045), APD50 (48 h: 33.04 ± 3.04 ms; 72 h: 40.54 ± 2.6 ms, p = 0.013) and APD90 (48 h: 60.63 ± 3.04 ms; 72 h: 78.69 ± 5.43 ms, p = 0.014). Comparison of AP properties revealed no significant differences between 48 h and 72 h in APD50/90 (48 h: 54.75 ± 0.97%; 72 h: 51.55 ± 0.36%, p = 0.074), Vmax (48 h: 2.94 ± 0.56 V s−1; 72 h: 1.04 ± 0.26 V s−1) and frequency (48 h: 3.3 ± 0.48 Hz; 72 h: 2.4 ± 0.2 Hz, p = 0.201).
Table 2. Electrophysiological parameters of cardiac microtissues generated in hanging drops.
| Age of hanging drop microtissues | Amplitude (mV) | MDP (mV) | APD50 (ms) | APD90 (ms) | APD 50/90 (%) | Vmax (V s−1) | Frequency (Hz) |
|---|---|---|---|---|---|---|---|
| 24 h + 24 h | 23.90 ± 3.3 | −37.3 ± 1.97 | 40.54 ± 2.6 | 78.69 ± 5.43 | 51.55 ± 0.36 | 1.04 ± 0.26 | 2.4 ± 0.2 |
| 24 h + 48 h | 41.59 ± 4.29 | −48.03 ± 2.76 | 33.04 ± 3.04 | 60.63 ± 3.04 | 54.75 ± 0.97 | 2.94 ± 0.56 | 3.3 ± 0.48 |
| p-value | Amplitude | MDP | APD50 | APD90 | APD 50/90 | Vmax | Frequency |
| — | 0.037 | 0.045 | 0.013 | 0.014 | 0.074 | 0.068 | 0.201 |
During the analysis of the AP recording, it was noticeable that the success rate of AP measurements in hanging drop and PNIPAAm capsule-derived microtissues dropped at the latest time points analyzed. The success rate is defined as the ratio between successful and unsuccessful AP recording attempts. In PNIPAAm capsule-derived microtissues the success rate of AP measurements was 60% (48 h: 6 out of 10 attempts were successful) at 48 h, 61.5% at 96 h (8 out of 13 attempts were successful), 73.3% at 8 days (11 out of 15 attempts were successful) and 20.1% at 15 days (6 out of 29 attempts were successful). In hanging drop clusters the success rate of AP measurements was 63.6% (7 out of 11 attempts were successful) at 48 h and 27.3% (3 out of 11 attempts were successful) at 72 h. Increasing amount of dead cells inside the older cell clusters might led to the higher unsuccessful attempts of AP measurements.
3.7. Cell distribution and apoptosis
In order to identify potential segregation of the cells during longer culture of cardiac microtissues, stainings for vimentin as a marker for MSCs and cardiac α-actinin were performed. The staining was combined with a TUNEL assay to test for increased apoptosis rates. It was found that there is no segregation of CMs and MSCs in microtissues cultured for 96 or 168 h after PNIPAAm removal. After 96 h few apoptotic cells were observed while after 168 h DNA fragmentation was found widespread throughout the microtissues (figure 7). In hanging drop derived microtissues massive apoptosis was detected at early timepoints (supplementary figure 3).
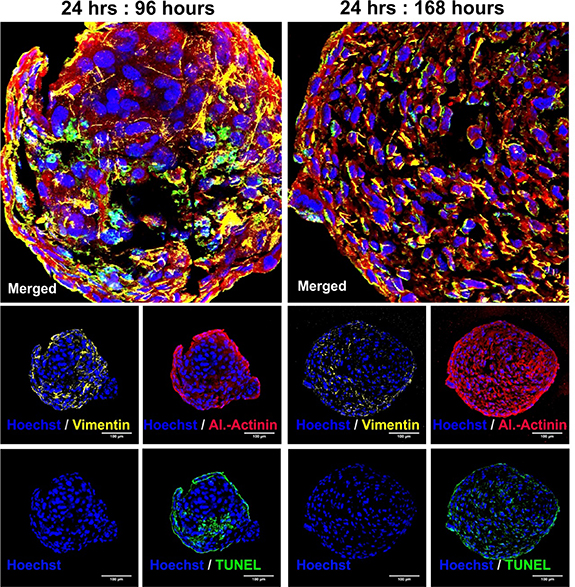
Figure 7. Cell distribution and apoptosis in cardiac microtissues. At time points 96 and 168 h after encapsulation, sections were stained for vimentin (yellow), cardiac α-actinin (red), nuclei (blue) and TUNEL positive DNA fragments (green).
Download figure:
Standard image High-resolution image3.8. Washout of PNIPAAm-co-rhodamin
In order to detect residues of PNIPAAM inside the microtissue we generated a rhodamine labeled PNIPAAm variant. Encapsulation of the cells with PNIPAAm-co-rhodamine resulted in bright red fluorescent capsules (not shown). MSCs were encapsulated and after 24 h the PNIPAAm-co-rhodamin shell was removed by washing at room temperature. After further culture for another 24 h at 37 °C the microtissues were sliced and analyzed for PNIPAAm residues. Fluorescent microscopy revealed inclusions of PNIPAAm-rhodamin entrapped inside the microtissues (figure 8).
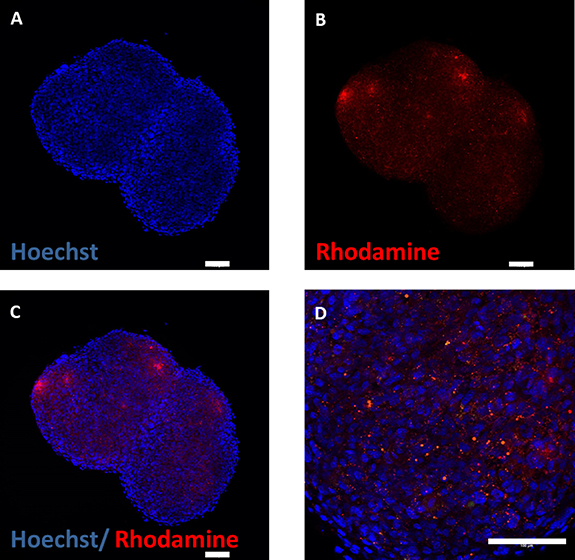
Figure 8. Microtissues were generated from MSCs by encapsulation in PNIPAAm-co-rhodamine. The PNIPAAm shell was washed off for 10 min at room temperature. After 24 h additional culture at 37 °C microtissues were analyzed for residues of PNIPAAM (red fluorescent). Nuclei were stained with Hoechst dye (blue). Scale bar 100 µm.
Download figure:
Standard image High-resolution image3.9. PNIPAAm thermo-shrinkage confines cells to small volumes
When counting the numbers of droplets generated in the microfluidic system, we estimated a production rate of 28 droplets per minute at a flow rate of 25 µl min−1 resulting in an average volume of 0.89 µl per droplet, equivalent to a sphere with a diameter d = 1.19 mm. To calculate the size of the droplet, the formula for sphere volumes was applied and resolved for the radius:
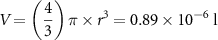
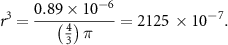
The calculation results in a radius of 0.005 97 dm. This corresponds well with the channel diameter of the microfluidics chip (1.3 mm). When injecting PNIPAAm solution without cells into the microfluidics chip and heating above the LCST, spheroids were generated and size of the spheroids was estimated. Most of the spheroids fall within the range of 695–740 µm. With a mean diameter of 718 µm, the volume of the spheroids was calculated as 0.194 µl. After 4 h the PNIPAAm spheroids shrunk to 490–549 µm, corresponding to a volume of 0.062–0.087 µl. It can be concluded that the volume was reduced by about 2.7-fold during the shrinking process. When this volume change is extrapolated to the density of cell suspensions in experiments where cells are encapsulated, the cell density increases from 1 × 10⁷ cells ml−1 to about 2.7 × 10⁷ cells ml−1.
4. Discussion
In the present study, we demonstrate a novel technology for scalable generation of (cardiac) microtissues within 24 h. The polymer PNIPAAm was used to reversibly entrap cells in a shrinking shell of polymer. Changes in the temperature within a physiological range allowed for packing and unlashing of the cells, respectively. As a proof-of-concept, single-cell suspensions of mesenchymal cells and miPSC-CMs were combined into functional cardiac microtissues that showed autonomous contractions, regular APs and progressing sarcomere organization. The novel technology markedly improves current methods of cardiac microtissue generation commonly relying on either small volume cultures (hanging drops) or specialized multiwell plates such as V-bottom plates.
The microfluidics setup employed in this study generated homogenous PNIPAAm spheroids either in the presence or absence of cells. It could be estimated that the diameter of the PNIPAAm spheroids that form during heating of aqueous droplets of PNIPAAm solution above the LCST is significantly smaller than the diameter of aqueous droplets. After 4 h of maturation, the volume of the PNIPAAm spheroids was reduced 2.7-fold as compared to the initial droplet volume. We assume that PNIPAAM starts to precipitate starting at the water-oil interface in the microfluidics system (figure 9 panel (A)), resulting in an interwoven mesh of solid PNIPAAm fibers. While the temperature gradient in the droplet causes more and more PNIPAAm to convert into the insoluble form, the mesh starts shrinking from the outside of the droplet. This is explained by the expulsion of water from the hydrophobic polymer network. When cells are added to the system, the collapsing polymer network acts as a fishing net and condenses the cell suspension. It was found that 24 h of encapsulation are compatible with cell viability as indicated by the stable cell count of MSCs and miPSC-CMs, calcein staining and low frequency of dead nuclei. Moreover, substantial expansion of encapsulated renal carcinoma cells was documented. Longer incubations in the polymer shell resulted in a significant reduction of viable cell counts and can be explained by the space limitations inside the capsule or impaired nutrient and oxygen supply or both. It is advisable to test the optimal encapsulation period (also below 24 h) for individual experimental settings.
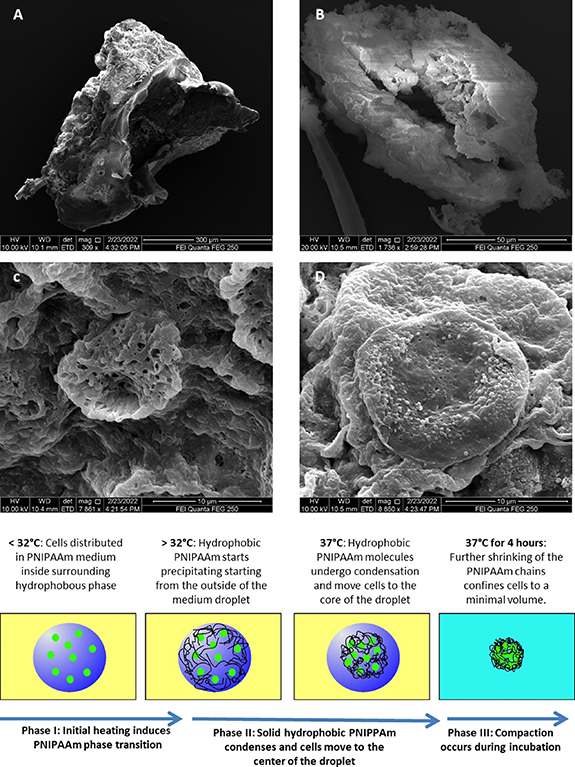
Figure 9. Scanning electron microscopy and proposed mechanism of PNIPAAm based cell encapsulation and microtissue formation. Scanning electron microscopy of torn PNIPAAm capsules (A), (B) and high power magnification of the porous surface structure of the polymer (C). Panel (D) displays a cells sticking to the polymer. Bottom panel: hypothetic mechanism of the PNIPAAm encapsulation technology: aqueous droplets of PNIPAAm solution (blue) contain dispersed single cells (green) in a continuous flow of hydrophobic rapeseed oil (yellow). Heating above the LCST induces phase transition of PNIPAAm and formation of networks of insoluble PNIPAAm fibers. With increased incubation time the PNIPAA fibers form a collapsing hydrogel network that concentrates the cell suspension inside the hydrogel by about 2.7-fold.
Download figure:
Standard image High-resolution image
The proposed mechanism (figure 9, bottom panel) shows a potential explanation why PNIPAAm encapsulation generates homogenous and spherically shaped microtissues in short time intervals, while alginate-based methods fail to produce comparable effects. Although cell encapsulation has been widely applied using alginate, there is no comparable report of rapid cardiac microtissue generation available. A potential explanation is the lack of volume reduction during encapsulation when alginate is employed. Alginate capsules confine cells to isolated entities without altering the cell density. As a result, cells tend to aggregate into sub-capsule size cell clumps, but fail to form a single compact aggregate.
Electrophysiologically, PNIPAAm derived microtissues showed typical AP properties of immature fetal CMs with clear signs of maturation between 48 h and 14 days. Murine embryonic CMs show a decrease in APD50 and APD90 between embryonic day 8–10 and two weeks postpartum [30]. In our study APD50 and APD90 in PNIPAAm cluster decreased steadily from 48 h to 15 days cluster (table 1). Quality of CMs in PNIPAAm cluster seemed to degrade on day 15. Amplitude and upstroke velocity dropped between day 8 and day 15 strongly. Simultaneously, the standard error increased for most parameters, indicating higher variability in cell healthiness. Furthermore, successful AP measurements attempts dropped from 73.3% on day 8 to only 20.1% in 15 days old clusters. Taken together 15 days of incubation seem to be too long to ensure a high quality of CMs within the microtissues.
This is in line with a previous work on purified clusters of murine embryonic stem cell derived CMs [31]. These clusters lost their contractile activity with prolonged culture duration and on day 22 after onset of differentiation no organized sarcomeres were found [31]. The iPS-CMs that were used for encapsulation in the present study were on day 14 of differentiation. We found intact electrophysiology 24 and 72 h after release from the PNIPAAm capsules. This means that the cells were 14 days after start of differentiation from pluripotent cells plus 1 day in PNIPAAm plus 1–3 days in culture. This results in an age of 16–18 days counted from the day of initiation of stem cell differentiation. However, 7 days and 15 days after encapsulation cells are 22 and 30 days old. In conclusion, microtissues studied here perform better and keep their contractility longer than pure clusters of CMs. However, the size of the microtissues may be too excessive to support optimal cell survival and the occurrence of apoptotic cells supports this interpretation. Furthermore, it is known that the mechanical properties of the extracellular matrix are of key importance for long-term performance of CMs [31]. Therefore, lack of sufficient matrix support could serve as a further explanation for quality loss observed in old microtissues.
To compare PNIPAAm capsule-derived microtissues with other methods of cultivation, hanging drop cluster were produced and AP measurements were performed after 48 h and 72 h. Hanging drop cluster showed as expected AP properties of immature CMs to a large extent. However, in comparison to the PNIPAAm cluster, hanging drop cluster showed inferiority of AP quality already after 48 h. AP measurements revealed lower amplitude (p = 0.026) and MDP (p = 0.01) and AP shape showed higher variability without classification into defined AP subtypes (pacemaker, atria or ventricular like). Notably, after 72 h hanging drop cluster showed signs of degradation comparable to PNIPAAm cluster after 15 days. The success rate of AP measurements rapidly decreased from 63.5% at 48 h cluster to 27% in 72 h cluster. Most likely, this result is caused by the high number of cells used per hanging drop as the cell number was adapted to the number of cells in PNIPAAm capsule-derived microtissues. In conclusion, the PNIPAAm method provides scientists with more freedom to increase the starting cell number in microtissues while hanging drop based methods are more limited in this respect.
A potential advantage of the PNIPAAm based method compared to other strategies is the surface structure of the microtissues: shortly after release from the PNIPAAm shell the surface of the microtissue appears rugged. This can be explained by the formation of dense polymer networks (see figure 9(B)) that prevent formation of a surface tension-driven smooth surface of the microtissues. We speculate that the rugged surface structure results in improved microtissue-microtissue and microtissue-native tissue interactions in some applications such as 3D printing or transplantation.
Cardiac microtissues generated in this study not only show rhythmically autonomous contractions, but also further demonstrate a nascent sarcomere structure of immature CMs that show signs of increasing sarcomeres structural organization within only two days in culture. A trend to CM maturation of our encapsulated cardiac micro tissue is in line with the electrophysiological data that demonstrates a significant increase in upstroke velocity within two days of microtissue culture.
As a limitation of the study we found that PNIPAAm is not rapidly removed from the microtissues by a short washing period at room temperature. While the capsules dissolved within seconds, residues of PNIPAAm remained inside the microtissues. This problem can be addressed in the future by two strategies: firstly, the washing period at low temperature can be prolonged and microtissues can be washed under continuous agitation. Secondly, modifications of PNIPAAm engineered for better biocompatibility and biodegradability can be used [32, 33]. A further limitation is the limited scalability of the process in its present form because cells show a tendency to sediment with gravity in the reservoir prior to encapsulation. Moreover, the setup does not allow oxygen supply to the cell reservoir. Engineering of a stirred and oxygen supplied cell reservoir could solve this problem in the future.
Altogether, we demonstrate, for the first time, an innovative method based on microfluidic PNIPAAm encapsulation. The method is robust and sufficient to generate viable and functional cardiac microtissues with physiological CMs function and a tendency toward earlier CMs maturation. The microfluidics-based PNIPAAm encapsulation introduced in this study allow for combining iPSC-CMs and MSCs; in general, the cellular composition of the microtissues is freely variable and only depends on the researcher's requirements. Therefore, the technology will be easily extended to include endothelial cells and further cell types as well. Notably, our approach is not only restricted to the cells that have been used in this study, but can be applied to any cell type(s) of choice.
Acknowledgments
We thankfully acknowledge financial support by the European Fund for Regional Development and the State of North Rhine-Westphalia grant no. EFRE-0801775, the Marga and Walter Boll Stiftung (Kerpen, Germany) and the German Research Foundation. We thank Dr Marek Molcanyi for help with the design of figure 1(F). The microfluidics part was designed and produced at the central workshop of the medical faculty, Cologne by Oliver Feierabend, Hans-Josef Reimer, Robert Schumacher, Cedric Wolff and Kristina Triller.
Data availability statement
The data that support the findings of this study are available upon reasonable request from the authors.