

Abstract
Efficient delivery of oxygen and nutrients to tissues requires an intricate balance of blood, lymphatic, and interstitial fluid pressures (IFPs), and gradients in fluid pressure drive the flow of blood, lymph, and interstitial fluid through tissues. While specific fluid mechanical stimuli, such as wall shear stress, have been shown to modulate cellular signaling pathways along with gene and protein expression patterns, an understanding of the key signals imparted by flowing fluid and how these signals are integrated across multiple cells and cell types in native tissues is incomplete due to limitations with current assays. Here, we introduce a multi-layer microfluidic platform (MμLTI-Flow) that enables the culture of engineered blood and lymphatic microvessels and independent control of blood, lymphatic, and IFPs. Using optical microscopy methods to measure fluid velocity for applied input pressures, we demonstrate varying rates of interstitial fluid flow as a function of blood, lymphatic, and interstitial pressure, consistent with computational fluid dynamics (CFD) models. The resulting microfluidic and computational platforms will provide for analysis of key fluid mechanical parameters and cellular mechanisms that contribute to diseases in which fluid imbalances play a role in progression, including lymphedema and solid cancer.
Export citation and abstract BibTeX RIS
1. Introduction
The transport of nutrients, cells, and waste necessary to sustain tissue development and homeostasis requires an intricate and complicated balance of fluid flows through and among tissue structures [1–4]. The direction and magnitude of these flows are regulated by fluid pressures that vary significantly in space and time even within a single tissue [5, 6], and imbalance in pressure and resultant flow leads to net accumulation of fluid that can have wide-ranging pathophysiological effects from edema to cardiac failure [7]. Importantly fluid flow not only impacts the transport of cells and molecules, but also applies fluid mechanical stresses to cells, extracellular matrix (ECM), and other tissue structures. Through extensive studies into the effects of hemodynamic stresses on vascular endothelial cells, a growing body of work has begun to elucidate cellular and molecular fluid stress sensing mechanisms and their contribution to blood vascular development, homeostasis, and disease [8–10]. Yet, the role of fluid transport and associated forces in the development and function of other tissues remains less clear, in part due to a lack of experimental systems that enable the controlled application of physiologic fluid pressure and flow to cells in tissues with native physiologic architecture and mechanical properties.
As recently reviewed [11, 12], a number of microfluidic models have been created to address the shortcomings of conventional platforms developed to investigate key cellular processes and signaling pathways that govern the cellular response to fluid flow. These conventional assays include the transwell assay (2D, in vitro) [13], isolated vessel assay (3D, ex vivo) [14], and fluorescent tracer injection assay (3D, in vivo) [15, 16]. While such platforms have provided key insights into signaling pathways that are modulated by hemodynamic signals, limitations, including artificial culture substrates in vitro and lack of control over microenvironmental parameters in vivo, have led to the development of microfluidic devices for applying fluid flow to cultured cells. Advantages afforded by microfluidic approaches include the patterning of 3D cellular microenvironments [17, 18], the incorporation of microstructures to enable precise control over fluid pressure [19, 20], the fabrication of permeable membranes to separate cells and measure fluid transport across cellular monolayers [21], and the application of simultaneous mechanical and chemical stimuli [22, 23] to primary human cells or cell lines. Recently, by merging advances in biomaterials and tissue engineering with microfluidic fabrication techniques, devices have been developed that provide precise control over fluid pressures and flows applied to cells cultured in a 3D microenvironment [11].
Pioneered by the Tien Lab [24], the use of microfluidic devices to cast hydrogels around removable, cylindrical templates, subsequently forming channels that can be seeded with endothelial and epithelial cells to create perfusable vessels and ducts, has facilitated the study of the effects of physiologic pressures and flows on cells in native architectures cultured on or in physiologic ECM-derived matrix [12]. Such platforms have been implemented to study the effects of luminal flow on lymphatic vasculature [25], to define key signaling pathways governing blood vascular barrier function in response to hemodynamic shear stress [26, 27], and to determine the role of interstitial fluid pressure (IFP) and flow on tumor cell invasion [28]. However, these approaches have been designed to study the effects of either luminal flow or interstitial flow independently, even though in vivo these flows are coupled [29, 30] and modulate shared signaling pathways.
Here, we introduce the multi-layer microfluidics for luminal, transmural, and interstitial flow (MμLTI-Flow) platform that creates parallel blood and lymphatic vessels embedded within continuous 3D ECM with dimensions relevant to natural microvasculature. The device provides independent control of blood, lymphatic, and interstitial pressures through the incorporation of a permeable membrane that separates a 3D hydrogel containing cell-laden microchannels in the lower device layer from an open upper chamber that enables regulation of the interstitial and luminal pressures. We demonstrate the ability to modulate luminal and interstitial pressures and to establish transmural pressure gradients to drive flow through the vessel lumens (blood and lymphatic luminal flow), into and out of blood and lymphatic vessels (transmural flow), and through the 3D hydrogel (interstitial flow). We validate key experimental results with a 3D CFD model, and we demonstrate the ability to co-culture blood endothelial and lymphatic endothelial cells within the platform. Importantly, we demonstrate that input pressures modulate both luminal and interstitial flow, reflecting the native tissue microenvironment where luminal, transmural, and interstitial flows are coupled.
2. Methods
2.1. Microfluidic device fabrication
A 3D microfluidic device was configured according to the strategy depicted in figure 1, modified from a fabrication protocol we reported previously for a simpler device that described the formation of single, human umbilical vein endothelial cells (HUVEC)-lined vessels embedded in collagen hydrogels [26]. Detailed fabrication and assembly methods of the MμLTI-Flow platform are provided in the supplementary information (available online at stacks.iop.org/BF/14/025007/mmedia), while a brief overview is provided here. A master mold consisting of SU-8 epoxy, patterned on silicon, was fabricated using conventional photolithography. SU-8 2150 (Kayaku Advanced Materials, Westborough, MA) solution was deposited on 3 inch silicon wafers (University Wafer, Boston, MA) and spun at 1960 RPM to generate a uniform 300 μm thick layer. After the spin coating, the wafer was baked at 65 °C for 8 min and 95 °C for 65 min. UV light (390 mJ cm^-2 at a wavelength of 365 nm) was exposed on the wafer through a transparency mask (FineLine Imaging, Colorado Springs, CO) using a mask aligner (SUSS Microtec, Garching, Germany) for 39 s for SU-8 crosslinking. Separate masks are used for the pressure regulatory layer and for the microchannel layer (figure S1). The crosslinked SU-8 was then baked at 65 °C for 5 min and 95 °C for 21 min and developed for 21 min using propylene glycol monomethyl ether acetate (PGMEA, Millipore Sigma, Burlington, MA).

Figure 1. Mμlti-Flow platform design and device structure. (a) The microfluidic device was designed to mimic the native transport unit of solid tissues, including a blood vessel, interstitial tissue and ECM, and a lymphatic vessel. (b) The assembled Mμlti-Flow platform enables control of blood, interstitial and lymphatic pressure through fluidic ports and a central reservoir. Spatial gradients in pressure drive luminal flow through the lymphatic microvessel (green arrow), luminal flow through blood microvessel (red arrow), and interstitial flow through the collagen gel (black arrow). (c) An image of the Mμlti-Flow platform bonded to a glass slide cut to 28 mm in length, comprised of (d) an interstitial layer, a polycarbonate (PC) membrane, and the microchannel layer. (e) Top view of Mμlti-Flow platform demonstrating port geometry. The platform has three types of ports: gel ports allow injection of collagen into the assembled device and blood channel ports and lymphatic channel ports supply culture medium to engineered microvessels and allow control of blood and lymphatic pressure. (f) Cross-sectional view of the platform to demonstrate pressure modulation, and (g) orthogonal cross-sectional view of collagen hydrogel and microchannels in which HUVECs are cultured to form the blood vessel and HDLECs are cultured to form the lymphatic vessel.
Download figure:
Standard image High-resolution imageThe final MμLTI-Flow device assembly consists of a glass coverslip as a hard support and to allow imaging with an inverted microscope, a microchannel layer, and the pressure regulatory layer (figure 2). To form the layers, a 10:1 ratio of polydimethylsiloxane base:crosslinker (PDMS, Sylgard 184, Dow-Corning, Midland, MI) was mixed and degassed under house vacuum for 1 h prior to filling the respective silicon master molds (see supplementary methods for details). After cleaning with isopropanol and plasma treatment (figure S1), a polycarbonate (PC) membrane (11 μm thick, pore size 1.0 μm; Sterlitech, Kent, WA) was bonded to the microchannel layer after coating the membrane with a 1% (3-glycidoxypropyl)triethoxysilane (Millipore Sigma) solution in deionized (DI)-H2O and the surface of the microchannel layer with 1% (3-aminopropyl)triethoxysilane (Millipore Sigma) solution in DI-H2O and incubating for 2 h at room temperature. After cleaning the glass coverslips, final devices were assembled by bonding glass, the microchannel layer, and the pressure regulatory layer and baking at 60 °C for 1 h. The assembled devices were then plasma treated for 1 min, and 2 mg ml−1 dopamine hydrochloride (Millipore Sigma) in 10 mM Tris buffer pH 8.5 (bioWORLD, Dublin, OH) was added to the gel ports to fill the region that will contain the collagen hydrogel (figure S2). Following a 2 h incubation, the dopamine hydrochloride was aspirated and the chamber was washed once with DI water. The devices were then autoclaved at 121 °C, 1 atm for 30 min wrapped in aluminum foil and dried in an oven at 60 °C for 4 h.
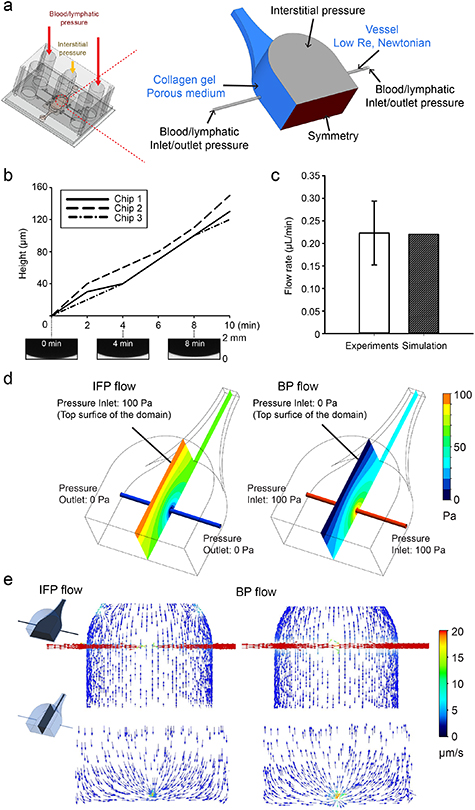
Figure 2. Computational simulation of fluid transport within Mμlti-Flow devices. (a) Porous media and low Re, Newtonian constitutive laws (blue) are used to model flow through the collagen hydrogel and microchannels, respectively. Fluid pressure boundary conditions (black) are set to reflect the experimental conditions, and for these simulations a symmetry condition (red) was applied at the device midplane. (b) Volumetric flow rate for IFP flow was measured by tracking the height of the fluid column in the outlet blood/lymphatic port. The height of the fluid column increased linearly during 10 min under 100 Pa of interstitial pressure and 0 Pa blood pressure, resulting in an average flow rate of 0.22 ± 0.07 μl min−1. (c) By iteratively simulating the IFP flow conditions, an effective collagen hydrogel permeability (PD) of 1.78 × 10⁻¹⁴ m2 was determined to yield similar volumetric flow rates between experiment and simulation. (d) Using this permeability value, local fluid pressures were determined computationally, and steep gradients in fluid pressure were found near the microchannels for both IFP and BP flow. (e) Fluid velocity vectors for IFP and BP flow demonstrate fluid velocity gradients near the microchannel wall that become more uniform within the hydrogel far from the microchannel.
Download figure:
Standard image High-resolution image2.2. Hydrogel preparation and patterning of cylindrical voids
Prior to introducing the hydrogel into the device, 160 µm diameter stainless steel acupuncture needles (Seirin America, Weymouth, MA) were coated with gelatin to facilitate removal from device without damage to the hydrogel. Needles were added to a 15 ml tube containing 8 ml of 5% gelatin derived from porcine skin (Millipore Sigma) in DI-H2O, pre-warmed to 37 °C. After adding the needles, the solution was returned to a 37 °C water bath for 15 min. The needles were then transferred to an empty 15 ml tube, cooled at −20 °C for 20 min, and then inserted into microfluidic devices.
Reconstitution buffer (RB) was prepared by dissolving 1.2 g of NaHCO3 and 4.8 g of HEPES in 50 ml DI-H2O, and sterile filtering. High concentration type I collagen from rat tail in acetic acid (8–11 mg ml−1, depending on stock; Corning) was diluted in equal volumes of sterile filtered 10× Dulbecco's Modified Eagle's Medium (DMEM) (with 4,5000 mg l−1 glucose and L-glutamine, without sodium bicarbonate; Millipore Sigma) in DI-H2O and RB, and 1× PBS was added to bring the final concentration of collagen in total solution to 4 mg ml−1. The solution was titrated to a pH of 8.0–8.5 with 1N NaOH. The final solution was added to devices through the gel filling ports. After 1 h at 37 °C, cell culture media was added to each port prior to removing the needles from the device (figure S2). After removal of the needles, vacuum grease (Millipore Sigma) was used to seal the needle guides, and devices were incubated 1–3 days prior to seeding, depending on cell availability.
2.3. Cell culture and seeding
HUVEC (Lonza, Basel, Switzerland) were maintained in endothelial cell growth medium-2 (Lonza), passaged after reaching 80%–90% confluency, and used between passage 2 and 9, consistent with manufacturer recommendations. Human dermal lymphatic endothelial cells (HDLECs; Promocell, Heidelberg, Germany) were maintained in endothelial growth medium MV-2 (Promocell) and used between passage 2 and 9. For time-lapse imaging, HUVECs were transduced with pLenti.PGK.LifeAct-GFP.W (LifeAct-GFP; AddGene plasmid #51010). LifeAct-GFP was co-transfected with pSPAX2 (Addgene plasmid #12260) and pMD2.G (Addgene plasmid #12259) into HEK-293T cells using calcium phosphate transfection. After 48 h, viral supernatants were collected, concentrated using PEG-IT (System Biosciences, Palo Alto, CA) viral precipitator and resuspended in PBS. HUVECs were transduced in growth medium by adding 2 μl of concentrated lentivirus to 75 000 cells per well of a 6 well plate 30 min after plating, and medium was replaced the next day. At 48 h after transduction, transduction efficiency was determined by immunofluorescence.
To form blood and lymphatic vessels on chip, cells were grown to confluency, treated with 0.05% (wt/vol) trypsin-EDTA (Thermo Fisher), and resuspended in growth medium to a concentration of 7.5 × 10⁶ cells ml−1. After removing medium from ports in the microfluidic chip, 55 μl of the HUVEC and/or HDLEC cell suspension was introduced into inlet blood and/or lymphatic ports, respectively. After observing the cells flowing through the blood and/or lymphatic channel, 45 μl of cell suspension was added to the outlet port. Devices were then placed in tissue culture dishes and incubated at 37 °C and 5% CO2 atmosphere for 1 h, while checking confluence and inverting as necessary every 10 min. The cell suspension was then aspirated, and 100 μl of culture media was added to media ports. Devices were then placed on a laboratory rocker in a humidified incubator at 37 °C and 5% CO2, with the rocker set to oscillate at ±30° with 5 cycles min−1.
2.4. Immunofluorescence
To characterize the morphology of HUVECs and HDLECs within the microfluidic platform, devices seeded with both cell types were fixed 48 h after seeding with 4% paraformaldehyde in PBS containing calcium and magnesium (PBS++) at 37 °C for 15 min. After rinsing twice with PBS++, devices were left on a laboratory rocker for 24 h in PBS++ to wash. Cells were then permeabilized with 0.1% Triton X-100 (Millipore Sigma) for 10 min at room temperature and nonspecific antibody binding was blocked with 2% (w/vol) BSA in PBS++ for 24 h at room temperature. Primary antibodies against VE-cadherin (mouse, anti-human F-8; Santa Cruz Biotechnology) were diluted in 2% BSA in PBS++ (1:200, vol/vol) and applied overnight on a laboratory rocker at 4 °C. Devices were then rinsed three times over 1 h with PBS++, and secondary antibodies (goat, anti-mouse IgG conjugated to AlexaFluor-647; Thermo-Fisher Scientific) were diluted in 2% BSA in PBS++ (1:200, vol/vol) and applied to devices at room temperature for 2 h on a laboratory rocker before rinsing four times over 2 h with PBS++. F-actin was labeled with rhodamine phalloidin (Thermo Fisher), and the nucleus was labeled with DAPI (Thermo Fisher) diluted in PBS++ (1:200 and 1:1000, vol/vol, respectively) for 15 min at room temperature before rinsing three times over 30 min with PBS++. Images were acquired with an Olympus FV3000 laser scanning confocal (Olympus, Tokyo, Japan) with a 30× U Plan S-Apo N 1.05 NA silicone oil immersion objective (Olympus), and images were adjusted for brightness and contrast using ImageJ.
2.5. Vascular and lymphatic permeability
To determine the permeability of vascular and lymphatic vessels, we followed a process published previously [26]. Briefly, after culturing devices seeded with HUVECs and HDLECs, 70 kDa Texas Red dextran (Thermo Fisher) was introduced into growth medium at a concentration of 12.5 μg ml−1, and a multichannel pipette was used to add solution simultaneously to HUVEC and HDLEC channels to avoid transmural pressure gradients. Diffusion of dextran was imaged in real time with an Olympus FV3000 laser scanning confocal microscope with a 10× U Plan S-Apo 0.4 NA air objective (Olympus), and the resulting profile of dextran intensity as a function of time was fitted to a dynamic mass-conservation equation as described previously [26, 27]. The coefficient of diffusive permeability (PD) was defined by J = PD (Cvessel − CECM), where J is the mass flux of dextran, and Cvessel and CECM are the concentrations of dextran within the vessel and perivascular/lymphatic ECM, respectively.
2.6. Hydrogel characterization
To characterize fluid velocity profiles as a function of input pressures, we performed modified fluorescence recovery after photobleaching (FRAP) using an Olympus FV3000 laser scanning confocal microscope with a 4× U Plan S-Apo 0.16 NA air objective (Olympus). Fluorescent dextran (70 kDa, FITC; Thermo Fisher) was added to growth medium at a concentration of 20 μg ml−1, introduced into devices by adding to all media ports, and incubated overnight at 37 °C. Hydrostatic pressure gradients, as detailed in the sections 3 and 4, were applied by adding fresh 70 kDa FITC dextran solution to reservoirs supplying fluid to the interstitial compartment and/or the microchannels to mimic physiologic pressures. Fluid velocity direction and magnitude were determined by bleaching circles 245 μm in diameter with a 4× objective using a 488 nm, 20 mW laser diode at 38% power. Images of the bleached region were then acquired with a 4× objective every 10 s for 180 s, and a custom Matlab script was used to track displacement of the center of mass of the bleached region as a function of time to determine velocity direction and magnitude.
To measure the overall hydraulic permeability of devices with and without vessels, we established a pressure gradient from the interstitial chamber to vessel outlets and determined the volumetric flow rate using timelapse confocal microscopy. One of the two vessel channels was formed in the device and hydrogel, and the other channel was blocked with PDMS to simplify analysis. Fluorescent dextran (70 kDa Texas Red; Thermo Fisher) was dissolved in growth medium or PBS at a final concentration of 20 μg ml−1 and added to devices with or without cells, respectively. Medium was removed from inlet and outlet vessel ports, and a small volume (20 μl) of dextran-containing medium or PBS was added to the inlet port to perfuse the channel and provide a baseline fluorescence signal for hydrostatic measurements. Subsequently, dextran-containing medium or PBS was added to the interstitial reservoir to induce a net pressure gradient from interstitial reservoir to blood channel outlet. Z-stacks of the vessel outlet port spanning from the glass substrate to a height of 2 mm were acquired at 10× magnification using a 10× U Plan S-Apo, 0.4 NA air objective on a laser scanning confocal microscope (Olympus FV3000) in resonant-scanning mode every 2 min for a total of 10 min. The height of the fluorescent dextran in the left outlet port was used to calculate outlet volume as a function of time and thus to determine volumetric flow rate.
2.7. Computational model
To provide spatial maps of fluid pressure and flow as a function of inlet pressure, we developed a 3D steady-state model using the FLUENT module of ANSYS (Ansys, Inc., Canonsburg, PA). The computational domain consisted of the collagen gel compartment and lumen channels of the microvessel layer and the pressure regulatory layer. The model geometry was imported from the AutoCAD (Autodesk, San Rafael, CA) drawings used to generate the photomasks for device fabrication, and the mesh was built using Gambit (Ansys, Inc.) (figure S3). To model open channels, including vessels and the pressure regulatory layer, conservation of mass (table 1) the Navier–Stokes equation were used (table 1, fluid density 998.2 kg m−3, fluid viscosity 1.002 × 10⁻³ Pa s). The Reynolds number was found to be less than 10−3 for all experiments and simulations, and thus inertial terms in the Navier–Stokes equation were negligible. For the collagen hydrogel region, a Darcy source term was added to the low Reynolds number Navier–Stokes equation, which then reduced to Brinkman's equation for flow through a porous medium (table 1). The permeability of the porous region ranged from 1.25 × 10⁻¹² to 1.25 × 10⁻¹⁴ m2 based on experimental measurements (see sections 3 and 4), and a separate test case that did not include a porous media in the collagen region was also simulated (figure S4). No-slip wall boundary conditions were applied for all wall boundaries (collagen-PDMS and open channel-PDMS interfaces), and a symmetry boundary condition was applied at one face of the domain (figure 2(a)) to reduce computational burden.
Table 1. Constitutive equations for CFD.
| Equation name | Equation | Variable description |
|---|---|---|
| Conservation of mass |
| ρ, fluid density |
 time time | ||
 is the fluid velocity is the fluid velocity | ||
| Navier–Stokes equation |
| p, fluid pressure |
 fluid stress tensor fluid stress tensor | ||
 acceleration due to gravity acceleration due to gravity | ||
 source term source term | ||
| Brinkman's equation |
| κ, PD of collagen |
Two principal test cases were developed to verify the function of the chip. For IFP flow, 100 Pa of pressure was applied to the interstitial reservoir as a pressure inlet boundary condition while 0 Pa pressure outlet boundary conditions were applied at both ends of the microchannels. For blood pressure-driven flow (BP flow), blood pressure was simulated using 100 Pa of pressure inlet boundary conditions at both ends of the microchannels and an atmospheric pressure outlet boundary condition (0 Pa) was applied to the interstitial compartment.
To relate local fluid velocities as measured by FRAP to simulation results, the model was modified to reflect the experimental boundary conditions applied in the FRAP experiments. Four independent boundary conditions were applied to the computational domain (figure S6) to simulate experimental pressures in table S1: (a) blood pressure (B), (b) lymphatic pressure (L), (c) interstitial pressure (I), and (d) symmetry. The permeability of the collagen hydrogel (4.44 × 10⁻¹⁴ m2) was determined by experiment (sections 3 and 4). The coordinates of the bleached regions from the FRAP experiments were used to calculate local fluid velocity vectors from simulation results (figure S7).
3. Results
3.1. A multi-layer microfluidic platform for modeling luminal and transmural transport
To enable independent control of blood and lymphatic inlet and outlet pressures and of IFP (figures 1(a) and (b)), the MμLTI-Flow device was fabricated by bonding three interconnected layers (figures 1(c) and (d)): (a) a microchannel layer containing two engineered microvessels embedded within a collagen scaffold with access ports at the two inlets and two outlets, (b) a pressure regulatory layer with reservoirs for regulating IFP and microvessel pressure, and (c) a porous PC membrane to provide physical separation between the two layers without impacting the IFP.
The microfluidic platform was fabricated in two parts from independent silicon molds patterned using photolithography (figure S1) and bonded to a glass support in a vertical stack with the PC membrane separating the top and bottom PDMS layers (figures 1(c) and (d)). The top, pressure regulatory layer measures 28 × 24 × 12 mm overall and contains Φ 4 mm inlet and outlet ports for introducing fluids through the microvessels in the underlying layer and a fluid reservoir for controlling the IFP measuring 8 × 4 × 15 mm (figures 1(d)–(f)). Between the pressure regulatory layer and the microchannel layer is a 7 × 12 × 0.011 mm PC membrane which enhances the physical integrity of the 3D structure without impeding the fluid transport (figure 1(d)). The bottom, luminal microchannel layer includes a 8 × 4 × 1 mm gel chamber, which contains 4 mg ml−1 of collagen gel, transversed by two microchannels with diameters of 160 μm (figures 1(e), (f) and S1) that serve as templates for the blood and lymphatic vessels.
3.2. Computational model of fluid transport within MμLTI-Flow devices
To confirm that the MμLTI-Flow platform reflects physiologic fluid transport through vascularized tissue, we developed a multicomponent 3D finite volume method (FVM) model of the device using a porous media constitutive model for the collagen hydrogel and a low Re, Newtonian fluid constitutive model for the vessel lumens and the interstitial layer (figure 2(a)). To characterize the function of the device, we established two computational test cases: interstitial pressure-driven flow (IFP flow) and blood pressure-driven flow (BP flow). In addition to characterizing the function of the device, IFP flow was used to determine the effective hydraulic permeability of the collagen hydrogel, a critical parameter relating applied pressure to interstitial fluid velocity [31, 32].
We used an iterative process comparing volumetric flow rates determined by simulation and experiment to determine the effective permeability of 4 mg ml−1 collagen hydrogels within MμLTI-Flow devices. To determine the volumetric flow rate within the device, culture medium supplemented with 70 kDa fluorescent dextran was added to all ports of the device and allowed to equilibrate overnight. Dextran-containing medium was then added to the interstitial pressure layer to establish 10 mm H2O (≈100 Pa) interstitial pressure, and outlet ports (held at a reference 0 Pa) were imaged with confocal microscopy to determine the increase in the height of the fluid in the ports as a function of time (figure 2(b)). Using the known geometry of the port, a volumetric flow rate of 0.22 ± 0.07 μl min−1 was determined (figure 2(c)).
We then reconstructed the experiment using the finite element model of the device to determine the effective hydraulic conductivity and permeability of the collagen hydrogel within the device. Using an initial value from the literature [33] (10 mg ml−1 collagen hydrogel was measured to have a permeability of 10−15 m2), several permeability values were substituted into the interstitial domain of the FVM ranging from 1.25 × 10⁻¹² to 1.25 × 10⁻¹⁴ m2. An input pressure of 100 Pa was applied as a boundary condition at the interface with the interstitial channel, and vessel outlets were initially set at 0 Pa. The resulting volumetric flow rate was compared to experimental values measured in MμLTI-Flow devices containing 4 mg ml−1 collagen hydrogel. We found that a permeability of 1.78 × 10⁻¹⁴ m2 produced the same volumetric flow rate value as that obtained experimentally (figure 2(c)).
To determine how pressures applied at the device boundaries were translated throughout the device, we simulated IFP flow and BP flow and determined the pressure and fluid velocity vector fields within the device at steady state. For IFP flow, 100 Pa of pressure was applied to the interstitial reservoir as a pressure inlet boundary condition while 0 Pa pressure outlet boundary conditions were applied at both ends of the microchannels. For BP flow, blood pressure was simulated using pressure inlet boundary conditions as 100 Pa at both end of the microchannels, atmospheric pressure outlet condition (0 Pa) at the interstitial compartment. For both cases, the magnitude of the fluid pressure gradient varied throughout the hydrogel (figure 2(d)), and the pressure magnitude and gradient was strongly dependent on the presence of the porous collagen hydrogel (figure S4). We then investigated the velocity vector field distribution for each test case. In IFP flow, the average velocity in the collagen gel domain was 0.61 μm s−1, and the average fluid velocity in the microchannel was 154 μm s−1 (figure 2(e)). BP flow simulations demonstrated similar velocity magnitudes (average interstitial fluid velocity magnitude of 0.55 μm s−1 and microchannel velocity of 153 μm s−1), with the flow direction reversed from that induced using IFP flow (figure 2(e)).
Next, we further investigated the influence of permeability on fluid pressure gradient for both IFP and BP flows. For IFP flow, collagen hydrogels having permeability of 1.25 × 10⁻¹⁴ m2, 1.78 × 10⁻¹⁴ m2 and 10−15 m2 exhibited no noticeable difference in the fluid pressure gradient. Pronounced effect was only noted when permeability of the hydrogel was further increased to 1.25 × 10⁻¹² m2 (figure S5). Moreover, the pressure inside the channel was also noted to be governed by the permeability of the collagen hydrogels. High permeability resulted in increased levels of pressure inside the channel as compared to pressure magnitudes noticed across the channel embedded in less porous hydrogels. For BP flow, collagen hydrogels characterized with high permeability resulted in lower pressure magnitude inside the channels as compared to hydrogels having low permeability. Similar to IFP flow, no significant difference was noted in the fluid pressure gradient for hydrogels having permeability of 1.25 × 10⁻¹⁴ m2, 1.78 × 10⁻¹⁴ m2 and 10−15 m2 for BP flow as well. Marked difference was only exhibited when hydrogel porosity was further increased to 1.25 × 10⁻¹² m2 (figure S5).
3.3. Experimental characterization of fluid transport within MμLTI-Flow devices
To validate the computational model and to determine how applied pressures at the device boundaries relate to local fluid velocities, we used a modified FRAP method. We established four test conditions to test the ability to modulate interstitial, blood, and lymphatic pressure independently, and we measured fluid velocity magnitude and direction in the collagen gel near the lymphatic and vascular walls (table S1): (a) 0I0—interstitial pressure of 100 Pa and blood channel and lymphatic channel pressures of 0; (b) B00—blood channel pressure of 100 Pa, with interstitial and lymphatic pressure of 0 Pa to simulate inflamed, leaky vasculature in the presence of a functional draining lymphatic; (c) B0L—blood channel pressure of 100 Pa, interstitial pressure of 0 Pa, and lymphatic pressure of 50 Pa to simulate lymphatic hypertension; (d) BI0—blood channel pressure of 100 Pa, and interstitial pressure of 50 Pa, and a lymphatic pressure of 0 Pa to simulate the more normal tendency of the fluid to flow from the blood through interstitial tissue and drain through the lymphatics (figure 3(a)).
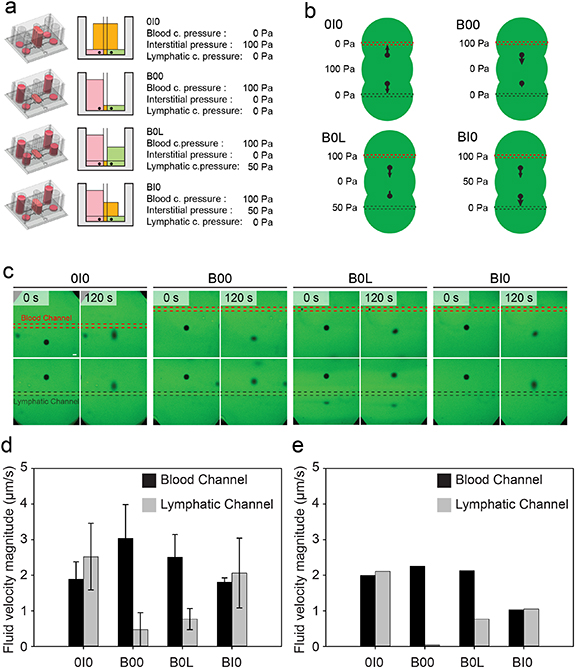
Figure 3. Measurement and simulation of local fluid velocity within the collagen hydrogel. (a) Overview of pressure conditions used to evaluate the function of the platform in recapitulating physiologic transport: (1) Interstitial fluid pressure (0I0), (2) Blood pressure (B00), (3) Blood and lymphatic pressure (B0L), and (4) Blood and interstitial pressure (BI0). (b) Overview of the experimental setup used to measure fluid velocity vectors for the four pressure conditions. Devices were hydrated with media containing FITC-conjugated dextran, and a laser diode was used to bleach circular regions that were then tracked over time to measure fluid velocity. (c) Representative confocal timelapse images of demonstrating displacement of photobleached FITC-conjugated dextran under each of the 4 pressure conditions. Images were taken every 5 s for 120 s to measure fluid velocity magnitude and direction (scale bar is 100 μm). (d) The average fluid velocity magnitude of photobleached dextran in proximity to the blood and lymphatic channels. (e) The magnitude of fluid velocity vectors computed at the centroid of the photobleached dextran at t = 0 s.
Download figure:
Standard image High-resolution imageTo measure fluid velocity, 70 kDa fluorescent dextran was added to all ports and allowed to equilibrate overnight. After establishment of each pressure profile by appropriately filling reservoirs in the pressure control layer, a laser scanning confocal microscope was used to photobleach two 245 μm circles, one 850 μm from the blood channel (Bdot) and one 850 μm from the lymphatic channel (Ldot). Bdot and Ldot were then imaged as a function of time (figures 3(b) and (c)). For the 0I0 group, the velocity magnitude of Bdot and Ldot were similar at 1.89 ± 0.49 μm s−1 and 2.52 ± 0.94 μm s−1 toward the blood and lymphatic channel, respectively. For B00, increased fluid velocity leaving the blood channel (3.04 ± 0.95 μm s−1) compared to the velocity entering the lymphatic (0.47 ± 0.47 μm s−1) was observed due to fluid accumulating in the interstitial chamber. As lymphatic pressure increased in the B0L condition, the fluid velocity exiting the blood channel and entering the lymphatic channel decreased (2.51 ± 0.63 μm s−1 and 0.77 ± 0.30 μm s−1, respectively). Finally, for BI0, the increased interstitial pressure resulted in an increased fluid velocity toward the lymphatic channel (2.06 ± 0.98 μm s−1) compared to the velocity leaving the blood channel (1.80 ± 0.12 μm s−1, figure 3(d)).
Following the process described above for determining the effective hydraulic permeability, we found the collagen permeability to be 4.44 × 10⁻¹⁴ m2, consistent with previously reported variations in permeability (figure S6) [33, 34]. Using this permeability value, we subsequently simulated the FRAP experiments in silico by applying the experimental pressure boundary conditions to the FVM model. We computed local velocity vector direction and magnitude at the x and y coordinates of the centroid of the bleached region (figure S6(b)), and overall, we found agreement between the simulated and measured velocities (figure 3(e)). We further found from the simulation results that these fluid velocity magnitudes were uniform along the length of the channel (figure S7).
3.4. Blood and lymphatic vascular cell phenotypes within MμLTI-Flow devices
MμLTI-Flow devices were seeded with HUVECs and lymphatic endothelial cell (LEC)s to form the blood vascular and lymphatic vascular channels, respectively (figure 4(a)). After 48 h of culture on a laboratory rocker to promote luminal flow and with the interstitial channel blocked to prevent transmural pressure gradients, immunostaining for VE-cadherin demonstrated irregular junction formation in LECs compared with the more continuous, smooth cortical staining in HUVECs, consistent with observations in vivo [35–37] (figure 4(a)). Interestingly, though both cell types were seeded into 160 μm diameter channels, HUVEC channels had reduced diameters when compared to LEC channels after 48 h (120 μm vs. 150 μm, figure 4(b)). To determine whether cells formed a confluent monolayer and barrier to transport, we measured the diffusive permeability of 70 kDa dextran across the HUVEC and LEC vessel walls using a multichannel pipette to simultaneously introduce media supplemented with dextran into the HUVEC and LEC vessels and subsequently tracking the transport of dextran with confocal microscopy (figure 4(c)). While both vessels presented a barrier to transport, the permeability of the lymphatic vessel was over 10-fold higher than that of the blood vessel (17.6 vs. 0.8 × 10⁻⁶ cm s−1, figure 4(d)).
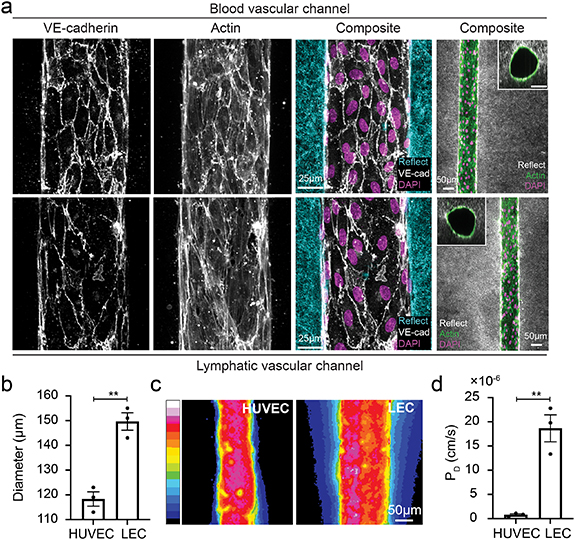
Figure 4. Characterization of microvessels within Mμlti-Flow devices. (a) Blood and lymphatic vascular channels were formed by seeding HUVECs and HDLECs, respectively, within channels formed in collagen hydrogels. Immunostaining of VE-cadherin, actin, and DAPI and confocal reflectance imaging (reflect) demonstrates confluent channels embedded within the hydrogel with distinct adherens junction structure between blood (top row) and lymphatic (bottom row) vessels. (b) Cells contract the collagen hydrogel resulting in a vessel diameter that is smaller in magnitude than the 160 μm channel formed during assembly of the devices. (c) 70 kDa fluorescent dextran extravasated from lymphatic vessel lumens at a higher rate than the blood vessel lumens, reflecting the (d) increased diffusive permeability of the lymphatic vessels (**p < 0.01, each data point represents an individual device).
Download figure:
Standard image High-resolution image3.5. Effects of interstitial pressure on blood vascular barrier function and structure
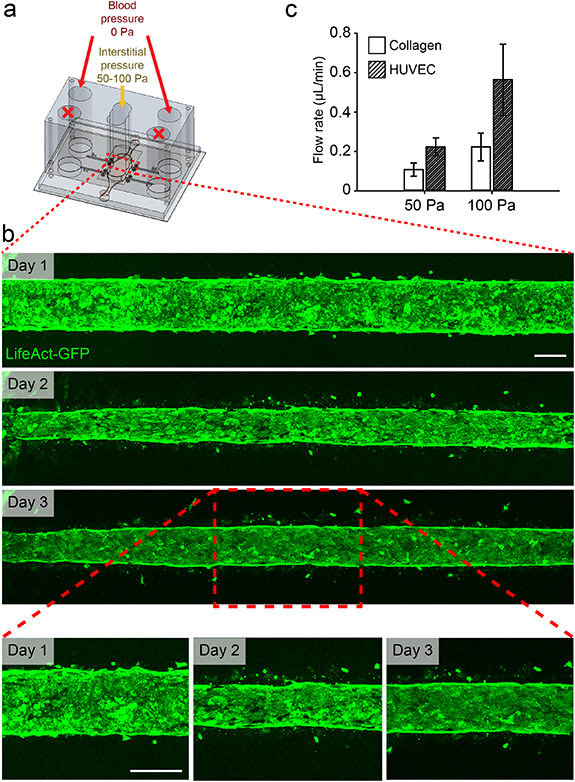
To determine how dynamic pressure gradients influence endothelial cell barrier function and morphology, we cultured MμLTI-Flow devices seeded with HUVECs engineered to stably express LifeAct-GFP on a laboratory rocker with the interstitial chamber open to atmospheric pressure. This setup allows dynamic transmural pressure gradients and flow, in addition to luminal flow. Imaging the LifeAct-GFP HUVECs demonstrated that, while the cells initially lined the channel in a confluent monolayer, after 24 h, cells repolarized to invade the collagen hydrogel (figure 5(b)).
Figure 5. Engineered microvessels subjected to elevated interstitial pressure and draining transmural flow. (a) Interstitial pressure was elevated relative to blood pressure to simulate interstitial hypertension. (b) HUVECs were stably transduced to express LifeAct-GFP to allow imaging of cytoskeletal dynamics in response to elevated interstitial fluid pressure. While vessels remained confluent throughout the course of the experiment, transmural flow induced a reduction in vessel diameter and invasion of cells into surrounding collagen hydrogel (scale bar 100 µm). (c) Volumetric flow rate was computed by measuring the change in volume at blood outlet ports over time. Channels lined with HUVECs demonstrated an increased volumetric flow rate when compared to unseeded channels (collagen).
Download figure:
Standard image High-resolution image
To determine whether the observed cell invasion was accompanied by changes in the overall resistance to transmural flow, we applied an interstitial pressure of 50 or 100 Pa to MμLTI-Flow devices with and without cells in the microvessels. We then followed the process used to determine the collagen permeability to calculate the volumetric flow rate in response to applied interstitial pressure. Interestingly, devices seeded with HUVECs demonstrated an increased volumetric flow rate at the outlet of the microvessel compared to devices without cells. The volumetric flow rate increases were 0.12 μl min−1 for 50 Pa (0.10 ± 0.03 for microvessels without cells compared to 0.22 ± 0.05 μl min−1 with cells), and 0.34 μl min−1 for 100 Pa (0.22 ± 0.07 for empty microvessels compared to 0.56 ± 0.18 μl min−1 with cells (figure 5(c)). Devices were fixed, stained, and imaged after applying 100 Pa pressure, and the microvessels remained confluent, with continuous actin and VE-cadherin staining (figure S8).
To ensure that this increased volumetric flow rate was not due to cell-mediated contraction of the collagen hydrogel and leaking at collagen-PDMS walls, we reduced the diameter of the central chamber of the pressure control layer to restrict interstitial flow to the center of the microchannels (figure S9). We observed similar increases in volumetric flow rate in the modified devices with microvessels containing HUVECs. The flow rates were 0.22 ± 0.05 (conventional) and 0.21 ± 0.06 (modified) at 50 Pa and 0.56 ± 0.18 (conventional) and 0.66 ± .0.01 (modified) at 100 Pa (figure S9).
To determine whether this increase in volumetric flow rate and effective hydraulic permeability were sustained for longer durations and at higher pressures, we modified the interstitial layer to enable connection to an external hydrostatic fluid reservoir (figure S10(a)). We connected tubing at the outlet port to allow measurement of volumetric flow rate over time while maintaining constant outlet pressure (figures S10(b) and (c)). With this modified device, we observed a linear increase in volumetric flow rate for applied pressure in unseeded devices, consistent with Darcy's Law (figures S10(d) and (e)). Furthermore, consistent with the previous results, we found increased volumetric flow rate in devices seeded with HUVECs, and interestingly, the volumetric flow rate was not linearly proportional to the pressures, with a higher increase in volumetric flow rate observed at pressures above 100 Pa (figures S10(d) and (e)), which induced cell rounding and delamination from the vessel wall (figure S11).
4. Discussion
Here, we introduce the MμLTI-Flow platform to enable the application of controlled interstitial and luminal pressure to engineered blood and lymphatic microvessels. We demonstrate that the device recapitulated the magnitude of fluid velocities previously measured in vivo and that the velocity fields are consistent with those predicted by CFD models. In IFP flow, the average velocity in the collagen gel domain was 0.61 μm s−1, within the range of what has been measured in healthy tissue [38], and the average fluid velocity magnitude in the microchannel was similar to lymph fluid velocity magnitudes measured in draining lymphatics [39]. In BP flow, the velocity magnitudes were similar to the mean blood velocity measured in capillaries [40]. Importantly, we found that modulating luminal fluid pressures impacted luminal and interstitial flow and vice versa, demonstrating that blood, lymphatic, and interstitial pressures are coupled through transmural and interstitial flow in the MμLTI-Flow platform.
Other microfluidic devices have been developed to culture blood and lymphatic vessels in tubular structures, as recently reviewed [12]. However, these previous approaches have been used to study either lymphatic or blood endothelial cells cultured under either luminal or interstitial flow. Therefore, the coculture of blood and lymphatic vessels within a single 3D hydrogel, and the ability to modulate interstitial and luminal flow within a single platform represent two advances of MμLTI-Flow platform described here. The ability to modulate IFP gradients and resulting flow rates is due to the incorporation of a polydopamine-coated permeable PC membrane that separates the pressure regulatory layer and the underlying microchannel layer of the device. This membrane serves to fix the distance over which IFP gradients are applied and prevents significant strain and compaction in the hydrogel solid phase to maintain a constant hydraulic conductivity under applied pressure. In future studies, this membrane could serve as a substrate for the culture of another cell type and cells could be introduced into the hydrogel to investigate molecular or cellular crosstalk among endothelial cells and tissue-specific cells.
We observed that microvessels subject to dynamic transmural pressure gradients and flow invaded the surrounding collagen hydrogel, consistent with previous observations that basal-to-apical transmural flow induces endothelial cell invasion in a process similar to angiogenic sprouting [23, 41, 42]. Interestingly, we found that the volumetric flow rate increased for a given transmural pressure gradient when the microvessel was seeded with HUVECs, though at lower pressures (50–100 Pa) the microvessels remain confluent with continuous F-actin staining across the vessel wall. It has been shown previously that in vitro angiogenesis requires collagen degradation [43] and that expression and activity of collagen degrading matrix metalloproteinases (MMPs) modulates the rate of angiogenic sprout growth [44]. Furthermore, transmural flow has been shown to upregulate MMP1 expression, and pharmacologic inhibition of MMP1 and MMP1 knockdown with siRNA reduces flow-induced repolarization and sprouting into collagen hydrogels [45]. These results suggest that the observed increase in hydraulic conductivity of the hydrogel under interstitial flow could be due to MMP-mediated degradation of collagen. Future studies will investigate changes in gene expression and protein secretion driven to further understand the key mechanisms that drive vascular remodeling and morphogenesis in response to combinations of interstitial and luminal flows.
Increased IFP correlates with poor prognosis in solid tumors [5] and other diseases and disorders [46]. The effects of pathologic fluid transport or accumulation on circulating and tissue resident cells has largely been inferred from computational analysis or bulk tissue assays [6], in which it is difficult to discern the key molecular mechanisms that underlie the response to flow. Therefore, while these approaches have led to measuring fluid pressure as a possible diagnostic for disease severity [5, 47, 48], developing targeted interventional or therapeutic strategies to treat the effects of these pressures and flows have been limited. In fact, in many cases, it is not clear whether fluid accumulation is a cause or consequence of disease progression [46]. Previous in vitro studies are limited by the culture of only blood or lymphatic endothelial cells and/or the investigation of the effects of separate luminal or interstitial flow. In future studies, the MμLTI-Flow platform could provide critical information into cellular responses in the presence of both lymph and blood vessels and complex flows.
5. Conclusion
In this work, we built on recent developments in the fabrication of microfluidic approaches to model the 3D porous microenvironment [31] to develop a platform where we could relate pressures and flows as measured in animal models to cellular and molecular processes. The resulting MμLTI-Flow platform provides for modulation of blood vessel inlet and outlet pressures, lymphatic inlet and outlet pressures, and interstitial pressure. Importantly, blood, lymphatic, and interstitial fluid velocity magnitudes are similar to what has been observed in vivo, and we observed agreement between experimentally measured and simulated fluid velocities and volumetric flow rates. Furthermore, the ability to apply known fluid pressures and measure fluid velocities also enables characterization of the physical properties, including the hydraulic conductivity and permeability, of the ECM and microvessels. We have demonstrated the ability to co-culture blood and lymphatic endothelial cells in parallel microvessesl and to image living cells with high resolution. Importantly, we have also demonstrated that unlike previous approaches, increased blood pressure results in increased flow across the blood vessel wall, through the interstitial space, and into the draining lymphatics. While the purpose of this study was to demonstrate the design, fabrication, and function of the MμLTI-Flow platform, future studies will investigate the mechanisms that give rise to and the consequences of pathologic fluid pressures. Vessels and ECM permeability change studies caused by hydrodynamic pressure and transmural flow with computational analysis will be included in the future. Furthermore, our MμLTI-Flow platform is applicable for investigating cancer angiogenesis, drug screening, and immune response in the presence of complex 3D flow and also for characterizing the role of hydrodynamic factors in pathologies such as tissue swelling during circulation disorders.
Acknowledgments
This work was supported by a research grant from the University of Pennsylvania Orphan Disease Center in partnership with the Lymphangiomatosis & Gorham's Disease Alliance and the Lymphatic Malformation Institute, the National Institutes of Health (R35GM142944), and the Ross Lampe Chair of Biomedical Engineering at NC State University. S A H acknowledges the financial support of the National Institutes of Health through the Integrative Vascular Biology Training Program (T32HL69768). The device fabrication was performed in the Chapel Hill Analytical and Nanofabrication Laboratory, CHANL, a member of the North Carolina Research Triangle Nanotechnology Network, RTNN, which is supported by the National Science Foundation (ECCS-2025064), as part of the National Nanotechnology Coordinated Infrastructure, NNCI. We thank Dr Julie Blatt (Division of Pediatric Hematology Oncology, UNC School of Medicine), Dr Sudong Kim, and Dr Greco Song (Biomedical Engineering, Boston University) for helpful discussions in the preparation of this manuscript.
Data availability statement
The data that support the findings of this study are available upon reasonable request from the authors.