
Abstract
Cardiac toxicity still represents a common adverse outcome causing drug attrition and post-marketing withdrawal. The development of relevant in vitro models resembling the human heart recently opened the path towards a more accurate detection of drug-induced human cardiac toxicity early in the drug development process. Organs-on-chip have been proposed as promising tools to recapitulate in vitro the key aspects of the in vivo cardiac physiology and to provide a means to directly analyze functional readouts. In this scenario, a new device capable of continuous monitoring of electrophysiological signals from functional in vitro human hearts-on-chip is here presented. The development of cardiac microtissues was achieved through a recently published method to control the mechanical environment, while the introduction of a technology consisting in micro-electrode coaxial guides allowed to conduct direct and non-destructive electrophysiology studies. The generated human cardiac microtissues exhibited synchronous spontaneous beating, as demonstrated by multi-point and continuous acquisition of cardiac field potential, and expression of relevant genes encoding for cardiac ion-channels. A proof-of-concept pharmacological validation on three drugs proved the proposed model to potentially be a powerful tool to evaluate functional cardiac toxicity.
Export citation and abstract BibTeX RIS

Original content from this work may be used under the terms of the Creative Commons Attribution 4.0 license. Any further distribution of this work must maintain attribution to the author(s) and the title of the work, journal citation and DOI.
1. Introduction
Cardiac toxicity represents one of the most recurrent adverse reactions in later stages of the drug discovery pipeline (DDP) [1] and the first cause of drug withdrawal during post-marketing surveillance [2]. The risk of a new compound to induce life-threatening ventricular arrhythmia (i.e. torsade de pointes, TdP) associated to a delayed cardiac repolarization (i.e. QT interval prolongation on the electrocardiogram) is still frequent and does not adequately predicted cardiovascular side effects [3]. The development of relevant in vitro models resembling the human heart thus represents a urgent need to improve cardiotoxicity prediction in the early pre-clinical phases of DDP and, in turn, to plan safer clinical studies.
In this context, the introduction of human induced pluripotent stem cell-derived cardiomyocytes (h-iPSC-CMs) brought significant advantages in the field allowing human-based investigations of drug-related risks [4], especially when used in combination with technological tools allowing for direct recording of electrophysiological activity (e.g. multielectrode array (MEA)) [5, 6]. Nevertheless, most of the currently MEA-based electrophysiological studies rely on two-dimensional (2D) cell monolayers [7–9] resulting in a suboptimal recapitulation of the three-dimensional (3D) complexity of the native human cardiac tissues. Recent studies indeed demonstrated the fundamental role of spatially organized 3D tissue models [10] and mechanical [11–14] or electro-mechanical [15] stimulations, designed ad hoc to achieve superior maturation of h-iPSC-CMs leading to more physiological responses to known compounds [10, 16]. Towards this vision, organs-on-chip (OoC) technology has been proposed as promising approach to recapitulate in vitro the key aspects of the in vivo cardiac physiology with an unprecedented level of accuracy [17], owing to their superior ability to apply controlled biochemical and biophysical stimuli (i.e. mechanical [18] and/or electrical) [15, 19, 20].
The integration of a direct method to record in real-time electrophysiological parameters from such advanced 3D cardiac models, both at the macroscale or in OoC platforms, would dramatically increase their potential in the prediction of arrhythmic and TdP risks, finally reducing the associated costs. To date, most of the currently developed and available systems to extract relevant information from 3D cardiac tissues either rely on indirect methods, such as optical inspection [10, 18, 21, 22], or require the dissection of the cultured tissue into single cells to perform standard patch clamp analyses [15, 19], thus intrinsically altering the superior potential of the 3D model. An available tool to directly measure electrophysiology from 3D models is represented by standard sharp electrodes [23, 24]; nevertheless, they still require expert operators and specific instrumentations, such as expensive micromanipulator, and they do not allow a fine control over the spatial electrode positioning within the 3D cardiac construct, especially when microscale models are involved.
Here we present for the first time an effective and repeatable technology, named micro-electrode coaxial guide (µECG), enabling to conduct online electrophysiology studies on 3D miniaturized microtissues. µECG allows to precisely position wire-shaped probes within polydimethylsiloxane (PDMS)-based OoC platforms without the need of micromanipulators, avoiding cellular damage and thus being compatible with live cell monitoring. The µECG was integrated in a previously developed beating heart-on-chip device, mimicking the mechanical environment that cardiac cells sense in vivo [18]. The resulting electro-mechanical platform, named 'uHeart', was successfully used to record field potentials (FPs) arising from both rat and human cardiac microtissues with an excellent signal to noise ratio, allowing the online assessment of microtissue evolution and in vitro development through electrophysiological measurements. Finally, as a proof of principle, we performed an electrophysiological-based calibration of uHeart on compounds well-known for altering the QT. uHeart is able to predict drug-induced alterations in the FP duration (FPD) (i.e. prolongation or reduction of QT interval) of 3D engineered cardiac microtissues, of both human and rat origin, exhibiting spontaneous beating and contractile phenotype.
2. Results
2.1. The micro-electrode coaxial guides (µECG) technology
To provide a means for the precise positioning of 3D micro-electrodes within microfluidic platforms, a dead-end microchannel (named 'micro-electrode coaxial guide' or 'micro-guide') geometry was designed as a guiding track for the insertion of 3D wire-shaped probes (figure 1(a)). This constrains lateral and vertical electrode movements while allowing it to move towards the target area. The target area is separated from the dead-end channel by a thin wall of perforable and self-sealing material (figure 1(a)). To accurately position the micro-electrode tip in the target area, (1) the micro-electrode is first inserted in the micro-guide until the tip reaches the perforable wall, (2) the wall is pierced, (3) the micro-electrode tip reaches the desired location. The whole process allows repeatable spatial control of the tip position without need for micromanipulation. At first, to validate µECG concept, we designed a microfluidic platform consisting of a single coaxial guide to assess its compatibility with the recording of 3D microtissues electrical activity (figure 1(b)). The platform (figure 1(b)(i)) features a central channel for injection of a cell-laden hydrogel, separated from the lateral medium channels by means of two rows of pillars designed to confine the cell construct [25]. A 150 µm wide micro-guide (figure 1(b)(i) in gray) was included for positioning a single micro-electrode (figure 1(b)(iii)), separated from the microtissue by means of a 200 µm wall. The electrode is considered to be correctly inserted when just its tip reaches the target area. Recording the electrical activity of cardiac microtissues.
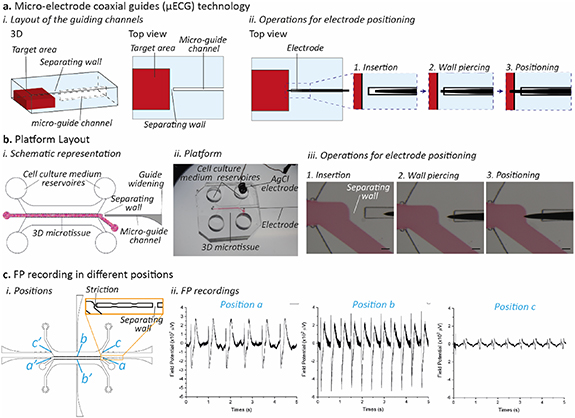
Figure 1. Micro-electrode coaxial guides (µECG) technology. (a) The µECG concept: (i) 3D sketch and top view of a micro-guide channel separated from the target area by means of a perforable wall. (ii) Sequences of operations necessary to precisely position the electrode inside the target area: the electrode is manually inserted in the micro-guide (1) and is used to perforate the separating wall (2) until the tip enters the target area (3). (b) Integration of the µECG technology within a microfluidic device to culture 3D cardiac microtissues. (i) Layout of the platform evidencing the 3D microtissue chamber (the target area, red) separated by a wall from the micro-guide (gray), which is specifically designed to have a widening at its end so to facilitate the manual electrode insertion. (ii) The final platform was made in PDMS and it was conceived to measure the electrical activity of cardiac microtissues: one electrode was positioned within the micro-guide channel and an AgCl electrode was positioned within one of the cell culture medium reservoirs, as a ground. (iii) By sliding the electrode in the micro-guide, the electrode punches the wall and reaches the microtissue area. Scale bar 100 µm. (c) The system is suitable to monitor the field potential in (i) different consistent points of the microtissues (indicated as a, b, c with their mirrored positions a', b', c'), (ii) allowing for the specific recording of electrical signals of a pre-determined microtissue area.
Download figure:
Standard image High-resolution imageThe microfluidic platform was first exploited to monitor 3D cardiac microtissues generated from neonatal rat cardiomyocytes (CMs) embedded in fibrin hydrogel. After 5 days of culture, cardiac microtissues showed a spontaneous beating, and the electrical signals generated were recorded by keeping the devices in a CO2 incubator and connecting the electrodes to an extra-cellular amplifier (figures S1(a) and (b) (available online at stacks.iop.org/BF/13/035026/mmedia)). The typical cardiac FP morphology was recorded using either tungsten [26] sharp electrodes [27] or stainless steel needles (SSNs). Although the signal to noise ratio was comparable (figure S2), SSN resulted easier to handle, and were thus chosen for all subsequent experiments. To exploit the versatility of the µECG technology, we designed multiple micro-guides able to precisely positioning SSN electrodes and monitoring cellular electrical activity in specific areas of the microtissue. FP signals were successfully recorded from multiple regions, detailed in figure 1(c): position 'a' in contact with the extremity of the microtissue, position 'b' at the center of the microtissue and position 'c' in the lateral medium channel. As expected, signals in positions 'a' and 'b' showed a higher amplitude with peak to peak values among 500 µV and 800 µV, respectively. On the contrary, signals in position 'c', showed a reduced amplitude (less than 100 µV peak to peak amplitude), due to the tip of the electrode not being in direct contact with the microtissue (figure 1(c)(ii)). In this configuration, the separating wall was positioned along the micro-guide, while its end was placed in direct contact with the target area by means of a channel striction allowing for a consistent positioning of the electrode tip, as confirmed by optical visualization under the microscope (figure 1(c)(i)).
2.2. uHeart platform to train and monitor cardiac microtissues
The µECG technology was coupled with a previously developed technology, named uBeat [28], which allowed to apply controlled mechanical stretching [18] to 3D cardiac microtissues. A new platform (named 'uHeart') was designed to provide (a) online measuring of electrical activity of beating cardiac microtissues trained by mechanical stimulation and (b) increased operational throughput comprising three biologically independent cell culture chamber units, each integrated with micro-guides. Of note, all three units were coupled with a single uBeat actuation mechanism, allowing to simultaneously apply mechanical training to three cardiac microtissues. As detailed in figures 2(a) and (b), uHeart is composed by two PDMS layers and one coverslide: (a) an upper cell culture layer containing the cell culture chambers (in red), each integrated with two lateral micro-guides to measure electrical activity at the two ends of the cardiac microtissues (in blue, 'a' and 'a'' positions), and (b) a bottom actuation layer (in green) containing pressure-actuated compartments. Each cell culture chamber unit, integrating the µECG technology, comprises two rows of overhanging posts designed both to host the 3D cardiac microtissue and to control the intensity of the mechanical stretching, as previously described [18]. Briefly, the application of a positive pressure of 0.35 atm in the actuation chamber, which was pre-filled with sterile Phosphate Buffer Saline (PBS), causes the movement of the membrane (i.e. 50 µm of displacement corresponding to 1/3 of the total microtissue height) towards the free-end of posts in the culture chamber. Being the cell-laden hydrogel confined between the two rows of the over-hanging posts, membrane deflection causes its deformation through the space between the posts, eventually resulting in a uniaxial stretching of the microtissues, as previously described [18]. Once the pressure is released, the elastic recoil of PDMS allows the membrane and the microtissue to gain the rest position. To mimic the in vivo like heartbeat, the cyclic mechanical stimulation is provided with 1 Hz frequency, with 50% of duty cycle. Figure 2(c) shows a representative image of uHeart platform.
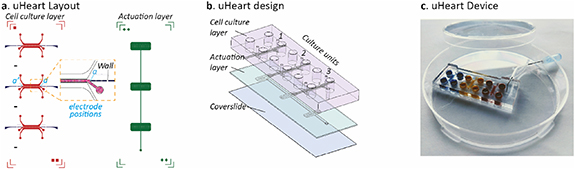
Figure 2. uHeart platform, based on the integration of the micro-electrode coaxial guides (µECG) technology with our previously developed beating heart on chip [17]. (a) The layout of uHeart platform consists in a cell culture layer encompassing three separated cell culture chambers (red). Each chamber hosts a 3D microtissue and has two micro-guides for electrode insertion (blue) placed in different positions (a), (a'). The cell culture layer is designed to be coupled to a single actuation layer (green) which provides the mechanical stimulation simultaneously to the three microtissues. (b) Within the device each cell culture chamber (1, 2, 3) is positioned on top of the correspondent actuation, which is closed at the bottom with a coverslide for optical inspection. (c) The final device with the three independent culture units (blue, yellow and red) is made in polydimethylsiloxane (PDMS) and the mechanical stimulation is ensured by coupling uHeart with a compressed air source by means of a Tygon tube.
Download figure:
Standard image High-resolution image2.3. Monitoring of rat cardiac microtissues electrophysiology
The uHeart platform was used to culture rat cardiac cells in 3D under dynamic culture conditions (10% of uniaxial strain, 1 Hz), which successfully organized in functional cardiac microtissues (figure S3) confirming previously obtained results [18]. To demonstrate the advantages of the self-sealing properties of the µECG, we exploited the technology to monitor the electrical activity of rat cardiac microtissue during the entire culture period, characterizing the physiological adaptation of the cells while forming the syncytium. In particular, simultaneous measurements were performed in two different locations of a cardiac microtissue (left part, position 'a'' in red; right part, position 'a' in gray, in figure 3(a)). µECG successfully recorded the occasional spontaneous beating at both sides of the microtissue already at day 1 in culture, as highlighted by two simultaneous recorded FP measured from the right and left areas of each microtissue (figure 3(a)). The captured signals evidenced a gradually reinforced cell electrical activity during time, reaching a stable and synchronous beating after 4 days in culture, as evidenced by the regular amplitude (e.g. 300–400 µV at day 4) and frequency (i.e. ≈1 Hz) of the spikes depicted in the representative signals. These results were confirmed by Poincaré plots (figure 3(b)), pointing out how RR intervals variability decreased during time (i.e. points started concentrating closer on the identity line) and how RR intervals synchronized in both part of microtissues (i.e. overlapping of the gray and red lines). Moreover, from the obtained signals, the gradual achievement of regular beating can be also quantified (figure S4(a)) and the beating synchronicity across the entire length of the microtissues can be evaluated by computing the consistency of the delay between R peaks measured from left and right parts of the microtissues during the culture period (figure S4(b)). Owing to the continuously monitoring capability of the µECG technology, the detection of arrhythmic events was also achieved. As evidenced in figure S4(c), before the establishment of a regular electrical activity (i.e. day 4 of culture), trains of smaller peaks in the FP signals between the regular beatings were present in the tracks, probably due to groups of cells not yet completely coordinated within the entire construct.

Figure 3. Monitoring of the electrical activity of rat cardiac microtissues cultured within uHeart in dynamic conditions. (a) Recordings were performed daily in a non-destructive way with SSN placed in two different positions (position 'a'' in red; position 'a' in black) and (b) Poincaré plot were obtained by calculating the corresponding RR intervals. The representative microtissue started to spontaneously beat in a sporadic way already after 1 day in culture and in 4 days it reached a higher and more stable synchronized activity.
Download figure:
Standard image High-resolution image2.4. Development of human cardiac microtissues
To exploit the potentiality of uHeart in assessing different aspects and parameters of 3D cardiac microtissues beating, we generated human models by injecting a fibrin hydrogel loaded with a combination of h-iPSC-CMs (iCell Cardiomyocytes from Fujifilm) and human fibroblasts (Lonza) in a 3:1 ratio [15]. After 7 days of mechanical training (figure S5(a)), CMs exhibited a 3D elongated morphology, showing typical sarcomeric striations (cardiac troponin I staining, figure 4(a)(i)) and appeared interconnected with randomly distributed fibroblasts (vimentin-stained in red, figure 4(a)(ii)), used as supportive population [15] (phalloidin and cardiac troponin I staining, figure 4(a)(iii)). Gene expression analyses on ion-channel related genes (i.e. KCNH2; KCNQ1; CACNA1C; SCN5A) were performed after 7 days of mechanical training (figure 4(b)). Compared to the baseline (i.e. mixed population of h-iPSC-CMs and human fibroblast before fibrin embedding and seeding within uHeart), the trained microtissues showed a statistically significant upregulation of both hERG (encoded by KCNH2 gene) and IKs (encoded by KCNQ1) voltage gated ion channels, which are responsible for the outward potassium current during the cardiac repolarization phase. Conversely, sodium (i.e. encoded by SCN5A) and calcium (i.e. encoded by CACNA1C) ion channels expression were not altered by the culture within uHeart.
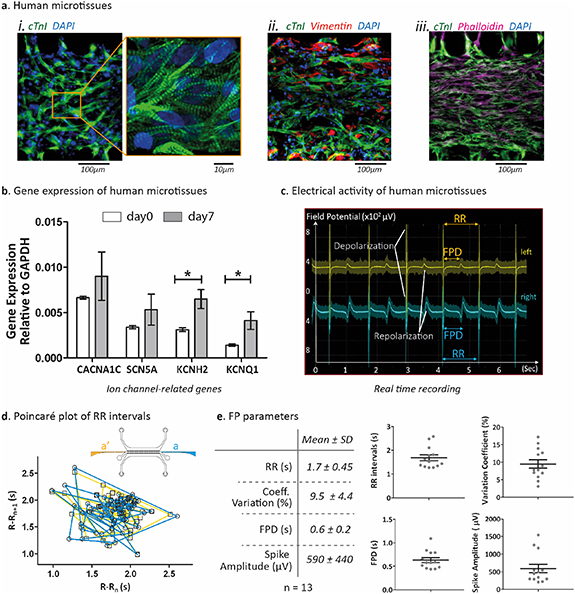
Figure 4. Human cardiac microtissue characterization. (a) Immunofluorescent staining of human cardiac microtissues mechanically trained for 7 days within uHeart platform. (i) cardiac troponin I (green) reveals that cells showed the typical striation of the cardiac muscle and (ii) cardiac troponin I and vimentin staining demonstrated that h-iPSC-CMs and human fibroblasts both organized in 3D to form (iii) a packed microtissue (troponin I and phalloidin). Scale bar 100 µm; zoom 10 µm. (b) Gene expression quantification by RT-qPCR: genes related to specific ion channels revealed that microtissues at day 7 (gray) are characterized by an enhanced level of potassium channels (KCNH2 and KCNQ1) but maintain a similar level of both calcium (CACNA1C) and sodium (SCN5A) channels with respect to day 0 (white). Statistics by Mann–Whitney test *P = 0.0357 on n = 6 samples. All gene expression values are normalized relative to GAPDH expression. (c) Electrical activity measurement of microtissues mechanically trained in uHeart for 7 days showed a spontaneous and synchronous beating, as revealed by the overlapping of the depolarization and repolarization peaks in the recorded curves, which represent electrical activity in two opposite part of the microtissue (left in yellow, position a'; right in blue, position a. (d) Representative Poincaré plot of RR intervals from both left and right position of the microtissues, highlighting the regular and synchronous beating. (e) Electrophysiological parameters calculated from recorded FP of n = 13 cardiac human microtissues cultured within uHeart for 7 days. Results are expressed as mean with SD.
Download figure:
Standard image High-resolution imageCardiac microtissues started beating already after 3 days in culture and after 7 days of mechanical stretching cells exhibited a spontaneous and synchronized beating, as shown in the video S1. µECG technology was thus exploited to verify and quantify the synchronism of the whole microtissues at day 7. As highlighted in figure 4(c), real time simultaneous recording of the cell electrical activity in the two opposite positions 'a'' (in yellow) and 'a' (in blue), revealed two FP traces overlapping in time. Of note, owing this syncytium, the typical depolarization and repolarization phases of the microtissues could be recognized and measured directly from the curves without the need of particular signal processing. As highlighted in the representative Poincaré plot of figure 4(d), human cardiac microtissues showed regular RR intervals and acquired synchronized beating at both their extremities (i.e. plot of lines from both left and right parts overlapped). Electrophysiological parameters were also calculated from FP recorded among 13 cardiac human microtissues after 7 days in culture, accounting for spontaneous beating period (i.e. 1.7 ± 0.45 s), coefficient of variation (i.e. 9.5 ± 4.4%), FPD (i.e. 0.6 ± 0.2 s) and spike amplitude (590 ± 440 µV) (figure 4(e)).
2.5. Drug administration and FP alteration assessment in cardiac microtissues
The uHeart platform was exploited for real-time, on-chip, drug screening tests on both rat and human microtissues, focusing on compounds causing well-known electrical alterations [8, 29]. The drug administration protocol is shown in figure S5(b). Three calibration compounds (i.e. aspirin, sotalol and verapamil) and one vehicle (i.e. DMSO) were tested on human cardiac microtissues, trained with mechanical stimulation for 7 days and showing a spontaneous synchronous beating. Results in figure 5(a) show representative FP curves recorded before and after the administration of increasing compound concentrations. As evidenced in figure 5(b), neither DMSO nor aspirin caused significant FPDc alterations (i.e. variations in percentage of FPD corrected with Fridericia's method, FPDc, above 10%) [29, 30] in human microtissues at any concentration tested (i.e. up to 0.6% and up to 300 µmol, respectively). Sotalol, a Kr-channel blocker [31], caused a significant 20% prolongation of the human microtissues' FPDc at 15 µmol, which doubled at 30 µmol and reached a value of about 80% at 60 µmol. Conversely, verapamil, a well-characterized class 4 antiarrhythmic compound [32], decreased the human microtissues' FPDc of about 25% at 50 nmol and of 40% at the maximum tested concentration of 1 µmol. Data on RR intervals and FPD with no correction are provided in figure S6. The obtained results were confirmed also investigating the variations in percentage of FPD corrected with Bazzet's method (figure S7) [33].

Figure 5. Drug-induced electrophysiological changes in human cardiac microtissues. (a) Representative field potential curves recorded directly on-chip at incremental concentrations of aspirin (negative control), verapamil and sotalol compounds. Signals are recorded from the chip, amplified and analyzed by means of a custom-made MATLAB software, which averages all the recorded peaks and overlays the traces of each FP recorded at the initial depolarization peak. (b) To assess the FPD alteration induced by different compounds, the percent change in the FPD interval was computed from the recorded FP signals following the administration of DMSO (vehicle), aspirin (negative control), sotalol and verapamil. Data are expressed as mean ± SE of at least three microtissues for each compound and the FPD intervals were corrected by using the Fridericia's method (FPDc). The dashed red lines indicate a 10% prolongation or reduction of the repolarization interval. Concentration represents total drug concentration in medium. Statistical analysis was performed through Kruskal–Wallis with Dunn's multiple comparison test (*P < 0.05; **P < 0.01; ***P < 0.001).
Download figure:
Standard image High-resolution image
To further exploit the potentiality of uHeart and to test its specificity in detecting inter-species variability, the effect of the two positive compounds was also assessed on rat microtissues mechanically trained for 5 days. In the rat model (figure S8), sotalol prolonged the repolarization wave peak in a dose dependent manner, with concentrations above 7.5 µmol causing an increase of the FPDc. Verapamil also increased the repolarization interval, showing an opposite trend in murine as compared to human microtissues (i.e. FPDc prolongation close to 50% at doses ranging between 10 and 1000 nM). In details, as evidenced in figure S9, the treatment of human cardiac cells with a high concentration of verapamil (i.e. 1000 nM) caused a statistically significant decrease of the FPDc (%) with respect to the increased values of rat FPDc (%) obtained at 100–1000 nM.
3. Discussion
In this study, we conceived a new microscale platform, uHeart, integrating our previously developed uBeat technology, which reproduces key physical cues of the native myocardium through mechanical stimulation, and a µECG technology, for the online assessment of microtissue electrophysiology. To date, this represents the first controlled and direct means of performing electrophysiological recordings in a 3D tissue construct within an OoC platform. uHeart was successfully exploited to develop functional and synchronously beating cardiac microtissues of both rat and human origin by means of a defined mechanical training [18], whose electrical activity was monitored during the entire culture period. We then provided a proof of principle experiments on the applicability of such platform to screen drugs affecting cardiac electrophysiology.
Ideally, a combination of tailored environmental cues (e.g. biochemical and physical signals) and ad hoc engineered tools to directly analyze functional readouts (e.g. electrical activity and contractility) are both fundamental features to develop advanced in vitro cardiac models for screening more efficiently novel compounds in the DDP [17, 34]. In the context of cardiac safety testing, a strong focus has been placed on detecting, as early as possible, rare drug-induced ventricular arrhythmia associated with delayed cardiac repolarization (i.e. prolongation of the QT interval) [35]. Different systems enabling to assess cardiac functional parameters, such as spontaneous beating frequency, depolarization–repolarization patterns and ionic currents magnitude, have thus emerged as promising tools. Among them, MEA platforms enable to achieve long-term and non-invasive monitoring of arrhythmic events on human CMs (i.e. h-iPSC-CM) [8, 29, 36–39]. While MEA platforms allow direct functional readouts (i.e. FP recording), they still raise limitations concerning 2D cell monolayer maturation and lack of cardiac organization [8]. In this attempt, different systems have been developed to couple the MEA technology with more relevant cardiac models. To reproduce the isotropic structure of the myocardium, Kujala et al [40] developed a laminar human cardiac tissue by integrating topographical cues on commercially available MEA platform, successfully predicting the effects of different compounds on the engineered cardiac tissue electrophysiology. However, the model still relied on a 2D culture configuration, while a 3D arrangement of myocytes and non-myocytes cells together with physical conditioning (i.e. mechanical and electrical cues) have instead been proved to be fundamental to achieve cell maturation and physiological responses in engineered cardiac models [15]. Different relevant matrix, both natural and synthetic, have been investigated (i.e. collagen, fibrin, Puramatrix®) to support CM growth or to model pathological conditions [41, 42]. To simulate the interaction between cells and the 3D extracellular matrix, Wei et al [43] exploited a scaffold-based cell cultures performing extracellular recording after isoprenaline administration. Although a good integration with MEA biosensors was achieved, the cardiac model was developed before its integration with the sensor, and only the beating period and spike amplitude were analyzed. Giacomelli et al [23, 44] demonstrated the importance of integrating CMs with supportive non-myocytes cells (i.e. cardiac fibroblasts and endothelial cells) in complex 3D structures to enhance the maturation level of the developed cardiac spheroid microtissues (MT). However, to study the MT electrophysiology, the spheroids needed to be further manipulated (i.e. transferred into new platforms or dissected). Action potentials (APs) were thus measured either through patch clamp on single cells after MT dissociation or by means of sharp electrodes after cutting MT in small pieces; while FP recordings were performed by means of MEA system, to which the MT needed to be transferred. Other platforms, such as the so called biowire [19, 21], engineered heart tissue (EHT) [22, 24] and engineered heart muscles [45], successfully demonstrated the superior cardiac maturation achieved by incorporating cells in hydrogels (i.e. fibrin and collagen) to form a 3D strip contracting to attachment points and by stimulating them through electro-mechanical conditioning. Nevertheless, the investigation of EHT's electrical properties and the effect of cardiotoxic compounds still relies on non-integrated tools, such as indirect optical meanings (i.e. video recording of contracting microtissue, calcium transient assay) or direct but laborious AP measurements through patch clamp and sharp electrodes. uHeart coupled for the first time the capability to generate a beating 3D cardiac microtissue thanks to a training achieved by means of a mechanical stimulation [18], with the possibility to monitor online and in a non-invasive manner microtissues' electrophysiology (i.e. by measuring FP signals). Specifically, by designing micro-guide channels it is possible to define several monitoring ports for the manual insertion of electrodes in predefined locations within a 3D miniaturized cell culture compartment. Differently from MEA systems, that rely on the spontaneous organization of CMs on flat 2D electrodes, µECG allows to guide microtissues' formation in defined regions of a miniaturized platform, where electrodes will be specifically inserted and used to interrogate the microtissues. This is obtained without the need for complex and expensive micromanipulators, required instead to perform patch clamp and voltage clamp assays [46, 47] or to extract electrophysiological parameters from a 3D tissue by means of sharp electrodes [24, 26, 48]. Micromanipulation indeed limits the use of such platforms to highly specialized users and to open-top designs, while µECG is compatible with manual and fast operations yet allowing a high degree of reproducibility and accuracy in positioning the electrodes, thanks to the presence of specific geometrical features (i.e. strictions) guiding the operator to consistently locate the electrode tip. Notably, the high spatial control allowed by µECG is compatible with multi-points acquisition in 3D microtissues, possibly enabling in future studies to measure tissue synchronicity and identify pacemaker regions. Moreover, as we recently reported [20], the stainless-steel electrodes used to acquire the signals can be also used to electrically stimulate or pace the microtissues, by inserting them in the lateral medium channels. This could potentially pave the way to further exploit the µECG to directly evaluate the conduction velocity in in vitro model. By finely controlling the position of the electrical signal used to trigger the beating (i.e. pacemaker region) and by assessing the time delay which passes to obtain a spike (i.e. depolarization event) in a pre-determined position of the microtissue, it would be possible to estimate the microtissue conduction velocity.
Being the µEGC technology integrated within a microfluidic platform, it shares the advantages of miniaturization (i.e. reduction in cells and reagents; high temporal and/or spatial resolution), promising to be suitable for mid-throughput screening [49]. The throughput level of uHeart indeed is lower than traditional multiwell plates (96–384 wells), which are used in combination with high-framerate recordings, calcium/voltage sensitive dyes and video analyses to indirectly assess the cardiac contractility and electrophysiological parameter after drug administration [50–53]. However, the data generated through µEGC (i.e. FP signals) represent a direct measurement of cardiac microtissue electrophysiology with the additional advantage of generating less massive file size as compared to imaging-based methods (i.e. about 700–800 Mb for 25 s of video at 100 fps vs about 15 Mb for 3 min of electrical signal measurement at 2 kHz).
While the potential of µEGC is here deeply demonstrated in the uHeart platform to extract cardiac relevant parameters (i.e. FP), µEGC versatility was exploited to also perform online trans-endothelial electrical resistance (TEER) measurements, by incorporating the guide technology in a different PDMS-based OoC modeling the endothelial blood–brain barrier (BBB) (figure S10). This proof-of-concept suggests that the µEGC could potentially also be adapted to different cell culture platforms based on elastomeric components (e.g. EHT system). The versatility of µECG was further demonstrated by using different probes (i.e. SSN and commercial tungsten electrodes): both electrodes types indeed allowed the recording of the typical FP cardiac signal (i.e. depolarizing peaks followed by the smoother repolarization peak) with a comparable SNR. However, signals recorded with tungsten electrodes resulted less stable, probably due to the different resistive/capacitive properties of the metals in contact with the saline solution (i.e. cell culture medium). Metal electrodes have a low impedance and better SNR in the frequency ranges of the spike signals, but tungsten is known to be noisy at low frequency [50]. Also, the smaller tungsten electrode tip exposed to the media could have affected the measurement [54]. SSNs represent an easier to handle and, at the same time, cheaper solution as compared to commercially available tungsten electrodes, known to be suitable to perform extracellular signals measurements [27], and were thus implemented in this study.
By exploiting our µECG technology, we provide an on-line method to assess the functional microtissue development during the entire culture period, as demonstrated as proof of concept by the non-invasive monitoring of electrical activity of rat cardiac microtissues in different locations (i.e. FP measurements in different area) and of electrophysiological changes within time (i.e. during different days of culture). Rat cardiac microtissues analyzed through the µECG technology revealed an early onset of spontaneous contractions capable of synchronizing throughout the culture time and space. uHeart allowed also to develop functional human cardiac microtissues from h-iPSC-CMs and human fibroblasts, which have been used as supportive population in different studies [26, 55, 56] and whose contribution should be further investigate (i.e. assessing their proliferation and organization). Cardiac microtissues showed 3D cellular arrangement, spontaneous beating and expression of relevant genes encoding for cardiac ion-channels (i.e. genes related to potassium currents, KCNH2 and KCNQ1; and genes encoding for voltage-gated calcium channels CACNA1C and SCN5A). Despite the spike amplitude was quite variable among microtissues, the FP shape (i.e. depolarization and repolarization curve) was always easily recognizable directly from the recorded signals without the need of post-processing filtration, given to the low level of recorded noise. Spontaneous beating period of microtissues was in line with reported studies on 2D iCell-CM [7, 8], with a slightly superior coefficient of variation, which can be probably reduced by increasing the incubation time of the microtissues before performing the baseline recording [8]. While the mean FPD of microtissues was higher if compared to native tissue (i.e. 0.4–0.45 s, QTc interval of human ventricle [57]), the results were comparable with those reported studies on 2D iCell-CM [7, 8].
Preliminary results on drug-screening of selected compounds demonstrated the ability of uHeart to properly capture drug-related FPD alterations. As expected, human microtissue electrophysiology was not altered by DMSO (i.e. vehicle) and aspirin (i.e. negative control), confirming previously reported results using h-iPSC-CMs cultured on MEA [29, 58]. Sotalol was shown to prolong the FPD starting from 15 µM, concentration in line with clinical reported Cmax values (i.e. Cmax = 15 µM) [1]. Similarly, uHeart was able to capture the effect of verapamil, which affects multiple ion channels (i.e. hERG and L-type calcium channel), evidencing the reduction of FPD starting from 50 nM (Cmax = 45 nM) [8]. While a direct comparison with MEA-based systems is hampered by the intrinsic differences in culture environment (i.e. 3D and dynamic in uHeart vs 2D and static in MEA), a similar trend was observed for the selected drugs between our results and literature [8, 29, 39].
Of note, drug screenings performed on rat cardiac microtissues highlighted the high specificity of our model to detect inter-species variability. Indeed, verapamil was tested both on rat and human microtissues resulting in two opposite FPD alterations: the drug prolonged FPD interval in rats, while shortened FPD in humans. These results confirmed previously reported data on rat CMs [59] and demonstrated the potentiality of uHeart to detect species-specific effects of drugs.
4. Conclusions
The uHeart platform offers the unique ability to simultaneously generate functional cardiac microtissues within a biomimetic 3D dynamic environment and directly monitor on chip their electrophysiological functional response. The integration of uBeat technology provides cells with a relevant and controlled mechanical stimulation resembling heart beating, while the µECG technology offers a means for a continuous monitoring of the microtissues' electrical activity. Together these characteristics make uHeart a powerful in vitro platform allowing both to develop relevant cardiac models and to perform low-cost drug screening. The cardiac microtissues generated within uHeart indeed respond to drugs in a physiological manner, accounting also for inter-species variability.
5. Methods
5.1. Device design and fabrication
The layouts of the microfluidic devices were drawn in CAD software (AutoCAD, Autodesk Ink) and the corresponding optical masks for photolithography were printed at high resolution (64 000 DPI). Master molds were fabricated in a cleanroom environment (Polifab, Politecnico di Milano) by means of the conventional photolithography technique. As already described [20], the pattern of each layer was transferred on SU8‐2050 photoresist (MicroChem, USA), previously spin-coated on 4 inch silicon wafers. The culture chamber master mold integrating the µECG technology was composed by two layers of photoresist: (a) a 50 μm thin layer representing the bottom region of the cell culture chamber, forming the gap space underneath the posts, with the micro-guides and (b) a 100 μm thick layer representing the upper part of the cell culture chamber including the posts and identical micro-guides, aligned on top of the thin layer. Specifically, to obtain 50 μm and 100 μm photoresist layers, the spinning velocity of the spin coater (Karl Süss RC8, Süss Microtec, Germany) were 3840 rpm and 1900 rpm, respectively. The hanging posts formed a central channel for cell-laden hydrogel injection 300 µm wide and 1000 µm long [18]. The micro-guides, designed to be either in one (figure 1(b)) or six different positions (figure 1(c)), had a squared cross-section (side of 150 µm) and were designed with a widening of about 1 mm at the outer border to facilitate the manual insertion of the micro-electrode. Each micro-guide was separated from the target area by a 200 µm perforable and self-sealing wall. The pressure actuated compartment was obtained by spinning a single photoresist layer, 50 μm thick, with a velocity of 3480 rpm [20].
The final devices were made of PDMS (Sylgard 184; Dow Corning): the elastomer was mixed with the curing agent at a ratio of 10:1, respectively, degassed and casted on the master molds. After curing (65 °C for 3 h), PDMS stamps were peeled off the mold and assembled by permanently bonding surfaces after treatment with air plasma (i.e. high level plasma for 50 s at 0.420 torr) through the plasma cleaner (Harrick Plasma, PDC-002). Wells for media reservoirs and access ports for hydrogel injection were created within the cell culture chamber through biopsy punchers of 5 mm and 1 mm, respectively. Specifically, to produce the single chamber devices (figure 1), the culture chamber layer was plasma bonded to a 1 mm PDMS membrane. Instead, to assemble the uHeart platform (figure 2), the cell culture layer was firstly carefully aligned and bonded to the corresponding pressure-actuated compartment and then bonded to a 150 μm thick coverslide. The access port to the pressure-actuated compartment was made by punching a hole of 1.5 mm, to fit a Tygon tube (i.d. 0.50 mm, o.d. 1.5 mm) connecting the compressed air source. Once uHeart platform was assembled, each pressure-actuated compartment resulted separated from the culture chamber by means of a 800 μm thick PDMS membrane, able to transfer the mechanical stimulation to the cardiac microtissue when the pressure in the actuation chamber increases.
5.2. Neonatal rat cardiomyocytes isolation
In this study, neonatal rat CMs were isolated from 2 d old Sprague Dawley rats (Charles River, Wilmington, MA, USA) following a previously described protocol [20]. The isolated population was enriched for CMs by performing a 1 h pre-plating. The harvested non-adhered cells, mostly CMs, were cultured in Dulbecco's modified essential medium high glucose (DMEM, 4.5 g l−1 glucose, Gibco) supplemented with 10% v/v fetal bovine serum (FBS, Hyclone), 100 U ml−1 penicillin (Life Technologies), 100 g ml−1 streptomycin (Life Technologies), 10 mmol hepes (Gibco), 2 μg ml−1 insulin (Sigma), 50 μg ml−1 ascorbate (Sigma) and 5 μmol cytosine-B-D-arabino-furanoside hydrochloride (AraC, Sigma). Cells were used the day after to generate the cardiac microtissues.
5.3. Rat cardiac model generation and culture within uHeart
Neonatal rat CMs were embedded in fibrin gel at a density of 75 × 106 cells ml−1 and injected in the microfluidic platforms. In detail, a human fibrinogen (Sigma Aldrich) solution was mixed with the cardiac cells suspended in DMEM containing human thrombin (Tisseel, Baxster), in order to achieve a final fibrin gel of 20 mg ml−1 fibrinogen with 5 U ml−1 of thrombin. The cell-laden fibrin solution was pipetted into the central channel of each cell culture chamber (∼2 μl each unit) and incubated for 5 min (5% CO2; 37 °C) to allow the gel cross-linking, before adding the culture medium in the lateral channel. The microtissues were cultured for 5 d in cardiac complete medium, composed by a 1:1 (v/v) mix of DMEM (Gibco, 4.5 g l−1 glucose) and EGM-2MV (Lonza) supplemented with 10% v/v FBS (Hyclone), 100 U ml−1 penicillin, 100 μg ml−1 streptomycin, 10 mmol hepes and 2 mg ml−1 of aminocaproic acid (ACA, Sigma). The amount of ACA in the medium was gradually diminished as follow: day 1 (2 mg ml−1), day 2 (1.6 mg ml−1), day 3 (1.4 mg ml−1), day 4 (1.2 mg ml−1), day 5 (1 mg ml−1). Cardiac tissues were mechanically trained (10% uniaxial strain, frequency 1 Hz) for 5 d, starting 4 h from the seeding.
5.4. Human cardiac model generation and culture within uHeart
Human cardiac models were generated by combining h-iPSC-CMs (iCell Cardiomyocytes from FUJIFILM Cellular Dynamics Inc.) and adult human dermal fibroblasts (Lonza) in a ratio of 75% h-iPSC-CMs and 25% human fibroblasts, as previously reported [15]. H-iPSC-CMs were thawed according to standard protocol and immediately used. Human fibroblasts were expanded in DMEM (Gibco, 4.5 g l−1 glucose) supplemented with 10% v/v FBS, 100 U ml−1 penicillin, 100 μg ml−1 streptomycin and 10 mmol hepes and used at confluency. Human fibroblasts were used till passage 11. Cells were embedded at a density of 125 × 106 cells ml−1 in fibrin hydrogel prepared as previously described to reach a final concentration of 10 mg ml−1 of human fibrinogen and 1.25 U ml−1 of human thrombin. The hydrogel solution (i.e. roughly 2 µl per each cell culture chamber) was subsequently dispensed in uHeart and let crosslink at 37 °C for 8 min before manually adding culture media. Plating medium (FUJIFILM Cellular Dynamics Inc.) supplemented with 100 U ml−1 penicillin, 100 μg ml−1 streptomycin and 2 mg ml−1 of ACA was used for the first 24 h of culture. Subsequently, RPMI (Sigma Aldrich) medium supplemented with 100 U ml−1 penicillin, 100 μg ml−1 streptomycin, ACA and B-27® was used and changed every day for the following 6 days. The amount of ACA in the medium was gradually diminished as previously described for rat microtissues. Mechanical stimulation [18] (10% uniaxial strain, frequency 1 Hz) was started after 4 h from seeding.
5.5. Field potential recording
Experiments were performed by maintaining uHeart platforms in the incubator at 37 °C with 5% CO2. FP of the developed rat and human microtissues were recorded as soon as the cells started to spontaneously beat. The measuring electrodes (stainless-steel microelectrode of 120 µm in diameter and 3 cm long or parylene coated tungsten sharp electrodes with a tip diameter of 10 µm) were firstly manually inserted in the micro-electrode coaxial channels till the separating wall was punched and the tip reached the desired position close to the microtissue. An AgCl ground electrode was positioned into one of the four cell culture medium reservoirs. An extracellular amplifier (Ext-02b, Npi Electronic GmbH, Germany) was used to amplify (10 k Gain) and filter (3 Hz high pass, 10 kHz low pass) simultaneously up to two electrophysiological signals. FPs were acquired and recorded with a rate of 2000 sample s−1 by means of Waveform software of an electronic board (Analog Discovery 2, Digilent, Washington, USA) connected to a personal computer.
5.6. Immunofluorescence staining within uHeart
Immunofluorescence analyses were performed directly within the microdevices on rat and human cardiac microtissues after 5 or 7 days of culture, respectively. Samples were fixed in 4% paraformaldehyde for 30 min and subsequently permeabilized for 1 h at room temperature with 0.1% v/v Triton X-100 (Thermo Fisher Scientific) in a solution of 2% w/v bovine serum albumin (BSA, Sigma Aldrich) dissolved in PBS, to block nonspecific binding. Microtissues were incubated overnight at 4 °C with primary antibodies in a solution of 0.5% w/v BSA: cardiac cells were stained with troponin I (mouse, dilution 1:100; Santa Cruz), fibroblasts and non-myocytes cells with vimentin (rabbit, dilution 1:500; Abcam) and cell–cell electrical coupling was assessed by connexin-43 (rabbit, dilution 1:500; Abcam). Goat anti-mouse (Thermo Fisher Scientific, rodamine conjugated) and goat anti-rabbit (Thermo Fisher Scientific, FITC conjugated) secondary antibodies were diluted 1:200 in 0.5% w/v BSA and incubated in the dark for 6 h at 4 °C. 4',6-diamidino-2-phenylindole (DAPI, Invitrogen) nuclear staining was used to identify cell nuclei. Images were acquired by means of a confocal microscope (Fluoview FV10i, Olympus).
5.7. Quantitative real-time reverse transcriptase polymerase chain reaction (RT-qPCR)
Total RNA extraction using TRIzol (Sigma), complementary DNA synthesis and quantitative real-time reverse transcriptase-polymerase chain reaction (RT-qPCR; 7300 AB Applied Biosystems) were performed according to standard protocols. In detail, after two steps of PBS washing, the uHeart platform was disassembled by manually separating the cell culture layer and the actuation, so to expose the microtissue. An aliquot of 8 µl of TRIzol were then dropped on it and cells were mechanically scratched by means of a pipette tip. The resulting cell-laden fibrin gel dissolved in TRIzol was finally harvested and transferred in a 1.5 ml Eppendorf tube containing 300 µl of TRIzol, to proceed with the RNA extraction, as previously described [18, 60]. Expression levels of the following genes of interest were specifically quantitated (Applied Biosystems): CACNA1C (Hs00167681_m1), SCN5A (Hs00165693_m1), KCNH2 (Hs04234270_g1) and KCNQ1 (Hs00923522_m1). Glyceraldehyde 3-phosphate dehydrogenase (GAPDH) was used as reference housekeeping gene (Hs02758991_g1). Three and six biologically independent samples were considered for t0 (i.e. mix of iCell-CM and fibroblast before their embedding in fibrin) and t7 (i.e. 7 days mechanically trained cardiac microtissues within uHeart), respectively.
5.8. Drug administration
All drugs were purchased from Sigma Aldrich and stock solutions were prepared in dimethyl sulfoxide (DMSO) at 1000× the maximum target concentration. Serum-free medium was used to serially dilute the drug stock solution to reach the desired concentrations for the test. A schematic of the experimental protocol is represented in figure S4(b). Before starting the assay, the cell culture medium was exchanged with fresh serum-free medium: cardiac complete medium for rat microtissues and RPMI supplemented with B27 for human cells. After 30 min, a 3 min baseline signal was recorded. In each microtissue, the drugs were administered at increasing concentrations and were incubated for 10 min before performing a 3 min recording of the FP. After each drug concentration, a 5 min washing with fresh media was performed to prevent drug accumulation. Compounds belonging to different risk category, according to CiPA [61], to develop TdP were tested. In details, for human microtissues the selected compounds were: sotalol (high risk; 1–3.25–7.5–15–30–60 µmol), verapamil (low risk; 1–10–30–50–100–1000 nmol), aspirin (negative control; 1–3–10–30–100–300 µmol) and DMSO (vehicle; 0.1%–0.2%–0.3%–0.4%–0.5%–0.6%). To assess the inter-species differences, rat microtissues were tested with: sotalol (high risk; 7.5–15–30–60 µmol) and verapamil (low risk; 1–10–100–1000 nmol). For each compound, different concentrations were chosen taking into account studies related to MEA system and Cmax in clinics.
5.9. Assessment of field potential alteration
Data were analyzed by means of a custom-made MATLAB code. In order to obtain the characteristic FP curves for each drug concentration, a single recorded signal was firstly smoothened to decrease the noise and then averaged. For each drug, baseline curve and representative traces of averaged FP recorded at incremental drug concentrations were plotted overlaid. From the recorded signals, the following parameters were also quantified: FPD (ms), as the time from the start of the depolarizing spike to the peak of the repolarization wave, the spontaneous beating (RR interval, ms) and the spike amplitude (µV). The FPD was corrected with the Fridericia's method (FPDc = FPD (RR)−1/3) [62]. The percent change in FPDc following each concentration of drug with respect to the baseline was computed and plotted. FP recordings were collected from at least three individual cardiac microtissues (n ⩾ 3) for each drug tested.
5.10. Statistical analyses
The results of the electrical activity monitoring (i.e. the quantified delays between peaks from the two extremities of the microtissues) of rat cardiac microtissues are presented as mean with SD.
The results of RT-qPCR, are presented as mean with SD. Statistical analysis was made by Mann–Whitney test (non-normal distributions; *P < 0.05; **P < 0.01; ***P < 0.001).
The results of FPDc (%) after drug administration are presented as mean with SE. Statistical analysis was made through Kruskal–Wallis with Dunn's multiple comparison test (non-normal distributions; *P < 0.05; **P < 0.01; ***P < 0.001).
Statistical analyses were performed using GraphPad Prism 8.
Acknowledgments
We thank Dr Barbara Bettegazzi for the kind provision of rat cardiac hearts. We are grateful to Dr Aoife Gowran for the provision of human adult dermal fibroblasts. We thank Nicolò Monaco for performing the TEER measurements in the microfluidic device modeling the endothelial BBB. The silicon wafer micropatterning was performed at PoliFAB, the micro- and nanofabrication facility of Politecnico di Milano. This work was supported by the European Commission within the Horizon 2020 Framework through the MSCA IF (Grant #841975), by the Italian Ministry of Health (Project MINSAL3R2016) and by Fondazione Cariplo (Grant Nos. 2012-0891 and 2018-0551).
M R, P O, A R and R V have ownership interest in BiomimX S r l, a Politecnico di Milano spin-off which is owner of µECG patent and has exclusive license of uBeat technology.
M R, P O, R V conceived the project. M R, G S U and R V designed the device. R V, G S U and S P produced the devices and electrodes. R V, G S U and D C M performed the experiments on rat cardiac microtissues. R V and S M performed the experiments on human cardiac microtissues. R V analyzed the biological experiments. S M, E P, P O, R V and M R conceived the pharmacological calibrations. M M, A R, M R, P O and G S U contributed to the interpretation of the results. R V, P O, G S U and M R wrote the manuscript with the input from all authors.
Ethical statement
Animals were involved and euthanized in another study unrelated to this research and approved by the Institutional Animal Care and Use Committee of the San Raffaele Scientific Institute (IACUC 795). All the applicable international, national and/or institutional guidelines for the use of these animals were followed.