

Abstract
Improving the proliferation of probiotics (ca. Bifidobacterium) and inhibiting the growth of pathogenic bacteria (ca. Escherichia coli) is crucial for human health. This study demonstrates the fabrication of core–shell structure fibers using electrohydrodynamic 3D printing to help improve gastrointestinal tract microbial content. These fibers have various geometries and are capable of encapsulating stachyose into cellulose acetate (shell layer) and loading proteoglycan into polyacrylic resin II (core layer). The impact of membrane geometry on drug release behavior and the effect of exchanging the loading site on physicochemical properties of the resulting fibers were studied. The printed fibrous membranes possess a biphasic drug release profile in simulated intestinal fluid with a burst release within the first 12 h and a slower sustained release up to 72 h. The speed order priority for drug release rate of the printed membrane was whole-circle > semi-circle > square. Moreover, the membranes exhibit good biocompatibility on L929 cells and excellent improvement effects on Bifidobacterium bifidum, combining inhibition effects on Escherichia coli. In summary, the dual-drug fibrous membranes presented here and their precision-fabricated patterns pave a new direction for improving the gastrointestinal tract microbial ecosystem health in the human body.

Original content from this work may be used under the terms of the Creative Commons Attribution 4.0 licence. Any further distribution of this work must maintain attribution to the author(s) and the title of the work, journal citation and DOI.
1. Introduction
For humans, the gastrointestinal tract is a complex microbial ecosystem and crucial for maintaining human health [1]. The tract comprises a trillion microbial cells across approximately 1000 species [2]. These cells colonize in the gut in a naturally commensal way [3]. In the order of numerical majority, these bacterial species are classified in the following bacterial phyla: Firmicutes, Bacteroidetes, Actinobacteria, Proteobacteria, Verrucomicrobia and Fusobacteria [4]. The gastrointestinal microbiota can not only provide a source of energy for biogenesis [5] and biosynthesize vitamins [6], but it can also provide essential nutrients and promote digestion of cellulose and angiogenesis [1]. However, the gastrointestinal microbiota can be potentially harmful to the host when the gastrointestinal microbial ecosystem undergoes abnormal changes-symbiosis, resulting in obesity, allergies, diabetes, bowel inflammation, and even cancer [7, 8]. Thus, only in a harmonious symbiotic relationship can the host's well-being be offered from gastrointestinal microbiota.
Probiotic (meaning 'for life') [9], is defined as 'live microorganisms that, when administered in adequate amounts, confer a health benefit on the host' [10]. FAO/WHO confirmed probiotic possessed health-promoting effects on its host by modulating the microbiota [11]. Probiotics provide abundant positive effects on its host health including being helpful for the gut defense system and contributing to maintaining normal gut function [1]. Bifidobacterium genus is one of the most frequently used human probiotics [12]. Previous studies have confirmed that there is a positive correlation between low levels of Bifidobacterium and many diseases. Patients with long-term asthma [13], obesity children [14], or cystic fibrosis [15] have been associated with low levels of Bifidobacterium. While, over dose of pathogenic Escherichia coli (E. coli) will result in bloody diarrhea, dysentery, and urinary tract infection [16], even meningitis et al [17]. Thus by improving Bifidobacterium proliferation and inhibiting E. coli propagation it is possible to modify the gastrointestinal microbial ecosystem and then improve the hosts' health.
Stachyose (STA) belongs to tetrasaccharide, and has proven its advantage in the proliferation of Bifidobacerium as well as in maintaining gut microbiota and anti-cancer therapeutics [18]. Proteoglycan (PRO) is a kind of glycosylated glycoprotein consisting of a core protein that is linked to glycosaminoglycan chain(s) through covalent bonding [19]. The inhibition effect of PRO from Ganoderma lucidum spore powder (GLSP) on E. coli has been confirmed in the works of Zhu et al [20]. Thus, using PRO from GLSP to inhibit the proliferation of E. coli is a reasonable choice to exert the prominent antibacterial effects and minor side effects of the natural products.
Electrohydrodynamic (EHD) 3D printing possesses the benefits that creates well-ordered and customized/personalized geometries through digitally controlled deposition of materials [21, 22]. The advantages of EHD printing over other 3D printing technologies have been demonstrated. EHD 3D printing enables micro to nano scale fiber engineering and alignment using a range of materials; achieved at the ambient temperature [23]. Moreover, this process also enables control and development of complex structures, such as core–shell and Janus fibers, using concentrated organic/polymer solutions [24]. Moreover, printed 3D fibrous films comprise precisely stacked and aligned fibers with varied inter-connected void space or geometry which can impact drug release [25, 26]. Several new types of personalized capsules comprising printed layers, with each layer having a distinctive function or drug component, can be used for targeting and detection applications once given through the oral route [27]. Printed fibrous films can be loaded into an enteric- or gastric-dissolvable capsule. In this work, fibers were encapsulated into an enteric capsule and then tested as a common oral delivery system [28].
Herein, cellulose acetate (CA) and polyacrylic resin II (PRII) were used as excipient materials of enteric-specific medicine due to its good biocompatibility [29], nontoxicity [28], and pH dependent [30] characteristics. The CA encapsulating stachyose (CA-STA) was used as shell while PRII loading proteoglycan (PRII-PRO) was used to form the core of the fibrous structures. The release of PRO is able to inhibit the growth of E. coli, and the release of STA will improve the proliferation of Bifidobacterium. Specifically, the core–shell membrane with three kind of geometries (square grid, semi-circle, and whole-circle) was fabricated and effect of exchange at the loading site between stachyose and proteoglycan on physicochemical properties was investigated. The membrane with these various geometries can be released in a controllable manner and show significant proliferation effects on Bifidobacterium and inhibition effect on E. coli.
2. Materials and methods
2.1. Materials
CA (Mw = 31 104 g mol−1) was obtained from Sigma-Aldrich (St Louis, USA). PRII (powder, viscosity = 13 mPa s, pH = 5.0) and STA (≥85%) were purchased from Shanghai Yuanye Bio-Technology Co., Ltd (Shanghai, China). PRO was prepared from uncracked GLSP and its main components (including amino acids, monosaccharide) have been detailed in previous findings [20]. Ethanol (100%), acetone, N,N-dimethylformamide (DMF), HCl solution, phosphate-buffered saline (PBS, pH = 7.4) were all purchased from Sinopharm Chemical Reagent Co., Ltd (Shanghai, China). Modified eagle medium (MEM) was supplied by Gibco (Gibco, Carlsbad, California, USA); and fetal bovine serum (FBS) was purchased from Sijiqin (Sijiqin, Hangzhou, China). Deionized water (DI water) was obtained in-house from ultrapure water purifier (Millipore Milli-Q, Bedford, USA). Cell Counting Kit-8 (CCK-8) was purchased from Dojindo Molecular Technologies, Inc. (Kumamoto, Japan). E. coli (NW1014 (8099)) was purchased from Nanjing Maojie Microbiology Technology Co., Ltd (Jiangsu, China). Nutrient Broth and Violet Red Bile agar were purchased from Qingdao Hope Bio-Technology Co., Ltd (Shandong, China). Bifidobacterium bifidum (ATCC 29521) and TPY Fluid Medium were supplied by Shanghai Acmec Biochenical Co., Ltd (Shanghai, China). Rhodamine B (≥95%) and BBL agar medium base was purchased from Solarbio Life Science (Beijing, China). All chemicals and reagents of analytical grade.
2.2. Preparation of printing solutions
CA solution was prepared by dissolving CA powder in a mixture of acetone/DMA (acetone/DMF = 1:1, v/v) at a concentration of 20% (w/w) by magnetic stirring (VELP ARE heating magnetic stirrer, Italy) for 12 h at 200 rpm. PRII solution was prepared by dissolving PRII powder in ethanol at a concentration of 20% (w/w) by magnetic stirring for 12 h (at 200 rpm). STA (5 w/w % of CA) was dissolved into 100 μl DI water and then added to the CA solution and mixture under gentle stirring at 100 rpm for 4 h to obtain a homogenous CA-STA solution for EHD printing. PRO (5 w/w % of PRII) was dissolved into 150 μl DI water and then added to the PRII solution and mixture under gentle stirring (at 100 rpm) for 4 h to obtain a homogenous PRII-PRO solution for EHD printing.
2.3. Preparation of PRII-PRO/CA-STA composite membrane
Figure 1(a) shows the coaxial EHD 3D printing apparatus used to prepare the PRII-PRO/CA-STA composite membrane. The EHD 3D printing set-up consisted of a programmable X–Y–Z movement stage, a high power voltage supply (Glassman High Voltage Inc. series FC, USA), two syringe pumps (KD Scientific KDS100, USA), and a coaxial stainless steel nozzle, which consists of inner and outer needles having internal/external diameters of 0.2/0.4 and 0.9/1.2 mm, respectively. The collector was placed on the X–Y–Z movement stage controlled by a mechatronics controller. For EHD 3D printing, the CA-STA solution and PRII-PRO solution were loaded into the outer and inner needle at the speed of 0.45 ml h−1 and 0.15 ml h−1, respectively to form core/shell fiber (figure 1(c)). The distance between the collector and nozzle tip was ∼5 mm, and the voltage applied to the nozzle was 2.5 kV. The printing speed (the movement of collector stage followed a pre-determined pattern) of the pre-determined shape was 20 mm s−1. Three kinds of patterned fibrous membranes (square grid, semi-circle, and whole-circle) with 10-layer deposition (average thickness: 61.5 ± 2.6 μm) were generated. The top view and front view are shown in figures 1(d) and (e), respectively. The inter-connected void space between two fibers was 500 μm and the radius of minimum circle was 3 mm (figure 1(f)).

Figure 1. Schematic diagram of core–shell EHD 3D printing system (a); forming process of continuous core–shell stable-jet mode at different applied voltages (b): i at 0 kV, ii at 1 kV, iii (front view) at 2.5 kV and iv (side view) at 2.5 kV when fiber was printed at 20 mm s−1, respectively; core–shell fiber with two types of drug-loading models (c): i—PRII-PRO/CA-STA, ii—PRII-ST/CA-PRO A; top view of patterned fibrous membrane with various geometries (d): i—square, ii—semi-circle, iii—whole-circle; the front view of patterned membrane (e) corresponding to i, ii, and iii of (d); characteristics of membrane (f): i, the space between two printed fibers; ii, the radius of curves, and iii was the printed fiber with straight line and/or curve.
Download figure:
Standard image High-resolution image2.4. Fiber morphology assessment
The surface morphology of printed membranes was assessed using optical microscope (OM, phoenix BMC503-ICCF, China) and SEM (Quanta FEG650, FEI, Netherland). Before SEM observation, samples were sputter-coated with a gold layer using 108 Auto Cressington Sputter Coater, Ted Pella, Inc. The samples were coated for 60 s with current of 25 mA, and the resulted SEM images were obtained using an accelerating voltage of 20 kV. The fiber diameter distribution was calculated using ImageJ software (National institute of Health, MD, USA) from randomly selected 50 fibers of each structure, and the statistical results was plotted using Original software (Original lab, USA).
2.5. Fourier transform infrared (FT-IR) spectroscopy
The FT-IR spectra of CA, PRII, STA, PRO, and their formulations (CA/PRII, PRII-PRO/CA-STA) were obtained using FT-IR spectroscopy (IR Affinity 1, Shimadzu, Japan). The spectrum of each sample was recorded within the scanning range 4000–400 cm−1 at a resolution of 4 cm−1 with an average of 20 scans.
2.6. X-ray diffraction (XRD)
The physical form of each component (CA, PRII, STA, PRO) and their formulations (CA/PRII, PRII-PRO/CA-STA) were determined using x-ray diffractometer (Gemini A OHra, Oxford Varian, UK). The XRD spectra of samples were obtained via scanning at 2 theta of 3°–65° with deploying step of 0.02° under the analyzing voltage of 40 kV and current of 30 mA.
2.7. Thermogravimetric analysis (TGA)
The thermal stability of each component (CA, PRII, STA, PRO) and each formulation (CA/PRII, PRII-PRO/CA-STA) were investigated using TGA/DSC1 device (Mettler-Toledo, UK). Test results were obtained with the temperature in the range from 30 to 600 °C at heating step rate of 10 °C min−1 under the flow of nitrogen gas.
2.8. Tensile test
The mechanical properties of samples were determined by a universal materials tester (Zwick/Roell Z020, Zwick, Germany). Samples (ca. 20 mm × 20 mm) with various geometries (square, semi-circle, and whole-circle) were performed with a load cell of 500 N and crosshead speed of 10 mm min−1 at 25 °C. The thickness of each sample was measured using a measuring gauge (PD-CT1, Powered Technology Co., Ltd, Beijing, China).
2.9. Contact angle analysis
The hydrophilic properties of the printed membranes was determined using an optical contact angle meter (SJ200KB, KINO Industry Co., Ltd, USA). The water contact angle of resulting membrane was measured using sessile-drop mode with PBS solution at 25 °C and calculate the average value of left and right water contact angle at each time point to represent the angle of each sample. Each experiment was performed in quadruplicate.
2.10. Drug release study in vitro
The drug release behavior of three kinds of geometries (square, semi-circle, whole-circle) fibrous membrane was examined in vitro, which was loaded drug content (5% w/w) theoretically.
The loading capacity (LC) and encapsulation efficiency (EE) of STA or PRO were measured via equations (1) and (2) according to the previous work [31].


where total amount of STA content encapsulated in fibre was measured using UV spectrophotometer (UV-2600 spectrophotometer, Shimadzu, Japan) at a wavelength of 190 nm [32]. The content of PRO was measured at 595 nm using Bradford method [33] through a Bio-Rad protein assay reagent (Bio-Rad, USA).
For the drug release study, PBS (pH = 7.4) was used to prepare simulated intestinal fluid (the release medium) [28]. Briefly, sample (the printed fibrous membrane) was immersed in 10 ml of the release medium and was gently agitated (at 100 rpm) using a thermostatic oscillator (DDHZ-300, Suzhou Peiying experimental equipment Co., Ltd, Suzhou, China) at 37 ± 0.5 °C. At pre-determined intervals, 3 ml of the drug release medium was removed for UV absorbance analysis and this sample was replenished with 3 ml of fresh medium. The concentration of the drug released was calculated according to fitting equation (figure S1 is available online at stacks.iop.org/BF/12/025026/mmedia). Each experiment was performed in triplicate. The cumulative release percentage of STA or PRO was measured by equation (3) [34]:

where, mt was the weight of released agent (STA or PRO) at time point t, ms was the weight of agent (STA or PRO) loaded in the membrane.
2.11. Effects on cell viability evaluation
L929 cells (mouse fibroblasts cell line, obtained from American Type Culture Collection, ATCC) were used to evaluate the biocompatibility of resulting membrane, which provide initial biocompatibility information on sample concentrations [35]. L929 cells were cultured in MEM solution supplemented with 10% FBS and 1% antibiotic-antimycotic in a culture dish (Φ = 10 cm) at 37 ± 0.5 °C, in 5% CO2. The culture medium was changed every 2 days to make the cell proliferate to ∼90% confluence.
The effects of resulting membrane on viability of L929 cells were measured using a CCK-8 kit. Briefly, cells (1.0 × 10⁵ cells ml−1) were seeded into 96-well plates for 24 h and were then co-cultured with various concentration of membranes. Since all samples consist of the same formulation, typical samples (square membrane) were pulverized using a mortar and pestle and were then disinfected using UV irradiation for 4 h. After being co-cultured for 48 h, the optical density (OD) was measured using a microplate reader (Spectra Max 190, NanoDrop, USA) at 450 nm and the cell viability was calculated according to the equation showed in CCK-8 kit manufacture instructions.
To visualize the effects of the printed drug-loaded membrane on cell morphology, fluorescence microscopy (Nikon, Ti-S, Tokyo, Japan) was used to obtain fluorescence image of L929 cells after being incubated with the membranes. Briefly, L929 cells were stained with alexar fluor 546 phalloidin (Invitrogen, Carlsbad, California US) and 4',6'-diamidino-2-phenylindole hydrochloride (DAPI, Invitrogen) staining reagents after being co-cultured with the membrane for 48 h.
2.12. Assessment improvement effects on bifidobacterium and inhibition effects on E. coli in vitro
The ability of the resulting printed membranes on improving proliferation of Bifidobacterium was assessed by aerobically inoculating Bifidobacterium bifidum into TPY medium at 36.5 ± 0.5 °C for 24 h using a biochemical incubator (SHP080, Shanghai Jinghong experimental equipment Co., Ltd). The pulverized and disinfected drug-loaded samples (0.5 g and 1 g of printed membrane) and TPY Fluid Medium (10 ml) were introduced to a test tube. 5 μl of the inoculated TPY suspension was added to the test tube and this was cultured in the biochemical incubator again at 36.5 ± 0.5 °C for 24 h. The control group and negative group (fibers without drug) were performed and compared. Following 24 h culturing, the OD value of B. bifidum was determined using a microplate reader at 650 nm using a modified method that was developed by Lu et al [34, 36]. The pH value of each tube was measured using a pH-meter (inoLab pH, WTW, Germany) and the viable count on the surface of BBL agar medium base was observed using the plate coating method following culture period of 48 h.
The E. coli strain was aerobically pre-cultured in a nutrient broth for 24 h in an incubator. The pulverized and disinfected drug-loading membrane (1 g, 0.5 g) and nutrient broth (10 ml) were added into a test tube. Again, the OD value of E. coli was determined at 650 nm. The strain suspension was used to coat the surface of Violet Red Bile agar and the printed membrane was placed on the coated surface. The inhibition zone was observed following 48 h of culture in the incubator.
2.13. Statistical analysis
All experiments were performed in triplicate for each sample and data is given as mean ± standard deviation (n = 3). Statistical analysis was performed using SPSS software (SPSS Statistics v18, IBM, UK) by Student's t-test. Differences in significance are labeled as *p < 0.05, **p < 0.01, and N.S. (not significant, p > 0.05). All the statistical plots were plotted using Origin software (OrginLab, USA).
3. Results and discussion
3.1. Morphology assessment of drug-loading membrane
Although PRII has been used in tablets [30], the encapsulation of polyacrylic resin into core–shell fibers is still challenge. Therefore, the feasibility of fabricating PRII fibers using EHD 3D printing has been investigated here. As results shown in figure 1(b), a typical Taylor cone was achieved at the optimum electrical potential (∼2.5 kV) at a collection distance of ∼5 mm. The printed fibers with core–shell structure can be observed via optical microscopy by replacing PRO with Rhodamine B into loaded PRII-core layer, as shown in figure 2(a), confirming core/shell structure existing. The diameters of core and shell layers were measured using printed structures shown in figure 2(a). The diameters of inner and outer shell were 10.8 ± 3.7 μm and 61.2 ± 6.2 μm, respectively. The coarser outer shell diameter is due to the difference between outer needle (0.9 mm) compared to the inner needle diameter (0.2 mm). Moreover, the flow rate of outer needle was 0.45 ml h−1, which was higher than that of the inner solution (0.15 ml h−1).
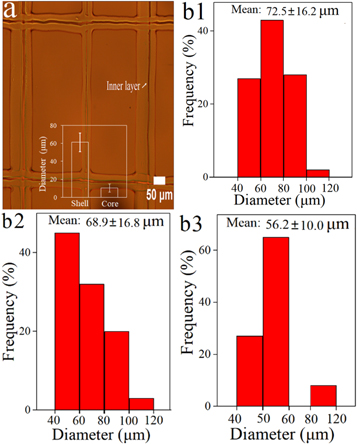
Figure 2. The optical images of printed fibrous membrane with square geometry (a); diameter distribution of fibers with various geometries (b1) square, (b2) semi-circle, and (b3) whole-circle.
Download figure:
Standard image High-resolution imageAlongside this, the impact of geometry of the printed fibrous membrane on the diameter distribution of fiber was also studied. Here, the diameter distribution of the printed fibers with various geometries (square, semi-circle, and whole-circle) were calculated and presented in figures 2(b1)–(b3), respectively. The mean diameters of square, semi-circle, and whole-circle were 72.5 ± 16.2 μm, 68.9 ± 16.8 μm, 56.2 ± 10.0 μm, respectively. This indicates that an increase in the circle proportion (structure) can reduce fiber diameter. When printing a whole-circle structure, the path length between two points linked with curve was longer than that of a straight line (square structure). Thus, when the flow rate is kept constant, diameter of curve line is reduced as can be observed. The printing time is longer for a curve line compared to that or a straight line, when the moving speed is constant. This improved the solvent volatilization in each fiber before multi-layer deposition. Parameters such as working distance, solution concentration and collector movement speed are crucial with fiber morphology as these can affect the drying time of the fibers [37]. Moreover, the mean diameter of non-loaded fibers (figure S2) was smaller than that of corresponding drug-loaded fibers. This is due to the concentration and viscosity of pristine polymer solution being lower which also exhibits a reduced liquid surface tension [38], resulting in thinner fiber diameter.
Figure 3 shows the morphology of the drug-loaded composite membranes. As the optical images (figures 3(a1)–(c1)) shown, ultrafine and aligned fibers were obtained. The SEM images (figures 3(a2)–(c2)) reveal the engineered structures were printed precisely, and the inset images indicate the fibers aligned precisely and possessed smooth surface.

Figure 3. Optical images (a1)–(c1) and scanning electron images (a2)–(c2) of printing fibers loading STA and PRO with various patterns: (a1) and (a2), square; (b1) and (b2), semi-circle; (c1) and (c2), whole-circle.
Download figure:
Standard image High-resolution image3.2. FT-IR, XRD, Tensile test, and TGA results
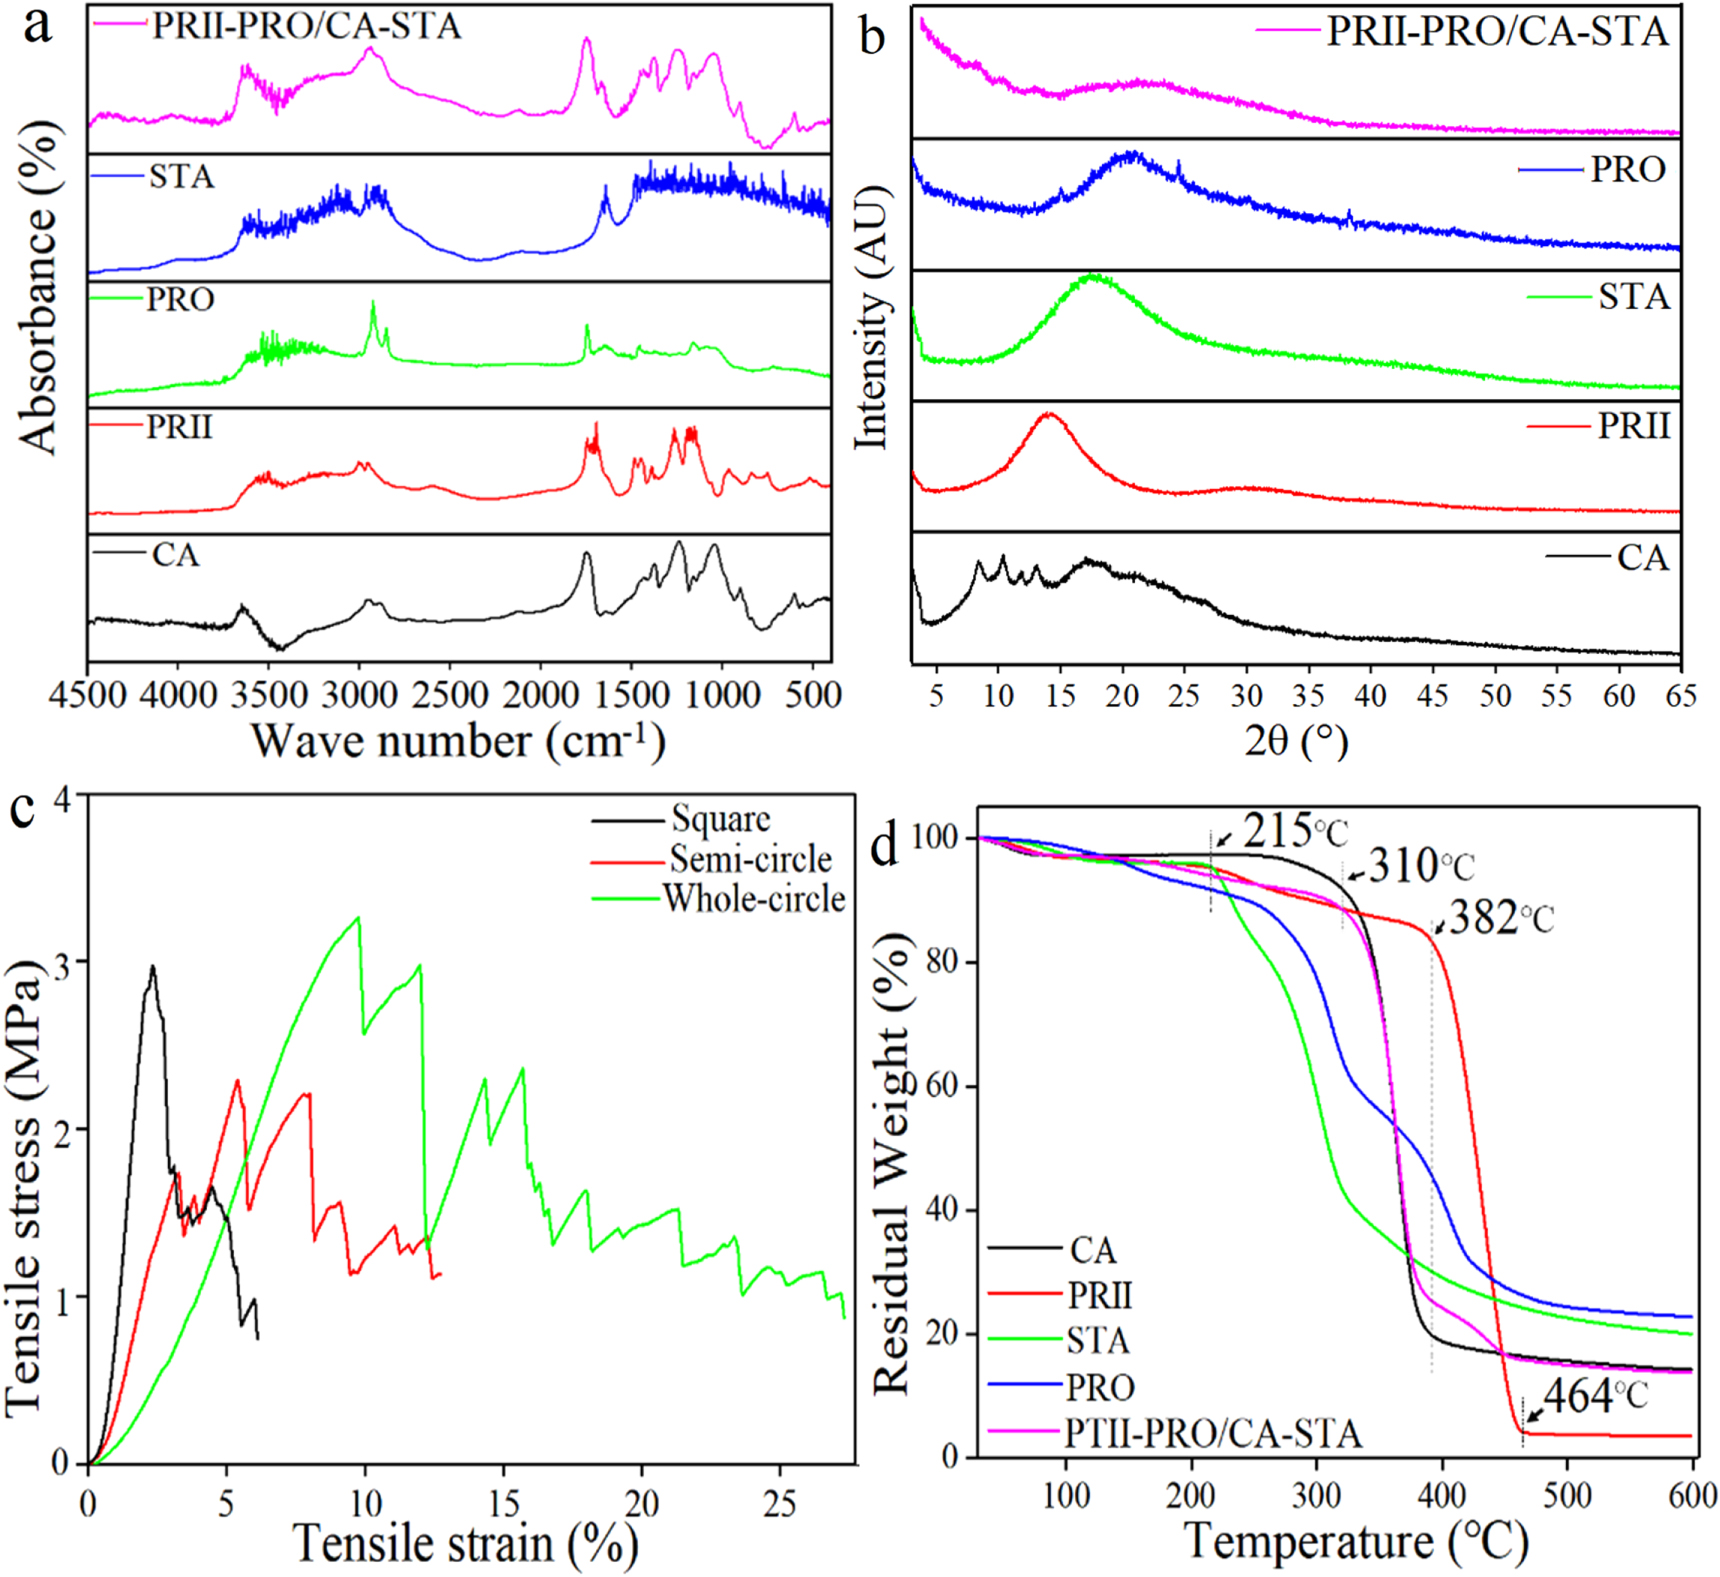
Possible interactions between functional groups in the polymer matrix and loaded drug during the printing process were evaluated using FT-IR technique. FT-IR is an effective and non-destructive method to examine such potential interactions [39]. Figure 4(a) shows the FT-IR spectra of all samples to examine the composition and material stability of membrane. For pure CA, the characteristic absorbance peak at 1755 cm−1, corresponded to the stretching of the C=O bond [40]. The peaks observed at 1373 cm−1 and 1045 cm−1 were symmetric vibration of C–CH3 and single bond vibration of C–O, respectively [41, 42]. For pure PRII, the peak of C–O stretching showed at 1350 cm−1, while the characteristic peak showed at 1720 cm−1 was the overlap of C=O present in the acrylic group and polyamic acid [43]. The FT-IR spectra of PRO, the absorbance peaks showed at 1527 and 1664 cm−1 indicate the presence of amide II and amide I respectively, revealing the presence of a fraction of protein [44]. The sharp absorption peaks located at 2920 and 1620 cm−1 were the vibration of C–H and –COOH, respectively [45]. The FT-IR spectra for pure STA was much more complicated. The strong peaks showed near 3400 cm−1, indicate the inter- and intramolecular interaction between the –OH, –H and polysaccharide chains [46]. For the FT-IR spectra of core/shell composite membrane PRII-PRO/CA-STA, the main characteristic peaks of each component were detected, indicating the membrane loaded with multiple drugs was fabricated successfully and there was no interaction between the components indicating chemical stability during the printing process. This is consistent with the results of Wu et al [28].

Figure 4. FT-IR spectra (a), XRD spectra (b), tensile strain (c) and TGA results (d) of printed fibers and raw materials.
Download figure:
Standard image High-resolution imageXRD (shown in figure 4(b)) is capable of indicating the crystalline nature changes induced by the EHD 3D printing process. For pure CA, four sharp diffraction peaks found at 8.3°, 10.4°, 13.3° respectively indicate the CA powder was semi-crystalline [47]. For pure PRII, STA, and PRO, broad diffraction peaks appeared at around 14.1°, 17.3°, 20.5°, respectively, which indicate these materials (PRII, STA, and PRO) exhibit less crystallinity than CA [39]. The diffraction peak of the printed membrane was is absent, indicating STA and PRO were in an amorphous state in the printed membrane, suggesting this amorphous nature is conducive to drug release [25].
Prior to tensile testing, the thickness of each sample was measured. The thicknesses of square, semi-circle, and whole-circle membranes were 64.4 ± 2.6 μm, 61.9 ± 4.2 μm, and 58.1 ± 2.5 μm, respectively. Figure 4(c) shows tensile curves for all samples where ductile failure can be observed [48]. However, zig-zag patterns in tensile curves are more prominent for membrane sandwich structure shown in figure 4(c). This suggest that the shape and void arrangement of fibers are important factors in the overall mechanical properties of printed structures [28]. The maximum tensile strengths of whole-circle, square membrane, and semi-circle membrane were 3.3 MPa, 2.9 MPa, and 2.3 MPa, respectively. The broken strains of whole-circle, square membrane, and semi-circle membrane were 27.3%, 6.1%, and 12.7%, respectively. It is noted that maximum tensile strengths and broken strains increased as the circle proportion increased. This is most likely due to the fact that the fibers with circular pattern would morph into a straight line under tensile force. In addition to this, the maximum tensile strength of the three kinds of composite membrane was greater than 0.22 MPa [49], which is the gastrointestinal pressure of in humans, indicating the printed membranes can preserve their shape for potential gastrointestinal application.
The results of thermal stability analysis is shown in figure 4(d). For CA, PRII, and composite membrane (PRII-PRO/CA-STA), the weight loss process occurred in three stages. For CA, about 6.7% was lost between 30 °C and 310 °C because of evaporation of trapped moisture and other volatiles in the material. The weight lost (∼71.5%) between 310 °C and 382 °C can be attributed to unzipping of carbon bonds to form low molecular weight volatile organics [43]. For PRII, the initial weight loss event occurred between 30 °C and 380 °C, resulting in 15.8% weight loss with 80.1% being lost between 380 °C and 464.3 °C. The weight loss events of the composite membrane was very similar to that of CA with approximately 10.2% and 56.7% weight being lost during the first and second stage, respectively.
The TGA thermograms of STA and PRO were very similar. The initial weight loss event was mainly ascribed to water absorption on the surface and water bound to polymeric chains [50] whilst the second weight loss event was due to the degradation of the saccharide units [51].
3.3. Contact angle analysis
Contact angle analysis is vital as the degree of hydrophilicity can influence drug release and bio-related applications [52]. The mean value of water contact angle was measured at 4 points of the samples to determine hydrophilicity of the composite membrane. As the results show in figure 5(a), the initial water contact angles for square membrane, semi-circle membrane, and whole-circle membrane were 80.4°, 59.1°, and 52.8°, respectively, indicating all samples possessed adequate hydrophilic characteristics with good wettability as the angles were smaller than 90° [52]. The contact angle values steadily decreased over time from 0 s to 60 s. Moreover, initial contact angles (at 0 s) of membrane composite fibers without drugs were greater than that of the drug-loaded membrane, reaching 104.0°, 102°, and 93.7° for square, semi-circle, and whole-circle, respectively (see figure S3). This confirms that the hydrophilicity of membrane was improved by encapsulating STA and PRO, as they are naturally hydrophilic.

Figure 5. (a) Water contact angle images of fibrous membrane loading drug in the manner of PRII-PRO/CA-STA at various time point: 0 s, 30 s and 60 s, (first column in figure 5(a): top view of patterned membrane with various geometries; red dot presents the position of water drop for water contact angle test); (b) figure (a) expressed with column chart.
Download figure:
Standard image High-resolution image3.4. Drug release
Figures 6(a)–(c) show the printed structures of square membrane, semi-circle membrane, and whole-circle membrane before being encapsulated into capsules (figures 6(a')–(c')). The fibers were encapsulated into an enteric capsule and then tested as a common oral delivery system. The in vitro drug release was carried using PBS solution (pH = 7.4) to mimic intestinal fluid [28]. The LC for STA and PRO was 3.67 ± 0.1% and 1.1 ± 0.02%, respectively; and the EE was 90.3 ± 1.7% and 95.3 ± 0.5%, respectively. This confirms each drug was efficiently loaded into outer layer and inner layer, respectively.

Figure 6. Digital images of printed fibrous membrane with various geometries: (a) square, (b) semi-circle and, (c) whole-circle. The printed fibrous membranes were encapsulated into capsule ((a'), (b'), (c') was corresponding to (a), (b), (c), respectively). Drug release profiles for (a1) STA and (a2) PRO from PRII-PRO/CA-STA (STA and PRO were loaded in outer layer and inner layer, respectively); drug release profiles for (b1) STA and (b2) PRO from PRII-STA/CA-PRO (PRO and STA were loaded in outer layer and inner layer, respectively).
Download figure:
Standard image High-resolution imageAs shown in figures 6(a1) and (a2) (PRII-PRO/CA-STA, STA and PRO were loaded in outer and inner layers, respectively), all samples presented a biphasic release profile which consisted of an initial burst release phase (within 12 h) and a slow release period (12–72 h). Within the rapid release phase (12 h) of STA (figures 6(a1) and (a2)), 78.7 ± 1.9%, 81.5 ± 3.4% and 83.6 ± 2.3% was released from square membrane, semi-circle membrane and whole-circle membrane, respectively. After 72 h, the cumulative release of all membranes was nearly 95 ± 1.2%. With respect to PRO after 12 h (figures 6(a1) and (a2)), 65.4 ± 1.6%, 70.9 ± 2.9% and 76.7 ± 2.8% was released from square membrane, semi-circle membrane and whole-circle membrane, respectively during the rapid release stage. Due to STA being incorporated in CA (insoluble in PBS) and PRO being encapsulated in PRII (soluble in PBS), the dissolution of PRII is conducive to the drug release. This demonstrates that the varied geometry of membrane matrix affects the drug release behavior, confirming the modulation of drug release through geometry of matrix.
To explore the effects of the drug location in core–shell fibers on release performance, we exchanged the drug loading site: encapsulating STA into PRII-core layer and loading PRO into CA-shell layer. As the results show in figures 6(b1) and (b2), the release profiles were biphasic and similar to the results showed in figures 6(a1) and (a2). Comparing the cumulative release results of the drug before and after exchange loading site, it is clear to see that the release of STA in the core layer was faster than it did in the shell layer. However, the opposite was observed with PRO (figures 6(b1) and (b2)). The release from the shell layer was quicker than the release from the shell. This probably due to the excellent water solubility of STA [53] combined with dissolution of PRII. The PRO loaded in the outer shell layer makes it dissolve faster than in the core layer due to increased contact area of outer layer to release medium. Another thing to note is the release of STA and PRO from the same patterned fibrous membrane is shown in figure S5.
To explore the STA/PRO release mechanisms, the release profiles were fitted to the Korsmeyer-Peppas model (figures S6 and S7) [54]. As shown in table 1, the correlation coefficient (R2) indicates the release of STA and PRO from fibrous membrane with loading drug manner of PRII-PRO/CA-STA was primarily dominated by Non-Fickian transport (n > 0.45) except for STA release from whole-circle geometry, which was dominated by Fickian diffusion (n < 0.45). Swapping the drug loading site still found drug release to be dominated by Non-Fickian diffusion (n > 0.45) mainly (table 2). This is due to water solubility of PRII being greater than that of CA, and this influences STA release from the core layer [54].
Table 1. Fitting parameters of STA and PRO from fibrous membrane with loading drug manner of PRII-PRO/CA-STA.
| STA | PRO | |||||
|---|---|---|---|---|---|---|
| Square | Semi-circle | Whole-circle | Square | Semi-circle | Whole-circle | |
| n | 0.5612 | 0.4645 | 0.4286 | 0.6393 | 0.6043 | 0.5743 |
| R2 | 0.9456 | 0.9273 | 0.9604 | 0.9714 | 0.9692 | 0.9684 |
| k | 27.41 | 32.42 | 38.36 | 18.56 | 21.99 | 26.30 |
| Drug transport mechanism | Non-F.T. | Non-F.T. | Fickian diffusion | Non-F.T. | Non-F.T. | Non-F.T. |
Table 2. Fitting parameters of STA and PRO from fibrous membrane with loading drug manner of PRII-STA/CA-PRO.
| STA | PRO | |||||
|---|---|---|---|---|---|---|
| Square | Semi-circle | Whole-circle | Square | Semi-circle | Whole-circle | |
| n | 0.6843 | 0.5507 | 0.4597 | 0.5904 | 0.5553 | 0.5042 |
| R2 | 0.9618 | 0.9468 | 0.906 | 0.9498 | 0.9538 | 0.9673 |
| k | 29.37 | 41.67 | 48.63 | 23.98 | 27.83 | 31.78 |
| Drug transport mechanism | Non-F.T. | Non-F.T. | Non-F.T. | Non-F.T. | Non-F.T. | Non-F.T. |
F.T. : Fickian transport.
The SEM images of fibers with square pattern following in vitro release (figure S4(a)) showed uneven morphology, which may be due to the solution of loaded drug. The SEM images of cross-section images (figure S4(b)) show hollow structures (labeled with red circle), which was due to the dissolution of the inner layer (PRII-PRO). This further verifies the core–shell structure of the printed fibers. The proportion of core layer was much smaller than the shell layer, which is due to the internal needle diameter was 0.2 mm and inner solution speed was 0.15 ml h−1.
3.5. Biocompatibility evaluation
The effect of composite membrane on the cell viability of L929 cells was used to evaluate the biocompatibility of printed membranes using typical square membranes. As the results show (figure 7(a)), the treatment groups with various concentration (0.1, 1, 10 mg ml−1) exhibited promising effects on cell viability. For the concentration of 1 mg ml−1, 137.8% and 146.5% cell viability was obtained from the treatment of PRII-PRO/CA-STA and PRII-STA/CA-PRO, respectively. This is attributed to proteins found in PRO, which exhibit good mitogenic activity [55] and protective effect on DNA [56]. Additionally, the cell viability with the treatment of 10 mg ml−1 was lower than that of 1 mg ml−1. This may be attributed to that the higher concertation (10 mg ml−1) increased the osmotic pressure of the environment around the cells, which could partially inhibit cell proliferation due to the Warburg effect and inhibit mitochondrial activity [57].

Figure 7. (a) Effects of printing membrane on the cell viability of L929, (b) fluorescent micrographs of L929 cells co-cultured with membranes loading drug manner of PRII-PRO/CA-STA with various patterns.
Download figure:
Standard image High-resolution imageThe effects of the drug-loaded membranes on L929 cells morphology can be visualized through fluorescence images (figure 7(b)). It can be seen that the L929 cells in all samples exhibited uncompromised cellular structures and extended morphology in all various printed patterns. The L929 cells were able to proliferate vividly both around the membrane and on the surface of membrane. The cells also proliferated very well when co-cultured with the drug-loaded membranes with the drug loading sites exchanged (PRO loaded in outer layer and STA loaded in inner layer (figure S8)). This shows that both composite membranes (PRII-PRO/CA-STA, PRII-STA/CA-PRO) possessed good biocompatibility.
3.6. Improvement effects on Bifidobacterium bifidum
The OD value at 650 nm of TPY Fluid Medium inoculated B. bifidum was total number of bacteria. As shown in figure 8(a), the OD values of treatment of PRII-STA/CA-PRO at 0.1 g and 0.05 g was 294.2 ± 13.1% and 288.8 ± 7.8%, respectively. The treatment of PRII-PRO/CA-STA of 0.1 g and 0.05 g, the OD value was 242.7 ± 9.8% and 228.8 ± 7.7%, respectively. These results indicate that the improvement effect of drug-loaded membrane on B. Bifidum was significant. This may be attributed to the excellent growth-promoting effect of stachyose, which can enhance the Bifidobacterium proliferation speed (approximately ×40) by increasing the activity of α-galactosidase [58, 59].

Figure 8. (a) Effects of composite square membrane on OD value of Bifidobacterium bifidum, pH of TPY Fluid Medium after being co-cultured for 24 h (b) and 48 h (c); plate Bifidobacterium bifidum treated by (d) unloaded membrane and (e) drug-loaded membrane on BBL agar medium base using plate coating method with cultured for 48 h.
Download figure:
Standard image High-resolution imageThe effects of stachyose on the pH values corresponded with the total number of bacteria in TPY Fluid Medium. Among them, the corresponding pH value decreased in a time-dependent and concentration-dependent manner. With the treatment of PRII-STA/CA-PRO of 0.1 g, the pH values were 3.88 ± 0.07 and 3.84 ± 0.06 at 24 h and 48 h (figures 8(b) and (c)), respectively. The pH value was recorded at 4.01 ± 0.05 and 3.97 ± 0.03 after 24 h and 48 h, respectively, when the concentration of PRII-STA/CA-PRO decreased to 0.05 g. The decrease in pH could be as a result of fermentation products (e.g. lactic acid) of carbohydrate by B. bifidum, confirming the growth of B. bifidum. This is consistent with the results of Shu et al [59], although the differences between treatment groups and control were not significant, which may be mainly attributed to lactic acid is monobasic weak acid [60]. The pH value was lower with the treatment of PRII-STA/CA-PRO than that of PRII-PRO/CA-STA, which may be due to that the release rate of stachyose was much rapider when it was loaded into the core layer (as drug release results shown). This implied that the proliferation effects on B. bifidum of PRII-STA/CA-PRO was better than that of PRII-PRO/CA-STA.
As figure 8(e) shown, the viable colony counts on the agar surface of the treatment groups are much denser than that of control and negative groups (figure 8(d)), confirming the proliferation of B. bifidum was enhanced by stachyose. There was a significant difference between the treatment of PRII-STA/CA-PRO and of PRII-PRO/CA-STA, which may be due to issues with analyzing viable counts in different size petri dishes.
Since the proliferation effects on B. bifidum of PRII-STA/CA-PRO was better than that of PRII-PRO/CA-STA, the proliferation effects of drug-loading (PRII-STA/CA-PRO) semi-circle and whole-circle membrane on B. bifidum were explored. The OD values (figure S9(a)) were recorded at 285.2 ± 12.1% and 277.8 ± 9.8%, respectively at 0.1 g treatment of semi-circle and whole-circle membrane. The pH values were 3.83 ± 0.06 and 3.8 ± 0.06 at 48 h (figure S9(d)), respectively at the treatment of 0.1 g semi-circle and whole-circle membrane, respectively. Besides, the proliferation effects on B. bifidum was visible colony counts on the agar surface of the treatment of semi-circle and whole-circle drug-loading membrane (figures S10(c) and (d)).
3.7. Inhibition effects on E. coli
The total number of E. coli on Nutrient Broth was compared with control and the results showed the inhibition effects of printed square membrane on the bacteria. As shown in figure 9(a), the OD value of treatment of PRII-STA/CA-PRO with 0.1 g and 0.05 g were 63.0 ± 3.4% and 90.8 ± 4.4%, respectively, with respect to the control. For the treatment of CA- STA/PRII- PRO with 1 g and 0.05 g, the OD values were 63.5 ± 7.9% and 85.5 ± 6.1%, respectively. This indicates the improvement effect of drug-loading membrane on E. coli was significant. This may be attributed to antibacterial activity of proteoglycan [61, 62]. The inhibition mechanism here is based on the binding of proteoglycan resulting in proteins and essential nutrients within the E. coli cells leaking, causing apoptosis [63].

Figure 9. (a) Effects of membrane of OD value of E. coli, plate Violet Red Bile agar treated by (b) unloaded and (c) drug-loaded membrane on BBL agar medium base using plate coating method with cultured for 48 h.
Download figure:
Standard image High-resolution image
The OD value for the treatment of PRII-PRO/CA-STA (STA loaded in outer layer, PRO loaded in inner layer) was a little higher than that of PRII-STA/CA-PRO, indicating the inhibition effects of the former was a little weaker than that of latter. This may be due to the release rate of PRO loaded in outer layer was quicker than that of in inner layer, just as the drug release results showed.
The inhibition effects of printed membrane on E. coli can be visualized in the results showed in figure 9 and blank control group (Violet Red Bile agar only) showed in figure S10b. Compared to the control and negative group (figure 9(b)), a clear inhibition zone is observed in each of the treatment groups. It confirmed the printed membranes possessed adequate inhibition effects on E. coli. The inhibition effects of drug-loading (PRII-STA/CA-PRO) semi-circle and whole-circle membrane on E. coli was showed in figures S9 and S10. The OD value (figure S9(b)) of treatment of semi-circle and whole-circle membrane with 0.1 g were 69.0 ± 3.2% and 67.5 ± 7.1%, respectively, with respect to the control. The inhibition effects were visible from the less dense E. coli colony counts (figure S10(e) and (f)).
4. Conclusions
In this study, a novel treatment system for improving gastrointestinal tract microbial ecosystem in humans was investigated. Core–shell CA-STA/PRII-PRO membranes with hybrid patterns were successfully developed using EHD printing. The speed order priority for drug release rate of the printed membrane was whole-circle > semi-circle > square, which confirmed the modulation of drug release via the geometry of the membrane matrix. The printed drug-loaded membrane possessed good biocompatibility on L929 cells and excellent improvement effects on Bifidobacterium bifidum, alongside adequate inhibition effects on E. coli. Compared to the control, the proliferation ratio of Bifidobacterium bifidum can be raised to 294.2% and 242.7%, respectively, at the treatment of 0.1 g PRII-STA/CA-PRO and PRII-PRO/CA-STA. The inhibition effects on E. coli was 37.0% and 27.5%, at the treatment of 0.1 g PRII-STA/CA-PRO and PRII-PRO/CA-STA, respectively. This result confirmed the feasibility of improving proliferation of probiotics (Bifidobacterium bifidum) combining with inhibiting growth of pathogenic (E. coli) in a single dosage for using dual drug loading. The core–shell structures developed here can be extremely advantageous in efficient therapy for gastrointestinal conditions.
Acknowledgments
This work was financially supported by the National Nature Science Foundation of China (No. 81771960), the Fundamental Research Funds for the Central Universities (2017QNA5017) and Key Technologies R&D Program of Zhejiang Province (2015C02035).
Declaration of interest
There are no conflicts to declare.