
Abstract
The first and most crucial step in breath research is adequate sampling, which plays a pivotal role in quality assurance of breath datasets. In particular, the emissions or uptake of volatile organic compounds (VOCs) by sampling interface materials present a risk of disrupting breath gas samples. This study investigated emissions and uptake by three interface components, namely a silicon facemask, a reusable 3D-printed mouthpiece adapter, and a pulmonary function test filter compatible with the commercial Respiration Collector for In-Vitro Analysis (ReCIVA) breath sampling device. Emissions were examined before and after (hydro-)thermal treatment of the components, and uptake was assessed by exposing each material to 12 representative breath VOCs comprising alcohols, aldehydes, ketones, carboxylic acids, terpenes, sulphurous and nitrogenous compounds at different target concentration ranges (∼10 ppbV and ∼100 ppbV). Chemical analyses of VOCs were performed using proton transfer reaction-time-of-flight-mass spectrometry (PTR-TOFMS) with supporting analyses via thermal desorption comprehensive two-dimensional gas chromatography-TOFMS (TD-GC×GC-TOFMS). The filter exhibited the lowest overall emissions compared to the mask or adapter, which both had equivalently high emissions (albeit for different compounds). Treatment of the materials reduced the total VOC emissions by 62% in the mask, 89% in the filter and 99% in the adapter. Uptakes of compounds were lowest for the adapter and most pronounced in the mask. In particular, 1-butanol, acetone, 2-butanone, 1,8-cineole and dimethyl sulphide showed negligible uptake across all materials, whereas ethanol, nonanal, acetic acid, butanoic acid, limonene and indole exhibited marked losses. Knowledge of emissions and/or uptake by sampling components is key to reducing the likelihood of erroneous data interpretation, ultimately expediting progress in the field of breath test development.
Export citation and abstract BibTeX RIS

Original content from this work may be used under the terms of the Creative Commons Attribution 4.0 license. Any further distribution of this work must maintain attribution to the author(s) and the title of the work, journal citation and DOI.
1. Introduction
The detection of chemical constituents in exhaled breath as biomarkers of disease has received growing interest in recent years, with a variety of tests currently established and in use [1]. For any breath test to become viable in the clinical setting once a set of prospective biomarkers for a specific illness or physiological condition has been identified, however, an essential requirement is an understanding of the factors that influence the presence of these constituents within the complex matrix of exhaled breath, which is a rich medium comprising inorganic and organic compounds of a diverse chemical nature [2]. Embedded in this challenge is the need to decipher the degree to which physical components and equipment used to collect exhaled breath disrupt the sample.
Despite the apparent simplicity of breath tests, the collection of an uncompromised sample of breath is far from trivial, yet is essential for establishing a reproducible test. The sampling approach is foremost dictated by the choice of which analytical platform is used to subsequently analyse the exhaled breath constituents [3]. Scrutinizing exhaled breath gas for its volatile constituents via offline analysis, i.e. analysis after its prior separate collection, remains the most prevalent approach, with the collection and preconcentration of exhaled volatile organic compounds (VOCs) onto adsorbent tubes followed by their subsequent thermal desorption (TD) and analysis by gas chromatography-mass spectrometry (GC-MS) [4, 5]. Sampling breath volatiles onto adsorbent tubes is commonly made by first collecting exhaled breath gas in a sampling bag (inflated through direct exhalation into the bag) and subsequently purging this gas from the bag through the tube, typically using a vacuum pump and flow regulator. More sophisticated commercial devices exist, too, notably the Respiration Collector for In-Vitro Analysis (ReCIVA) breath sampler from Owlstone Medical Ltd (Cambridge, UK). The ReCIVA device utilizes a capnography-driven, software-controlled protocol to sample breath onto the tubes [6].
Sampling exhaled breath intrinsically requires the use of an interface between the breath donor (e.g. patient) and the breath collection device. The ReCIVA breath collector is conventionally fitted with a semi-flexible silicon facemask that offers a snug fit over the mouth and nose of the participant and allows for rebreathing through the device in combination with a dedicated clean air supply (with the intention of eliminating or minimizing environmental confounders), with collection of breath onto up to four adsorbent tubes simultaneously [6–8]. Recently, an alternative sampling interface for use with the ReCIVA device has been proposed in the form of a mouthpiece adapter—and a similar configuration is now also offered by the device manufacturer—to overcome certain drawbacks associated with the silicon facemasks [9]. This adapter, which can be produced using a 3D printer, represents a cost-effective and reusable alternative to the mask that ensures controlled exhalation through the mouth and reduces the likelihood of direct contact between the patient and the sampling tubes as a potential route of infection and cross-contamination between patients [9].
A breath sampling interface must foremost ensure patient safety by introducing a sterile barrier that reduces the risk of transmission of pathogens between patients using the same collection device. Beyond this essential feature, the interface must fulfil other needs. These include a low level of emissions of volatiles to avoid health risks to patients through inhalation exposure [10] and to limit the presence of material-derived confounders in analytical datasets [6], either through direct emissions during sampling or as exogenous confounders that are inhaled and subsequently exhaled by the patient. In addition—and often overlooked—the degree of adsorption of volatiles onto the wetted surfaces of the interface materials must be known and minimized to avoid losses of prospective biomarkers that are typically present in breath at only trace concentrations. Consequently, knowledge of the emissions and/or uptake of volatiles from or to sampling interface materials is essential for quality assurance in breath sampling.
The present work explores the emissions and uptake of volatiles associated with three materials used for conventional breath sampling. The interface materials are compatible for use with the ReCIVA sampling device, specifically the commercial silicon facemask (supplied with the device), a 3D-printed mouthpiece adapter, and a pulmonary function test (PFT) filter (required for use in combination with the mouthpiece adapter). Each material was scrutinized for its constituent VOCs emitted under simulated breath-sampling conditions, both prior to and after treatment procedures (e.g. baking or autoclaving). In addition, the uptake via adsorption of selected representative compounds previously reported in the human breath volatilome was investigated to estimate the risk of losses of prospective exhaled biomarkers to the interface materials during routine breath sampling. The emissions or uptake of VOCs were analysed via two approaches. Proton transfer reaction-time-of-flight-mass spectrometry (PTR-TOFMS) was used for inline VOC analysis via a bespoke sampling configuration that exposed the interface components to either humidified air (emissions analyses) or a humidified air mixture containing selected target volatiles at defined concentrations (uptake analyses). These experiments were complemented by comprehensive two-dimensional gas chromatography time-of-flight mass spectrometry (GC×GC-TOFMS) analysis of VOCs emitted from the materials using an emissions chamber configuration, used to verify the PTR-TOFMS data.
2. Methods
2.1. Breath sampling interfaces
Three interface components were investigated in the present work: a commercial silicon facemask (Owlstone Medical Ltd, Cambridge, UK), a 3D-printed adapter fabricated from a commercial resin (Surgical Guide; Formlabs Inc., Somerville, MA, USA) using a stereolithography printer (Form 3B; Formlabs Inc.) via procedures that have been previously described [9], and a PFT filter (MicroGard II, Vyaire Medical Inc., Mettawa, IL, USA) for use in combination with the mouthpiece adapter in breath sampling applications. The configurations of the ReCIVA device with either the conventional facemask or the novel adapter and filter assembly is depicted in figure 1.
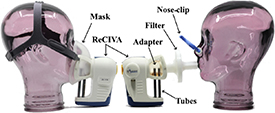
Figure 1. Lateral views of the ReCIVA breath sampling device equipped either with the conventional silicon mask (left) or the novel 3D-printed mouthpiece adapter used in conjunction with the pulmonary function test filter, with use of a nose-clip (right), including the assembled thermal desorption tubes.
Download figure:
Standard image High-resolution imageThe silicon facemask—referred to henceforth as mask—was used either intact for the uptake analyses or as a small segment that was cut from the mask for the emissions analyses, whereby this piece had a similar surface area to the other sample materials. For the 3D-printed adapter—referred to in the following as adapter—two models with different dimensions were printed to accommodate the requirements for performing either the emissions or the uptake analyses. One model—for examining compound uptake and emissions under simulated conditions—was a slightly conical tube of 70 mm length and 26 mm outer diameter (OD) that tapered to 22 mm OD from one end to the other with a constant wall thickness of 2 mm The other model—used for analysing VOC emissions under controlled conditions—was a cylindrical tube of 30 mm length, 34 mm OD, and with an inner diameter (ID) that decreased slightly along its length from 30.4 mm to 29.4 mm; note that all measurements for the uptake and emissions analyses under simulated conditions reused the same adapter. The PFT filter—subsequently referred to as filter—was used directly, unmodified, for the uptake analyses, whereas the emissions measurements required that a small section of material be cut from the filter, with the dimensions of this piece approximating those of the corresponding 3D-printed adapter. Samples of the filtering fabric materials integrated into both the PFT filter and silicon facemask for sterility purposes were included in the respective analyses.
2.2. Material treatments
The commercial components, i.e. the mask and filter, were supplied by their respective manufacturers in conditions suitable for immediate use. Nevertheless, these were additionally baked out at 78 °C for 12 h in subsequent experiments to examine the effects of thermal treatment on reducing VOC emissions. In contrast, the adapter underwent specific cleaning procedures after production, which involved rinsing with 2-propanol (isopropyl alcohol; IPA)—a standard treatment for 3D-printed models—and then autoclaving (hydrothermal treatment), as is required for its use in biomedical applications, such as breath sampling, and has been described previously [9]. Autoclaving was not undertaken on the mask or the filter to avoid damaging the integrated sterility filter fabrics, as well as to ensure the structural integrity of the filter, which is prone to deform at higher temperature.
2.3. Emissions experiments
Measurements of volatile emissions from the individual breath sampling interface components were performed via two different approaches, either in a simulated breath sampling scenario using a modified gas calibration system or under controlled conditions using an emissions micro-chamber. The quantitative data presented in this paper derive from analyses using the former configuration, whereas the latter procedure was used only to support compound identification, with no explicit data presented. Both approaches are described in the following.
2.3.1. Simulated conditions
Sampling under simulated exhalation conditions utilized a modified system for calibrating analytical instrumentation to directly connect and purge each individual interface component with humid gas; this configuration was similarly used for the compound uptake measurements, as described below. Specifically, a liquid calibration unit (LCU-a (advanced model), IONICON Analytik GmbH, Innsbruck, Austria) was used to generate humidified air for exposure to the interface parts and as a carrier gas for the ensuing emissions. A schematic representation of the test configuration for simulated conditions is depicted in figure 2. The LCU micro-pump was connected to a vial of distilled water that was drawn through the pump and subsequently vaporized via a nebulizer into the cylindrical evaporation chamber of the unit, held at 110 °C and purged with pressurized (5 bar) synthetic air (Linde GmbH, Pullach, Germany) at a rate of 1 l min−1. The standard 1'' OD perfluoroalkoxy (PFA) tube insert of the LCU evaporation chamber, which ends flush with outer housing of the unit, was replaced by a similar tube with the same OD but 6 cm longer, such that it protruded beyond the outer housing. This modification was made in order to allow the gas exiting the oven, which was saturated with water vapour, to cool from 110 °C to ca. 40 °C, thereby approximating the temperature of exhaled breath, reported to be up to 34 °C [11, 12]; consequently, due to this slightly elevated temperature compared to breath gas, this simulated scenario represents extreme exposure conditions of the sampling interfaces. Each breath sampling interface was individually fitted directly to the end of this tube insert for emissions (or uptake) measurements, as shown in figure 2. The PTR-MS transfer line was then connected downstream of the interface for continuous, online analysis of VOCs being stripped from the materials by the warm and humid carrier gas. For the case of the mask, this was placed in a 180 ml PFA beaker (AHF Analysentechnik AG, Tübingen, Germany) at the end of the modified LCU evaporation chamber tube insert to enable humidified gas to pass across the mask material prior to sampling and analysis. Humid gas samples were additionally measured prior to each experiment (in the absence of the respective sampling interface) in order to determine baseline conditions.

Figure 2. Measurement configuration to expose the individual interface components (adapter, filter or mask) to humidified air (emissions analyses) or selected target compounds (uptake analyses). The adapter and filter could be fitted directly between the liquid calibration unit (LCU) and the analyser, whereas the mask was placed inside a beaker to achieve inline exposure and analysis.
Download figure:
Standard image High-resolution image2.3.2. Controlled conditions
Sampling of emissions under controlled conditions was carried out using a commercial micro-chamber/thermal extractor (μ-CTE) system (μ-CTE250, Markes International Ltd, Llantrisant, UK), which comprised four individual 114 cm3 chambers that were heated to 40 °C and flushed with nitrogen (purity 5.0; Linde GmbH; ∼33% relative humidity at 25 °C) at a controlled rate of 60 ml min−1, as reported previously [10, 13]. Analyses via this configuration were used to provide qualitative data on VOC emissions to support the quantitative data from the simulated measurements. Analyses proceeded by placing a sample individually in one of the pre-heated micro-chambers, allowing it to warm up to the temperature of the chamber and equilibrate under static conditions (i.e. without a gas flow through the chamber) for 15 min prior to sampling. After equilibration, sampling commenced by purging the chamber gas (sample headspace) through an adsorption tube attached to the lid of the chamber for 12 min (equating to a total flushed volume of 0.72 l headspace gas, for subsequent analysis by GC-MS). Gas from the empty chamber was additionally sampled prior to each measurement in order to determine system blanks. After each measurement, the individual micro-chamber was purged with clean nitrogen gas to reduce carry-over of volatiles from one experiment to the next; memory effects were further minimized through randomized use of the individual chambers for the single measurements over the course of the investigation. Adsorption tubes for GC-MS analysis were stainless-steel Tenax TA tubes (Markes International Ltd) that were conditioned and sealed prior to use according to the standard procedures, as reported in recent studies [10, 13]. The same 20 tubes were used randomly across all measurements to minimize potential batch variations. Additional analysis through direct connection of the PTR-TOFMS inlet to the μ-CTE using a bespoke interface (described previously [13]) were made to cross-check the GC-MS data with the PTR-TOFMS emissions data from the simulated conditions.
2.4. Uptake experiments
The uptake experiments used the same configuration as the emissions measurements under simulated conditions (described in 2.3), albeit with the LCU set up to supply a gas mixtures containing selected reference compounds as representative constituents of the human breath volatilome, as listed in table 1. These compounds covered different chemical classes for exposure to the individual breath sampling interface materials and have been previously reported to be present in breath (references in table 1). The mechanism for establishing this defined gas mixture is described elsewhere [14], but in short, aqueous solutions containing reference compounds at specified concentrations are steadily vaporized into the LCU evaporation chamber via a nebulizer at defined liquid (5–50 μl min−1) and carrier gas (1000 ml min−1) flow rates and pressure (5 bar) to generate a continuous, stable gas-phase concentration of those compounds. It should be noted that these concentrations reflect the typical trace abundances of volatiles in breath, rather than simulating previously reported levels of each individual compound.
Table 1. Representative compounds of different chemical classes used to explore uptake by the individual breath sampling interface materials.
| Chemical class | Compound | Signal (m/z) | Elemental composition | LOD (ppbV) | Exposure concentration (ppbV) | References | |
|---|---|---|---|---|---|---|---|
| Low | High | ||||||
| Alcohol | Ethanol | 47.046 | C2H6O | 6.3 | <LOD | 58.3 | [16–18] |
| 1-Butanol | 57.069 | C4H10O | 1.1 | 7.1 | 83.9 | [19, 20] | |
| Aldehyde | Acetaldehyde | 45.033 | C2H4O | 2.4 | 9.5 | 95 | [17, 18] |
| Nonanal | 143.134 | C9H18O | 7.6 | <LOD | 39.4 | [20, 21] | |
| Ketone | Acetone | 59.049 | C3H6O | 1.6 | 9.9 | 91.6 | [22, 23] |
| 2-Butanone | 73.058 | C4H8O | 0.5 | 10.8 | 100.2 | [24, 25] | |
| Carboxylic acid | Acetic acid | 61.028 | C2H4O2 | 1.8 | <LOD | 29.2 | [23, 24] |
| Butanoic acid | 89.038 | C4H8O2 | 0.7 | 1.4 | 37.1 | [26, 27] | |
| Terpene | Limonene | 81.067 | C10H16 | 2.2 | 7.7 | 66.8 | [28–30] |
| 1,8-Cineole | 81.067 | C10H18O | 0.6 | 10.3 | 99 | [31, 32] | |
| Sulphurous/nitrogenous | Dimethyl sulphide | 63.026 | C2H6S | 1.2 | 10.2 | 99.3 | [33, 34] |
| Indole | 118.065 | C8H7N | 0.1 | 3.6 | 67.3 | [33, 35] | |
a The detection of compounds with identical m/z signals in PTR-TOFMS analysis was achieved through the use of separate mixtures. b References represent selected examples of publications in which these compounds have been reported to be observed in exhaled breath. LOD: limit of detection of the analytical configuration and analyser. Entries listing <LOD indicate that the exposure concentration of the respective target compound was below the LOD of the PTR-TOFMS for the associated configuration.
Aqueous mixtures of the target compounds were prepared at solution concentrations that would yield gas-phase concentrations of either approximately 10 or 100 ppbv. Due to modifications of the LCU evaporation chamber (extending beyond the heated housing), however, subsequent condensation on the protruding section led to losses (adsorption) of the target compounds within this system prior to connection of the individual interfaces, thus the actual gas-phase concentrations to which the interfaces were exposed were generally lower, as listed in table 1. Accordingly, the degree of uptake of each target compound from the individual interface material was estimated in relation to the reduced exposure (baseline) concentration, measured in the absence of the interface. After the gas containing the representative target compounds passed through the individual sampling interface it was drawn into the PTR-TOFMS at a flow rate of 60 ml min−1 for immediate, continuous analysis. Each analysis proceeded for 12 min to simulate a common duration for breath sampling [8, 15]. Measurements performed in the absence of the sampling interfaces represented baseline levels of exposure. Uptake experiments were performed only on the interface materials after undergoing treatment, as this represents the optimum situation for practical use in breath sampling.
2.5. Analysis of volatiles
Chemical analysis of VOC emissions or uptake from or by the sampling interfaces was made using PTR-MS (emissions under simulated conditions and uptake measurements) or GC-MS (emissions under controlled conditions). A commercial PTR-TOFMS instrument (PTR-TOF 8000, IONICON Analytik GmbH) was operated at reaction chamber (drift tube) conditions of 2.2 mbar pressure, 80 °C temperature, and drift and extraction voltages of 555 V and 34 V, respectively, resulting in E/N of 129 Td (1 Td = 10−21 V m–2). The data acquisition rate was set to 8 s. For the uptake measurements, the PTR-TOFMS instrument was calibrated using standard mixtures of the representative compounds listed in table 1. Calibration measurements were performed via the conventional use of the LCU with aqueous mixtures of the target compounds.
Qualitative analyses of the interface materials' emissions under controlled conditions were made via TD-GC×GC-TOFMS. These analyses proceeded as follows: after sampling onto adsorption tubes, these were sealed with DiffLok caps (Markes International Ltd) and were subsequently loaded onto a TD unit in combination with an autosampler (Unity-XR and Ultra-XR, respectively; both Markes International Ltd) coupled to a GC×GC-TOFMS instrument (Agilent 8890 gas chromatograph, Agilent Technologies, Palo Alto, CA, USA; BenchTOF-Select mass spectrometer; Markes International Ltd) for sample analysis. Details of the GC operating and analytical run parameters are given in the accompanying supporting information (SI). GC-MS analyses were performed to screen for volatile emissions from the different materials and to determine the chemical identities of predominant compounds, for cross-reference with the PTR-MS data. All emissions analyses were performed using untreated and treated interface material samples to investigate the efficacy of different treatment procedures to reduce emissions, with each measurement performed in triplicate on separate samples.
2.6. Data processing
The PTR-TOFMS data were processed using the PTR-MS Viewer v.3.4 software (IONICON Analytik). An initial search for peaks in the mass spectra was made via the AutoSearch function. For the emissions analyses, PTR-TOFMS signal (m/z) assignments were made based on the compounds identified by TD-GC×GC-TOFMS, with consideration of the exact mass and isotopic ratios of either the parent ions or their fragments. Due to the inability of PTR-TOFMS to discriminate between isomeric compounds, in cases of signals being associated with more than one compound, as verified from the GC-MS datasets, e.g. m/z 73.065 for butanal and/or 2-butanone, the m/z signal (and corresponding concentration) was assumed as the sum of these compounds. Elemental compositions are reported for cases where m/z signals could not be clearly assigned to any specific compound (absence of corresponding verification by GC-MS). VOC concentrations were calculated using a common approach based on their reaction kinetics during proton transfer from hydronium ions using rate coefficients (k) from the literature [36] or a standard rate of k = 2.0 × 10⁻⁹ cm3 s−1 in cases where compound-specific rates were not available. The estimated uncertainty of this quantitation method is ⩽30% [37]. In contrast, peak assignments for the uptake measurements were made based on the calibrations performed using the representative target compounds, as listed in table 1. The degree of uptake was determined by comparing the signal plateaus in the presence or absence (baseline) of the respective sampling interface connecting the LCU to the PTR-TOFMS. For quantitation, the compound-specific calibration curves (i.e. instrument sensitivity to individual target compounds) were used to convert ion signal intensities in the uptake datasets to gas-phase concentrations (ppbv). Exposure levels were calculated as the average (mean) concentration of the stabile baseline signal. Adsorption was estimated by subtracting the mean concentration measured with the respective interface in place (over the 12 min sampling period) from the prior exposure level. Levels of compound emissions were estimated by calculating the mean concentrations over the 12 min sampling under simulated conditions and taking into account the associated system blanks.
The GC×GC-TOFMS data were processed using the ChromSpace software (v2.1.3, Markes International, Ltd). Details on the data acquisition and analysis procedure are provided in the SI. The identities of the detected compounds were confirmed by comparing the mass spectra (match factor and reverse match factor >700, respectively) and retention indices with the literature (<50; if data was available).
3. Results and discussion
3.1. Material emissions
The analysis of volatile emissions from the three individual breath sampling interface materials under simulated conditions revealed the presence of 36 compounds (signals above the instrumental limit of detection; LOD). These VOCs belonged to diverse chemical classes, depending on the material under investigation, ranging from silanes and siloxanes, to alcohols, aldehydes, ketones, hydrocarbons and carboxylic acids. Many volatiles detected were common to all three materials, albeit at different concentrations. Figure 3 shows the distributions of emissions of the dominant chemical classes from the individual materials, whereby the depicted levels represent the sum totals of the compounds associated with each chemical class that were present at >1 ppbV. Representative emissions measurements of selected compounds for each interface as a function of time are depicted in figure S1.
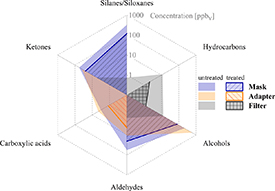
Figure 3. Comparative concentrations—grouped according to chemical classes—of the volatile emissions from the materials of three breath sampling interfaces: mask (blue), adapter (orange) and filter (grey), either prior to (untreated) or after (treated) thermal (mask, filter) or hydrothermal (adapter) treatment. Values for each compound class comprise the sum of individual compound concentrations in ppbV associated with the respective class, as quantified using PTR-TOFMS. Note the logarithmic concentration scale of the radar projections, which ranges from 100 pptV to 1 ppmV.
Download figure:
Standard image High-resolution imageConsidering the untreated samples first, the mask and adapter exhibited comparable total VOC emissions (595 and 448 ppbV, respectively), which were approximately 20-fold higher than the filter emissions (29 ppbV). Whereas the overall emissions were similar in the mask and adapter, the distribution of compounds emitted from these materials varied. The mask consisted predominantly of silanes and siloxanes (55.6% of all compounds >1 ppbv), followed by alcohols (24.8%), aldehydes and ketones (9.6% and 9.4%, respectively), with a minor contribution from carboxylic acids (0.5%). By comparison, the dominant emissions from the adapter were alcohols (87.8%; predominantly 2-propanol, as discussed below), followed by ketones (8.8%), with minor contributions from aldehydes and carboxylic acids (2.4% and 1.0%, respectively). For the filter, emissions consisted mostly of hydrocarbons (39.7%) and alcohols (33.7%), as well as ketones, aldehydes and carboxylic acids (19.3%, 4.8%, and 2.5%, respectively). The compounds exhibiting the highest emitted concentrations are shown in figure 4 (full information on material emissions of all signals quantified using PTR-TOFMS under simulated conditions can be found in table S3).
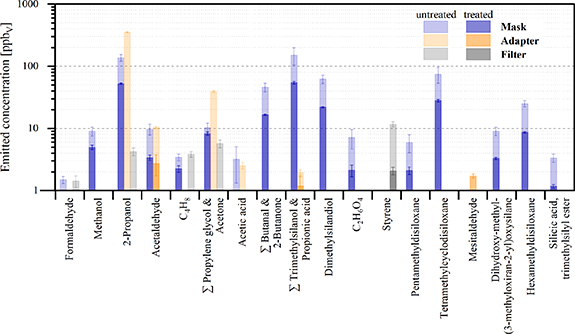
Figure 4. Mean concentrations ±SD (n = 3) of the main volatiles (>1 ppbV) emitted from different interface materials under simulated breath sampling conditions, either prior to (untreated) or after (treated) (hydro-)thermal treatment, as detected by PTR-TOFMS. Sum formulae are assigned to signals whose identities were ambiguous.
Download figure:
Standard image High-resolution imageThe compound with the highest emission from the untreated mask was 2-propanol (or isopropyl alcohol; IPA); its origin is unknown, but it could be associated with cleaning/sterilization of the mask (by the manufacturer prior to purchase) as was similarly the case for the adapter (see later). Besides IPA, emissions from the mask were dominated by various silanes and siloxanes associated with the silicon material of the masks. This corroborates the data reported by Doran et al [7] and Harshman et al [6], who observed a significant increase in several siloxane background contaminants in breath samples via use of a silicon facemask compared to room air controls sampled without a mask. Notable emissions of trimethylsilanol (TMS, m/z 91.054) and hexamethyldisiloxane (L2; m/z 163.096) were similarly observed here and in the aforementioned studies, yet the presence of hexamethylcyclotrisiloxane (D3), octamethylcyclotrisiloxane (D4) and decamethyltetrasiloxane reported in the previous work were not observed via PTR-TOFMS analysis here (but were detected using TD-GC×GC-TOFMS in the analysis under controlled conditions) [6, 7]. Other suspected silanes and siloxanes that were quantified here by PTR-TOFMS were not observed in the two mask studies, yet other PTR-MS measurements on TMS have reported that this compound converts to dimethylsilandiol (DMSD; m/z 93.035) in the presence of water vapour, which supports the present observations. A signal detected at m/z 75.034 is likely associated with the loss of a methyl group from TMS, and two dominant signals observed at m/z 147.086 and m/z 149.048 could be attributable to the dehydration of pentamethyldisiloxane and tetramethylcyclodisiloxane, detected at m/z 165.084 and m/z 167.053, respectively [38, 39]. Additional emissions of compounds from the mask associated with this chemical class were silicic acid, trimethylsilyl ester (>1 ppbV) and 1,1,3,3-tetramethyl-2-oxa-1,3-disilacyclohexane (<1 ppbV), as has been reported previously [6, 7]. Beyond this class of compounds, additional major compound emissions included butanal and/or 2-butanone, followed by acetone, CH4O and C4H8, amongst other minor constituents (see figure 4).
Similarly to the mask, in the case of the adapter the volatile emissions were dominated by IPA, constituting 79% of the total emitted concentration in the untreated part. In contrast to the mask, however, the presence of this compounds can be directly attributed to the post-processing (cleaning) procedure of the 3D-printed adapter, as recently reported [24]. Apart from the dominance of IPA, the most abundant volatiles emitted from the adapter were propylene glycol (PG), followed by acetaldehyde, propionic acid and mesitaldehyde. According to the resin manufacturer, the material composition of the specific resin used to print this adapter is 55%–75% urethane dimethylacrylate, 25%–45% 2-hydroxyethyl methacrylate and 1%–2% phenyl bis(2,4,6-trimethylbenzoyl)-phosphine oxide. The detection in a previous study of acrylate esters, e.g. 2-hydroxyethyl methacrylate (2-HEMA), could not be confirmed here, despite this compound being listed in the formulation of the resin; this discrepancy could be due to the shorter sampling time (12 min here vs 20 min in the other study) and/or different sampling conditions [13, 15], since it was detected via μCTE-TD-GC×GC-TOFMS under controlled conditions in the present work. Furthermore, the probable emission of PG from the adapter (indistinguishable from acetone by PTR-TOFMS but confirmed from the GC×GC-TOFMS dataset) was observed, presumably originating from the hydrolysis of hydroxypropylene methacrylate in PG and methacrylic acid. The presence of PG in 3D-printed materials was also reported by Zhang et al [40], who measured emissions of this compound during printing and associated it with both the bulk resin and the photopolymerization process. Additionally, mesitaldehyde was detected here, which is consistent with previous observations [10] and is presumably a fragmentation product formed upon α-cleavage of phenyl bis(2,4,6-trimethylbenzoyl)phosphine oxide, an additive for ultraviolet photopolymerization of uncured resins; the precursor compound is stated by the manufacturer as an ingredient of the resin used to fabricate the adapter printed for these studies.
As reported above—and is evident from figure 3—the filter exhibited by far the lowest overall emissions, which were dominated by styrene, associated with its sole ingredient (polystyrene, as declared by the manufacturer). Other major compounds included IPA, PG (with potential contribution from acetone), as well as formaldehyde and C4H8, amongst others (see figure 4; and reported in table S3).
3.2. Treatment efficiency
Thermal (mask, filter) or hydrothermal (adapter) treatments resulted in marked reductions in the overall and compound-specific emissions for all three interface materials, as is observable in figures 3 and 4. In terms of overall emissions, the respective treatments reduced the concentrations by 62% in the mask, 89% in the filter and 99% in the adapter. The high reduction observed for the adapter is primarily associated with the elimination of IPA (see figure 4), which was residually present from the cleaning process of the 3D-printed model (post-production submersion in an IPA solution) and dominated the overall emissions of the untreated adapter, as discussed above. Consequently, the process of autoclaving the adapter represents a highly effective procedure to reduce the presence of this compound and lower the overall emissions from this material by at least two orders of magnitude to low ppbV levels (from 447 ppbV untreated to 6 ppbV after treatment); it might be noted that simple thermal treatment (i.e. baking out) will likely yield similar reductions. The degree of reduction on the individual compounds and/or chemical classes through thermal treatment of the adapter can be observed in figures 3 and 4 (and in table S3). Considering the other two interfaces, thermal treatment of the filter was also highly effective in reducing compound emissions, from 29 ppbV to 3 ppbV (a ten-fold decrease), with similar treatment of the mask providing notable reductions, albeit lower than for the other two interface materials, from 595 ppbV pre-treatment to 225 ppbV post-treatment (an overall reduction by approximately two-thirds).
3.3. Uptake of volatiles
The relative uptake by the individual interface materials of 12 representative compounds covering different chemical classes (see table 1) are shown as a heatmap in figure 5 (with values of absolute changes presented in table S1). Specifically, figure 5 displays the percentage-degree of losses of each compound passing through/across the individual interface material, either at low or high exposure concentrations (ca. 10 ppbV or 100 ppbV, respectively; see table 1 for exact values). Minimal uptake is represented by green shading that transitions to red to indicate extensive adsorption by the respective material. Notably, blue shading highlights cases where these compounds were emitted from the materials themselves (as discussed in 3.1 and displayed in the associated figures), thus masking any uptake. In addition, black shading indicates that the degree of uptake was not determinable due to the concentrations being below the LOD; this was the case for the low exposure concentration conditions for ethanol, nonanal, and the carboxylic acids (except for butanoic acid in the adapter measurements), thus the degree of uptake under these conditions could not be determined. Representative uptake measurements of selected compounds for each interface as a function of time are depicted in figure S2.

Figure 5. Heatmap of the relative uptake of 12 representative compounds by the individual breath sampling interface materials, i.e. mask, adapter or filter, at two different exposure concentration ranges: low conc. (∼10 ppbV) or high conc. (∼100 ppbV). The degree of uptake (adsorption) varies from minimal (green shading) to extensive (red shading). Blue shading highlights cases where the respective materials exhibited emissions of these target compounds, whereas black shading indicates that the degree of uptake could not be ascertained due to high baseline concentrations or when concentrations were <LOD. Positive changes (usually indicative of emissions) of up to 5% were considered to be within the accuracy of the replicate analyses (measurement fluctuations) and were assigned green shading associated with 0%–5% (i.e. negligible) change.
Download figure:
Standard image High-resolution image
After placing the respective interface component in the sampling configuration, the immediate concentration changes observed for the individual compounds typically remained constant over the sampling period (12 min). In some cases, the concentrations increased slightly and steadily during this period, as would be expected when adsorption saturates and uptake wains (see figure S2). Nevertheless, the immediate uptake upon adding the interface component dominated the respective dataset, thus this is a realistic reflection of the situation during real breath sampling. It should be further noted that errors on the estimated degrees of uptake through potential competing emissions of identical compounds (or additional compounds eliciting signals at the same m/z assigned to the target compounds) cannot be ruled out but are expected to be minimal.
Overall, the degree of compound uptake was highest in the mask (greatest adsorption/losses), followed by the filter, then the adapter, whereby the extent of adsorption by the different materials was compound dependent. Some compounds, such as 1-butanol, acetone, 2-butanone, 1,8-cineol and dimethyl sulphide, experienced minimal losses whereas others, such as nonanal, acetic acid, butanoic acid, limonene and indole exhibited marked decreases. The highest uptake was observed for indole, ranging from a loss of 55% through adsorption to the adapter material, to 95% in relation to uptake by the mask material. Besides indole, the two carboxylic acids experienced high uptake by all interface materials for the high exposure concentrations, with mean uptakes of 79%, 57% and 78% for the mask, adapter and filter, respectively. Uptake of nonanal or limonene were similar for all interface materials, with mean losses of 69% for nonanal and 72% for limonene. Ethanol uptake by the mask was observed to be marginally lower than by the adapter or filter (31% vs 38% or 46%, respectively). At the lower end of the uptake range, effectively no losses were observed for acetone or 2-butanone through exposure to the adapter or filter (uptake values of only 1% and 6%, respectively, which are within the analytical uncertainty). By comparison, the mask was observed to emit both of these compounds at higher concentrations than the low exposure concentration scenario, thereby masking any uptake under these conditions; this was similarly observed for 2-butanone at the high exposure concentrations, whereas acetone under these conditions was not affected (uptake of 2%, i.e. negligible). Emissions of acetaldehyde from the mask and adapter at the low exposure conditions masked any uptake, but uptake of this compound at the high exposure concentration was low (negligible) in all three interface materials. Dimethyl sulphide experienced negligible adsorption to all materials at either the low or high exposure concentrations. This was similarly observed for 1,8-cineole for the filter and adapter, yet uptake by the mask was observed for both exposure concentrations, with a mean uptake of 39%.
4. Considerations
The present study aimed to identify VOCs emitted from three different materials used in breath sampling and to determine the degree of adsorption onto the materials' surfaces of representative compounds present in the human breath volatilome. Certain considerations should be taken into account in the context of these assessments. First, the degree of emissions or adsorption from or to the wetted surfaces of the interface materials will vary according to the gas flow, which is relevant because the flow rate of the carrier gas into the analyser in this study differs from typical breath sampling flows. During normal, at-rest breathing with only minimal muscle effort, normal adults typically exchange ∼0.5 l air per breath (tidal volume) at a rate of approximately 12 breaths per minute, resulting in a minute ventilation rate of about 6 l air per minute [41]. By comparison, the flow rate applied in the analytical configuration of the experiments presented here was 1 l min−1. In terms of the emissions, if compounds are released from a material at a constant rate, steady-state concentrations will be higher in a slower gas stream than in a faster flow due to the longer interaction period between the static material and the moving gas matrix. For the uptake of volatile constituents of a gas flow, the degree of adsorption will be higher for a slower flow due to the longer period to reach equilibrium compared to a faster flow where saturation of the surfaces is achieved more rapidly. Accordingly, the comparatively slow gas flow adopted in these experiments in relation to typical rates during breath sampling is expected to yield both higher concentrations of emitted volatiles and a greater degree of adsorption of volatile constituents from the gas stream.
Second, in this work emissions were assessed at 40 °C exposure conditions, yet the heating up process of the interface materials is neither immediate nor uniform and occurs only gradually during exhalation, ultimately reaching temperatures in the low to mid-30 °C range, rather than 40 °C. Furthermore, when considering the degree of compound uptake of the adapter and filter, it must be kept in mind that these two interfaces must be used in combination during breath sampling, thus cumulative effects of emissions and/or uptake might play a role and cannot be ruled out.
Finally, although breath sampling using the ReCIVA system can last up to 12 min, the present simulation did not account for the fact that exposure of the interface component to breath volatiles is not continuous over this period, which includes the inhalation phases. Assuming a regular breathing cycle with equivalent durations of exhalation and inhalation, the exposure period during sampling will be typically only 6 min. Moreover, the inhalation phase immediately after the interface is exposed to exhaled breath might act to strip adsorbed breath constituents from the material, thereby repeatedly allowing for a higher initial uptake in each subsequent exhalation. Overall, however, since the reported uptake values were dominated by the initial concentration change from baseline, these are expected to be a good estimation of real-world breath sampling conditions.
In terms of the effects of (hydro-)thermal treatment of the sampling components on reducing volatile emissions, these must be placed into the context of their routine handling procedures, which will vary between these parts. Although the commercial mask is supplied ready to use, many users nevertheless bake these out prior to their implementation. Similarly, the adapter requires autoclaving to ensure sterility before initial use and between uses. By comparison, the filter is supplied sterile and ready to use and is therefore unlikely to undergo further treatment, especially as it is a one-use disposable item and additional handling might compromise its form and functionality. Realistic uses of these components for breath sampling are therefore either the treated mask or a combination of the treated adapter with the untreated filter. Consequently, the corresponding emissions datasets should be considered in overall appraisals of suitability. In the present work, the treated mask exhibited emissions of compounds in the individual groups (alcohols, ketones and aldehydes) in the range 10–100 ppbV. By comparison, emitted concentrations from the combined adapter-filter assembly (treated/untreated, respectively) of compounds in different chemical groups (alcohols, ketones, aldehydes, carboxylic acids and hydrocarbons) were in the 1–10 ppbV range. Thus, the latter components exhibited lower emissions in general. Nevertheless, since breath volatiles are typically present in the low ppbV range, this study highlights the importance of characterizing compound emissions from breath sampling components in order to rule out confounders derived from the sampling system.
A final point to consider in relation to material emissions is the relevance of the emitted compound classes in relation to common exhaled breath constituents or potential biomarkers and their respective concentrations. The silanes/siloxanes, for example, represent exogenous compounds that will not manifest as endogenous volatile disease biomarkers in breath, thus their presence through material emissions can be readily accounted for and is therefore less critical (notwithstanding potential analytical complications through co-elution of such compounds with breath-relevant volatiles). By comparison, other compounds, such as acetaldehyde or 2-butanone (see figure 5), can be endogenously produced and thereby represent realistic breath constituents, thus the emission of such compounds by sampling interface materials at considerable concentrations might mask their physiologically relevant concentrations and thereby confound breath datasets.
Overall, this study represent a worst-case scenario for the individual interface materials and the degree of emissions and/or uptake might be expected to be lower under real-world breath sampling conditions. Nevertheless, the present work provides indicative effects of emissions and uptake that emphasise the need to take into account these phenomena in breath research for data quality assurance. Considerations of confounders through emissions are already routinely made when using the ReCIVA device through the separate collection of a system blank that is utilized to highlight any compounds deriving from the sampling system. Compound uptake, on the other hand, is mostly overlooked, especially as this phenomenon is less trivial to characterize. This work indicates that certain compounds indeed experience marked losses during sampling, thus the characterization of uptake represents an important addition in quality assurance in breath sampling.
5. Conclusion
Despite the promising benefits of breath-based tests, they remain scarce in clinical practice due to a series of challenges of varying severity. One potential pitfall, albeit minor in relation to other hurdles, is the disruption of breath samples through emissions and/or uptake of sampling interface materials, which can potentially have a negative impact on the correct interpretation of breath data. This study aimed to estimate the degree of emissions and uptake of VOCs by selected interface materials under simulated breath sampling conditions.
Emissions from the commercial and conventional silicon facemask consisted predominantly of silanes and siloxanes associated with the silicon material of the mask. By comparison, the novel 3D-printed adapter emitted mainly 2-propanol (attributed to post-processing cleaning of the adapter with this solvent). Emissions from the sterility filter were lowest amongst the three materials and were dominated by styrene. Overall, thermal or hydrothermal treatments of the individual materials was highly effective in reducing the total VOCs emitted by the materials. Under realistic conditions of use, the treated mask exhibited marginally higher concentrations of emitted compounds than the combined adapter-filter configuration (10–100 ppbV vs. 1–10 ppbV, respectively, for individual compound classes). Despite the relatively low emissions for either configuration, breath volatiles are typically present in the low ppbV range. This study therefore highlights the importance of characterizing the sampling system to identify and account for associated confounders.
In terms of compound uptake (of prospective biomarkers during breath sampling), the adapter exhibited the lowest relative uptake across all representative compounds, followed by the filter, then the mask, although it should be noted that the adapter and filter must always be used in combination, thus cumulative effects might play a role and should be considered when conducting targeted studies.
In light of the many endeavours to develop and establish breath-based tests in clinical and routine use, characterizing and choosing the most appropriate materials used during breath sampling represents an important step in quality assurance to avoid compromising collected samples and to enable the consideration and correction of system-related confounders in breath datasets. Knowledge of these phenomena will reduce the likelihood of erroneous data interpretation and will ultimately expedite progress in the field of breath test development.
Acknowledgments
Felix Wiegandt and Alexander Clement (Fraunhofer ITEM) are acknowledged for their co-development of the 3D-printed mouthpiece adapter. Manuel Krause (Fraunhofer IVV) is thanked for his technical support in modifying the design and printing the adapters. Christian Zacherl (Fraunhofer IVV) is thanked for photographing the breath sampling configurations depicted in figure 1.
Data availability statement
The data generated and/or analysed during the current study are not publicly available for legal/ethical reasons but are available from the corresponding author on reasonable request.
Authors' contributions
Conceptualization, Y L P, J B, O H; Investigation, Y L P; Methodology, Y L P, J B, O H; Formal analysis, Y L P, J B; Visualization, Y L P, J B; Writing—original draft preparation, Y L P; Writing—review and editing, Y L P, J B, O H. All authors have read and agreed to the published version of the manuscript.
Funding
This work was partly funded by the German Ministry of Education and Research (BMBF), Grant Number 01KT1803A, as part of the ERA-NET TRANSCAN-2 project Airborne Biomarkers for Colorectal Cancer (ABC-Cancer).
Conflict of interest
The authors declare no competing interests.
Supplementary data (1.0 MB PDF)