

Abstract
Blood glucose monitoring (BGM) is the most important part of diabetes management. In classical BGM, glucose measurement by test strips involves invasive finger pricking. We present results of a clinical study that focused on a non-invasive approach based on volatile organic compounds (VOCs) in exhaled breath. Main objective was the discovery of markers for prediction of blood glucose levels (BGLs) in diabetic patients. Exhaled breath was measured repeatedly in 60 diabetic patients (30 type 1, 30 type 2) in fasting state and after a standardized meal. Proton transfer reaction time of flight mass spectrometry was used to sample breath every 15 min for a total of 6 h. BGLs were tested in parallel via BGM test strips. VOC signals were plotted against glucose trends for each subject to identify correlations. Exhaled indole (a bacterial metabolite of tryptophan) showed significant mean correlation to BGL (with negative trend) and significant individual correlation in 36 patients. The type of diabetes did not affect this result. Additional experiments of one healthy male subject by ingestion of lactulose and 13C-labeled glucose (n = 3) revealed that exhaled indole does not directly originate from food digestion by intestinal microbiota. As indole has been linked to human glucose metabolism, it might be a tentative marker in breath for non-invasive BGM. Clinical studies with greater diversity are required for confirmation of such results and further investigation of metabolic pathways.
Export citation and abstract BibTeX RIS
1. Introduction
1.1. Diabetes mellitus (DM) and blood glucose measurement
DM is a chronic metabolic disorder characterized by a persistently high blood glucose level (BGL), affecting roughly half a billion people worldwide [1]. An elevated BGL can be caused by either a lack of insulin (type 1 DM) or an improper cell-response to insulin, partly combined to an insufficient amount of insulin (type 2 DM) [2]. The main role of insulin is to regulate glucose uptake in cells as an energy source. If this system is disrupted, ketone bodies in blood increase (ketoacidosis) and can lead to coma or death [3–6]. In diabetic patients, a high BGL over a prolonged time induces systemic vascular damage causing a variety of chronical diseases. Consequently, the major goal of diabetes therapy is early detection, followed by adjustment of glucose levels to normal range to mitigate the risk of secondary diseases [7]. One impediment is that blood glucose monitoring (BGM) often involves an invasive testing process. The commonly used test strip approach is based on painful finger pricking. This is uncomfortable, especially in regular and multiple daily measurements. As a result, the need for non-invasive alternatives is increasingly important. Continuous glucose measurement (CGM) devices reduce or avoid finger pricking and thus achieved a first step towards less invasiveness. In CGM a short needle-type sensor is inserted into the skin and monitors the concentration of glucose in the subcutaneous interstitial fluid [8]. Although some devices are more patient-friendly (e.g. factory calibrated), many diabetes patients continue to reject them due to the invasive application [9].
The present study describes the attempt to find volatile compounds (markers) in exhaled breath of diabetic patients to enable non-invasive BGM. Therefore, two groups of diabetic subjects were analyzed (30 of type 1 and 30 of type 2) for their breath profiles and BGLs during a period of 6 h before and after a meal. Except for their diabetes, the subjects were in good health condition. Comparison to a reference group of healthy subjects was not in scope as BGM is not relevant for healthy people. Additional experiments were performed with one healthy subject to investigate the influence of meal ingredients on breath profiles and the potential metabolic origin of relevant volatile organic compounds (VOCs) found during the clinical study.
1.2. VOCs and breath gas analysis
Analysis of exhaled breath has the potential for non-invasive disease monitoring. This can be useful especially for diabetics that regularly need to check their BGL. Human breath includes a variety of VOCs in amounts from the low ppb to the ppm range. VOCs present in breath primarily include hydrocarbons, alcohols, ketones and aldehydes [10, 11]. In the body, VOCs are transported through the bloodstream to the lungs. There, gas exchange takes place during breathing between blood in pulmonary capillaries and air in alveoli [12]. The large surface area of alveolar membranes and the small distance between alveoli promotes permeation of VOCs from blood into air or vice versa. Distinction between exogenous and endogenous VOCs is essential. Endogenous VOCs are generated in human metabolism, whereas exogenous VOCs are of non-human origin (e.g. bacteria in the gut or inhaled air pollution) [13, 14, 59, 60]. Endogenous VOCs were the primary target in the presented study since their occurrence or concentration level in breath might be linked to human metabolism and hence to BGL. Numerous breath studies have been carried out searching for a helpful correlation between endogenous VOCs in breath and BGL [15]. Acetone is the most prominent biomarker related to diabetes (fruity breath odor during phases with high BGL) and therefore the subject of several breath studies. A positive correlation between acetone concentration in breath and BGL has been described in some studies [16, 17]. Also, a link has been reported between elevated isoprene levels in breath and hypoglycemia [18]. However, both acetone and isoprene can be influenced by other variables (e.g. physical activity, age, gender, diseases), and are thus not suitable as stand-alone BGM-biomarkers [19–21]. Several other VOCs have been studied for BGL monitoring (e.g. methyl nitrate, ethanol, xylene), in part with promising results [22–24]. But further clinical research is needed to bridge the knowledge gap of valid assignment of VOC profiles to metabolic pathways or a health condition like diabetes.
1.3. Proton transfer reaction time of flight mass spectrometry (PTR-ToF-MS)
Exhaled breath analysis requires an analytical method that is sensitive to quantities at trace level and specific to identify single VOCs. The majority of research for breath biomarkers has been performed offline with gas chromatography coupled to mass spectrometry (GC-MS), which is the 'gold standard' for this field of study [12, 23]. However, in order to identify VOCs down to low ppb ranges, GC-MS requires sample preconcentration and labor-intensive sampling [25, 26]. This can be difficult and induces a delay between sampling and analysis. New alternatives of direct and online sampling are becoming a preferred approach for breath analysis. Several such methods for real-time measurements have been applied [27–30], e.g. PTR-ToF-MS, selected ion flow tube mass spectrometry or ion mobility spectrometry.
In our study, PTR-ToF-MS was used to measure VOCs in exhaled breath. PTR-ToF-MS is a chemical ionization mass spectrometric method developed at the University of Innsbruck in the 1990s and later commercialized by the company Ionicon Analytik GmbH [31]. The method uses hydronium (H3O+) ions from water vapor to protonate most VOCs, but not air. This enables high sensitivity. In addition, this kind of chemical ionization induces only a low degree of ion fragmentation, which is beneficial in identifying large molecules in unknown VOC mixtures. The principle of PTR-ToF-MS has been previously discussed in literature [32–34]. The method meets all requirements for on-line breath analysis, including high sensitivity, real-time response, high mass resolution (i.e. monoisotopic mass peaks) and direct sampling with no preconcentration [35].
2. Material and methods
2.1. Clinical study
A clinical study was carried out at the Institute of Diabetes Technology Ulm. The responsible ethics committee approved the study protocol and all participants gave informed consent prior to the study procedure. In total, 60 diabetics participated, 30 type 1 and 30 type 2, aged between 22 and 81 years (average age 61 ± 14 years). Subjects were in good health condition apart from their diabetes and had no significant complications. For example, type 1 diabetics older than 45 years with a combination of hypertension, high HbA1C (>9.0) and smoking were excluded. Patients were advised to attend in the morning in fasting state (overnight fasting). After arrival, subjects maintained fasting state for 1 h and then consumed a standardized breakfast (BF). The BF consisted of bread, jam, cream cheese, honey, ham and yogurt. Type 1 diabetics received the required quantity of insulin with the meal whereas type 2 diabetics continued without additional medication. Breath was sampled every 15 min from the time of arrival for a total of 6 h (see figure 1). In parallel, patients' BGLs were measured using a commercially available blood glucose meter with appropriate test strips (both Accu-Chek® Guide, Roche Diabetes Care GmbH, Germany) and a lancing device (Accu-Chek® FastClix, Roche Diabetes Care GmbH, Germany). Blood glucose sampling was performed closely before each breath sampling. The sampling protocol is shown in figure 1. In total, at least 26 paired samplings of breath and BGL were taken for each subject (five in sober state and 21 after the meal). In phases of low BGL additional samplings were performed to prevent hypoglycemia by additional food intake.
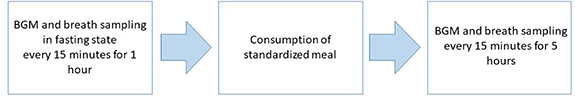
Figure 1. Sampling protocol for the clinical study.
Download figure:
Standard image High-resolution image2.2. Additional experiments
Additional experiments following a similar protocol to the clinical study (figure 1) were carried out with a healthy 22 year-old male subject. Within one series, the amount of components in the BF was varied, keeping a total of 75 g of carbohydrates (see table 1). In a second series, instead of a meal, the subject drank either a solution of partly labeled glucose (20 g 1-13C-glucose with 55 g normal 12C-glucose in 200 ml water) or a lactulose solution (20 g lactulose in 200 ml water). This enabled a more in-depth investigation of VOC origin and metabolic flux in the human body.
Table 1. Breakfast (BF) components, their quantities and carbohydrate load used for additional experiments.
| Component | Carbohydrates in 100 g | Quantity in BF1/g | Carbohydrates in BF1/g | Quantity in BF2/g | Carbohydrates in BF2/g |
|---|---|---|---|---|---|
| Bread | 40 | 65 | 26 | 88 | 35 |
| Jam | 59 | 20 | 12 | 35 | 20 |
| Cream cheese | 3 | 35 | 1 | 15 | 0.5 |
| Honey | 14 | 150 | 21 | 0 | 0 |
| Ham | 1 | 20 | 0.2 | 35 | 0.4 |
| Yogurt | 75 | 20 | 15 | 25 | 19 |
| Total carbs | 75 | 75 |
2.3. Breath sampling
For breath sampling, each subject was placed seated in upright position in front of a stand holding the inlet tube of the PTR-ToF-MS. A mouthpiece (Bexamed, Fürth, Germany) was attached to the inlet tube using an in-house made mounting support. This setup allowed easy sampling of exhaled breath with the PTR-ToF instrument. Participants were always able to breathe through the mouthpiece with their normal respiration rhythm, with no additional flow resistance (see figure 2). This is an important prerequisite for unbiased results as a change of respiratory pace can influence VOC concentrations [36]. Patients were also advised to breathe through their mouths only. The nose was sealed with a commercially available nose clip (Bexamed, Fürth, Germany). A minimum of five breath cycles were sampled at each sampling event. Average exhalation breath flow is about 4–5 l min−1 and thus significantly higher than the continuous inlet sampling flow of the instrument (0.05 l min−1). As a result, ambient air was not sampled during an exhalation phase and was ignored in evaluation. During an inhalation phase, ambient air was sampled providing data for background correction of inhaled ambient VOCs.

Figure 2. Setup for real-time breath sampling showing a patient with mouthpiece, nose clip and inlet tube.
Download figure:
Standard image High-resolution image2.4. PTR-ToF-MS setup
All measurements in this study were performed with a commercially available PTR Qi-ToF mass spectrometer (PTR-QiToF 8000, Ionicon Analytik GmbH, Innsbruck, Austria). The device consists of a PTR ion source and a quadropole ion conductor coupled to a reflectron ToF-MS with orthogonal acceleration (Tofwerk AG, Thun, Switzerland). PTR-Manager software (version 3.0, Ionicon Analytik GmbH, Innsbruck Austria) was used to setup and operate the instrument.
The sampled airflow is supplied to the drift tube through an inlet tube of polyetheretherketone with an inner diameter of 1 mm and with an inlet flow of 50 ml min−1. Condensation and carryover of semi-volatile compounds was prevented by keeping the inlet tube at higher temperature (100 °C) than ambient air (21 °C), but at lower temperature than the drift tube temperature (120 °C). The hollow cathode discharge source was at 3.5 mA, the water vapor current to the ion source was at 6.5 ml min−1.
Drift voltage was adjusted to 1000 V to achieve optimum ionization conditions. The drift tube was operated at 4.00 mbar to ensure sufficient reactive collisions in the sample gas between primary ions and VOCs. The ratio of electric field (E) to buffer gas density (N) in the drift tube was 149 Td (1 Td = 10−17 V cm2). The interface between ion source and ToF-MS was a differentially pumped ion transfer unit. This allowed discrete pressure regimes in drift tube and ToF region and a continuous sample flow through the drift tube.
The generated ions (M-H+) were extracted every 40 µs to the ToF region through a pulsed voltage of 670 V. The ToF region operated in high vacuum (5 × 10⁻⁷ mbar) ensuring collision-free ion flow. The microchannel plate detector (controlled by TofDaq Recorder software) captured ions in real-time mode at a frequency of 2.0 GHz (0.2 ns per channel with 199 488 channels). The obtained mass scale (m/z ratio) was 0–510 g mol−1 and the acquisition time was one full mass spectrum per second.
2.5. Data acquisition and analysis
Acquisition software TofDaq (comprising Viewer and Recorder) was used to acquire raw mass spectra in real time and save it in Hierarchical Data Format 5 (Tofwerk AG, Thun, Switzerland). Data was further processed using Tofware software (Tofwerk AG, Thun, Switzerland). Mass calibration was performed with reference peaks present in all mass spectra. Reference peaks had intensities that were both high enough for a satisfactory signal-to-noise ratio and low enough not to saturate the detector. Optimal ions in the present study were NO+ (m/z 29.9974), protonated isoprene (C5H8H+, m/z 69.0699), and (internally generated) protonated iodobenzene (C6H5I+, m/z 204.0102). Iodobenzene supply was included in the device via an internal diffusion cell. Mass calibration was also performed offline using the same process with Tofware software 'Mass Calibration'.
For data analysis, time-series were plotted using ions with high signal intensity that showed a clear inhalation and exhalation sequence (see figure 3, e.g. acetaldehyde). Exhalation phases were selected with this trend based on threshold values, and a cumulative mass spectrum was calculated by summing these spectra from a full series (400–500 single breath samplings). The signal-to-noise ratio in this cumulative spectrum was improved by a factor of approximately 20 compared to spectra of single samplings. Smoothing and baseline removal was performed on the cumulated spectrum, followed by peak detection using embedded Gaussian fitting. Relevant peaks were chosen based on signal-to-noise threshold values (above signal-to-noise ratio of about 25) and computed in a peak list comprising peak limits and center mass values. This procedure was saved as peak evaluation method.
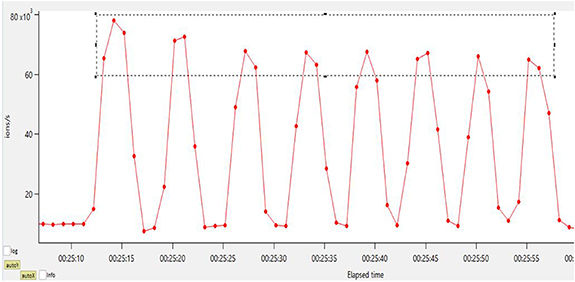
Figure 3. Mass trace m/z 45.03 (red line) showing inhalation and exhalation cycles of breath. Red dots indicate sampling points (every 1 s). The region in the grey dashed rectangle contains relevant sampling points (phases of exhalation).
Download figure:
Standard image High-resolution imageFor evaluation of each breath sampling event (every 15 min), the respective single breath cycles (about 5–8 exhalations per event) were averaged to enhance sensitivity. The averaged exhalation spectrum was evaluated using the peak list and method described above. Results were further processed to trends of signal intensities (in ion/s) of mass peaks versus sampling time. The 'Composition & Isotopes' feature in Tofware software was then used to tentatively assign sum formulas to some of the mass peaks, based on the monoisotopic mass of the peaks. The proposed sum formulas were assessed (based on published literature) for plausibility and further assigned to most probable single compounds. In additional lab experiments, pure chemicals were sampled to validate the most relevant assignments. However, it is important to point out that this type of identification and assignment is often tentative when formally assessed from an analytical chemistry perspective.
Blood glucose data generated with Accu-Chek® Guide strips were used as measured. Results from the PTR-ToF-MS and BGM measurements were further processed using Excel 2010 software (Microsoft, Washington, USA) and MATLAB (MathWorks, Natick, USA) for correlation computation and plotting.
3. Results and discussion
3.1. Clinical study
BGL were measured upon arrival and during the breath sampling process. The carbohydrate intake by the meal after fasting state induced a considerable increase in patients' glucose levels within about 15 min. Later in time the BGL slowly decreased again. The mean glucose trend during complete measurement time is shown in figure 4. This trend allowed assignment of distinct metabolic phases to the BGL trend, providing critical points for the correlation of VOCs in breath. Among the 60 patients, there were large variations in BGL both in fasting state and after the standardized meal (postprandial), see table 2. Glucose trends differed between groups of type 1 and type 2 diabetics but the variation was also quite large within groups. For example, higher fasting levels were associated to type 2 diabetics with a range of 108–270 mg dl−1 (mean 150 mg dl−1) compared to type 1 diabetics ranging from 70 to 230 mg dl−1 (mean 128 mg dl−1). Postprandial levels were less different between groups, with a mean peak around 270 mg dl−1 for both groups (see figure 4 for trend examples). This large variation across patients is not an aberration; rather, it can be attributed to the influence of individual factors such as metabolism, medication, diet, physical activity and several others [37, 38]. During the clinical study, type 1 diabetics received the necessary amount of insulin, whereas type 2 diabetics did not get additional medication. This also results in distinct glucose trends. The mean glucose level across all patients (figure 4) increased from about 150 mg dl−1 (fasting state) to >250 mg dl−1 (postprandial), which is a higher level than the normal range of healthy people [39], confirming that diabetics were sampled.
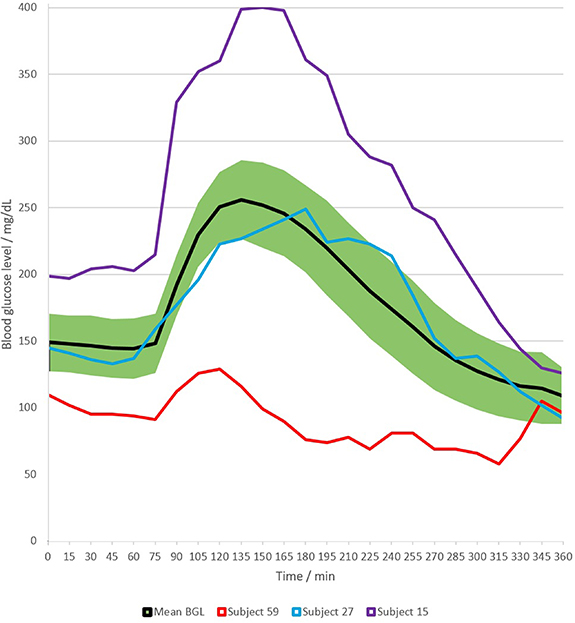
Figure 4. Mean BGL trend across all subjects (green band shows standard deviation), with examples of individual trends (both subjects 15 and 59 of type 1, subject 27 of type 2).
Download figure:
Standard image High-resolution imageTable 2. Minimum and maximum of blood glucose values during the phases of sampling.
| Phase of sampling | Minimum value (mg dl−1) | Maximum value (mg dl−1) |
|---|---|---|
| Fasting state | 72 | 271 |
| Postprandial, peak | 129 | 400 |
| Postprandial, after 3–4 h | 48 | 200 |
| End | 56 | 240 |
About 500 single VOCs were detected in exhaled breath. The mean intensity of every VOC (in ion s−1) was correlated to the glucose value recorded in parallel prior to the particular breath sampling. The goal was to identify VOCs from breath that respond best to changes in BGL as these could be further explored as markers for glucose monitoring. Table 3 shows the VOCs with best correlation to BGL based on the Pearson correlation coefficient r. Figure 5 shows the associated boxplots for the r-values.
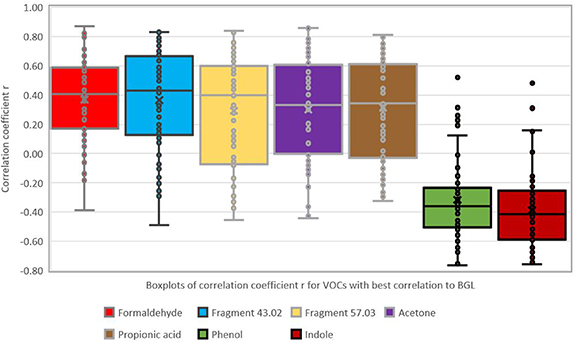
Figure 5. Boxplots of correlation coefficients for VOCs with best correlation to BGL (as listed in table 3).
Download figure:
Standard image High-resolution imageTable 3. VOCs with best correlation and number of patients with significant correlation. Bold values denote values with statistical significance (see text for details).
| Mass peak (m/z) | Mean r | Median r | Std. dev. of r | Nr. of subjects (p < 5%) | Nr. of subjects (p < 10%) | Tentative assignment | Sum formula |
|---|---|---|---|---|---|---|---|
| 31.018 | 0.37 | 0.41 | 0.29 | 31 | 34 | Formaldehyde | [CH2O + H]+ |
| 43.018 | 0.37 | 0.43 | 0.33 | 34 | 34 | Ion fragment | [C2H2O + H]+ |
| 57.033 | 0.29 | 0.40 | 0.38 | 32 | 36 | Ion fragment | [C3H4O + H]+ |
| 59.049 | 0.30 | 0.33 | 0.35 | 29 | 34 | Acetone | [C3H6O + H]+ |
| 75.044 | 0.31 | 0.34 | 0.34 | 27 | 32 | Propionic acid | [C3H7O2 + H]+ |
| 95.049 | −0.32 | −0.36 | 0.28 | 28 | 35 | Phenol | [C6H6O + H]+ |
| 118.065 | −0.39 | −0.42 | 0.27 | 36 | 42 | Indole | [C8H7N + H]+ |
The significance of correlation depends on batch size. During this study, each subject was tested with a series of at least 26 single samplings for both breath and BGL. This implies a minimum of 24 degrees of freedom in a two-tailed significance test. In this case the threshold for significance (at 5% error level) is a value of r > 0.39 (or r < −0.39). At an error level of 10% the critical value is r > 0.33 (or r < −0.33) [40].
Data in table 3 show that the only compound with a statistically significant mean correlation coefficient (at error level of 5%) is the mass peak at m/z 118.066, tentatively assigned to indole. This is also the compound with the lowest variance (lowest standard deviation of r). To account for outliers (e.g. for the m/z tentatively assigned to indole or phenol, shown in figure 5 using boxplots) the median correlation coefficient can be considered instead of the mean. In this case, correlation is also significant for the mass peaks m/z 31.018 (tentatively assigned to formaldehyde), two ion fragments at m/z 43.018 and m/z 57.033 and the compound with m/z 95.049 (tentatively assigned to phenol). Table 3 also shows that the compound m/z 118.065 (indole) gives the highest number of subjects with statistically significant correlation (36 from the total of 60) based on an error level of 5% or 42 subjects based on an error level of 10%.
No further VOCs were found with significant mean correlation to glucose trends apart from the compounds listed in table 3 (bold values). Some compounds showed significant correlation at occasional level in a smaller number of subjects. These are the compounds tentatively assigned to acetic acid (mass peak m/z 61.028), butyric acid (m/z 89.058) and propionamide (m/z 74.036), with a number of affected patients of 23–26 (at an error level of 5%).
The mean trend of m/z 118.065 (indole) during complete sampling time is shown in figure 6. Intensity levels (absolute count rate in ions s−1) for this mass peak varied by more than one order of magnitude across subjects. In sober state, mean count rates for m/z 118.065 were in the range of 50–1500 counts s−1. A mean value calculated from the count rates might be biased due to very different ranges. Therefore, relative signals were calculated by normalizing values per patient to the respective minimum and maximum during the time series. The mean relative indole trend closely resembles the mean glucose trend as shown in figure 4, which is overlaid as a relative trend in figure 6 (not 5) 5. After the meal, indole levels decrease simultaneously to the increase of BGL.
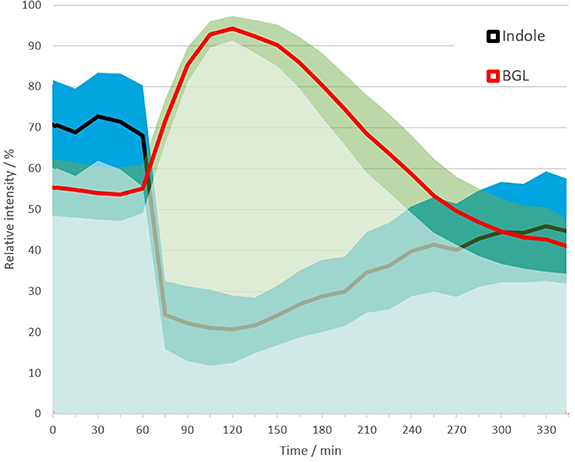
Figure 6. Mean relative trends of indole and BGL during measurement time across all subjects. Bands shows standard deviation.
Download figure:
Standard image High-resolution imageThe tentative assignment of m/z 118.065 to indole was confirmed by reference sampling with pure indole (see figure 7). This validation was also performed to confirm the tentative assignment for the compounds (sum formula) at mass peak m/z 31.018 (formaldehyde), m/z 59.049 (acetone), m/z 61.028 (acetic acid), m/z 75.044 (propionic acid) and m/z 95.049 (phenol). For m/z 74.04 (propionamide) validation was not possible as the pure compound was not commercially available. No other plausible assignment was found within ±30 ppm, therefore propionamide is assumed correct (as were the other validated assignments).

Figure 7. Stacked spectra of pure indole (blue line) and breath sampling (red line) for assignment validation. The tool 'Composition and Isotopes' suggests ([C8H7N + H]+) (green bar) as best assignment for the peak at m/z 118.07.
Download figure:
Standard image High-resolution imageThe assignment of indole at m/z 118.065 was also crosschecked to avoid bias or errors due to overlap by the isotope-peak of m/z 117.092. Figure 8 shows the mass spectrum of a sample recorded in sober state (i.e. higher indole concentration). The peak at m/z 117.092 is assigned with good score to the sum formula [C6H12O2 + H]+ (which could be a common compound like butyl acetate). The corresponding isotope peak at m/z 118.094 is not baseline-separated, but very clearly separated from the indole peak at m/z 118.065. All spectra are mass calibrated with the same reference peaks and all peak positions are predefined by the settings of the peak list (see section 2.5). A fitting error or bias due to peak overlap is therefore highly unlikely. This remains valid although the intensity of both peaks at m/z 117.092 and m/z 118.065 varied throughout the recorded samples by more than one order of magnitude.
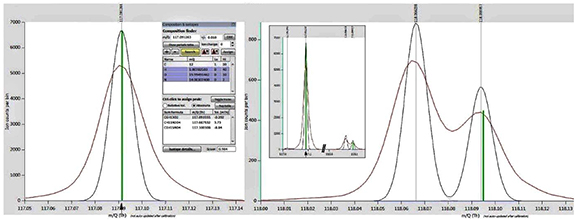
Figure 8. Mass spectrum (red line) with peak fitting (black line) of peaks at m/z 117.09 (left side), m/z 118.06 and m/z 118.09 (both right side). The software tool 'Composition and isotopes' suggests a sum formula of [C6H12O2 + H]+ (left, green bar) as best assignment for the peak at m/z 117.09. This also gives a good match to the isotope peak at m/z 118.09 (right, green bar). The indole peak at m/z 118.06 is clearly separated from the isotope peak. Note that for clarity the y-axis of left and right side has different scaling. The insert on the right side shows the real scaling of the peaks.
Download figure:
Standard image High-resolution imageIndole is the most abundant metabolite from microbial digestion of the amino acid tryptophan. In contrast, human metabolism does not convert tryptophan to indole [41]. Bacteria from the genera Escherichia, Bacteroides and Clostridium, which are present in the human intestine, can synthesize indole from tryptophan due to the enzyme tryptophanase [42]. This leads to a constant indole level in the human intestine. Results from a study performed with L-colonic cell lines from rats indicate that indole is a possible signaling molecule for stimulation of the glucagon-like-peptide-1 (GLP-1), which is needed for an accurate insulin response [43]. In this study, indole is described to diffuse across the membrane of intestinal cells and increase GLP-1 secretion by blocking the voltage-gated K+ channel and consequently increasing intracellular Ca2+ concentration. Prolonged increase of intracellular indole concentration, however, reduces GLP-1 secretion by decreasing mitochondrial ATP production due to the blocking of NADH dehydrogenase (see figure 9) [43]. This can explain the decrease of extracellular indole levels in case of a postprandial (extracellular) increase of glucose levels. The decrease of extracellular indole levels is reflected in the drop of indole levels in breath (see figures 10 and 11). In addition, the study [43] discovered that the described processes are reversible. This can explain an increase of extracellular indole during BGL decrease. As soon as extracellular glucose levels drop, indole diffuses out of cells again and detaches from K+ channels. Although indole is a product of intestinal bacterial metabolism, it is probably included in host metabolism as a signal molecule. Since a large number of intestinal bacteria can produce indole and the reversible processes triggered by indole improve glucose homeostasis, indole might be a suitable marker for BGL prediction. However, further research is needed to verify the indole metabolism on human cells compared to the model described in [43] for rat cells.
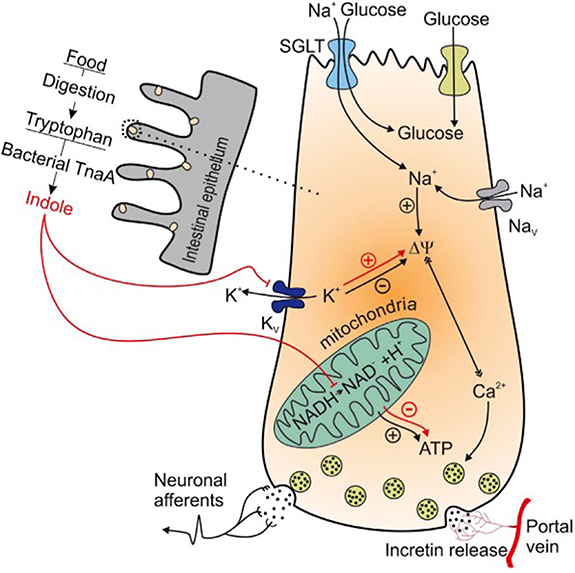
Figure 9. Intra- and extracellular processes of indole produced from gut bacteria in L colonic cells. Reproduced from [43]. CC BY 3.0.
Download figure:
Standard image High-resolution image
Figure 10. Mean relative trend of formaldehyde, acetone and phenol versus BGL during measurement time across all subjects.
Download figure:
Standard image High-resolution image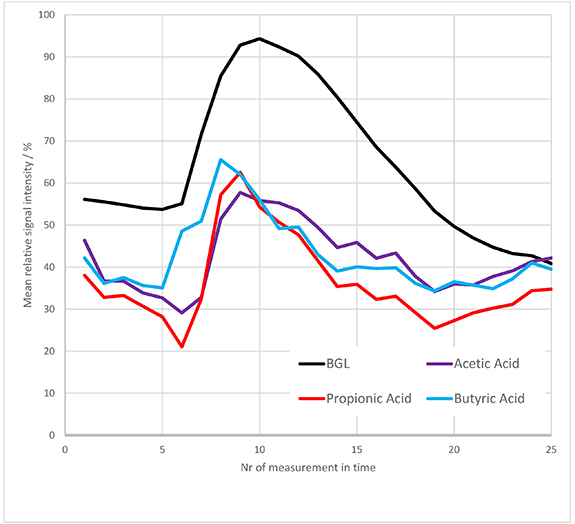
Figure 11. Mean relative trends of acetic acid, propionic acid and butyric acid versus mean relative BGL.
Download figure:
Standard image High-resolution imageAcetone and formaldehyde are compounds produced in human metabolism (endogenous VOCs). Acetone is produced in the liver during fatty acid metabolism and is frequently investigated in humans' exhaled breath [15]. Diabetics can have substantially higher acetone concentrations in breath than healthy people due to their disturbed metabolism (e.g. a factor of 2–3 higher levels in type 2 diabetics [5]). A correlation of acetone in breath to BGL is mentioned in a number of previous studies and our findings support this. For example, a recent study with similar setup to the present one recorded VOC-profiles of 22 diabetic children (type 1) during nine hours covering two meal events [44]. VOC correlation versus BGL was focused (not explorative) on seven VOCs of interest. Three VOCs showed significant correlation to BGL. Acetone gave the best correlation, followed by 2-propanol and pentanal. However, due to influence of several other metabolic factors in the human body, acetone concentration in breath is not a reliable stand-alone marker for BGL (see section 1). Formaldehyde is synthesized in humans by amino acid metabolism, methanol metabolism, lipid peroxidation, and P450-dependent demethylation [45]. As a result, a change in formaldehyde concentration in breath following carbohydrate consumption is plausible, as digestion may alter the mentioned metabolic pathways. Formaldehyde is also present in exogenous VOC sources such as tobacco smoke or the sweetener aspartame. Therefore, formaldehyde should also not be used as a stand-alone marker in breath for BGL.
Phenol (m/z 95.045) in exhaled breath is a product from the catabolism of the amino acid tyrosine through cleavage by the enzyme Tyrosine Phenol Lyase [46]. Phenol has been reported previously in breath analyses and investigated for diagnostic applications [47]. In addition, elevated levels of phenol have been associated with fasting condition [48]. Tyrosine has been associated with decreased insulin secretion and elevated glucose levels [49] as well as insulin resistance [50].
Mean relative time trends of formaldehyde, acetone and phenol versus mean BGL trend are depicted in figure 10. Acetone and formaldehyde show an increase and later decrease but do not clearly respond to the glucose event. Phenol shows this response much more clearly, with negative correlation to BGL similar to indole (figure 6).
The VOCs tentatively assigned to acetic acid (m/z 61. 03), propionic acid (m/z 75. 05) and butyric acid (m/z 89. 09) did show significant correlation to BGL on occasional level (i.e. in 23–27 of 60 subjects, based on an error level of 5%). Figure 11 compares the mean relative trends of these VOCs to the mean BGL trend across all subjects. The trend of the three VOCs rises simultaneously with the glucose event. Notably, after reaching a peak value the three VOCs decline earlier than the BGL trend. The time lag between the maximum in the VOC trend and the maximum BGL is 1–2 sampling points, i.e. 15–30 min.
The three VOCs acetic acid, propionic acid and butyric acid belong to the group of so-called short-chain fatty acids (SCFAs). SCFAs originate from bacterial fermentation in the large intestine, metabolizing carbohydrates that are not fully absorbed in the small intestine [51, 52]. This can explain the trends depicted in figure 11. A part of the carbohydrates are digested by human intestinal cells and absorbed to the bloodstream, thus causing a rise in BGL [53]. Other carbohydrates (e.g. fibers) enter the large intestine where bacteria metabolize them to SCFAs.
SCFAs are rapidly further metabolized, e.g. as an energy source for intestinal cells or in the lipid and cholesterol metabolic pathway [54]. The two different metabolic pathways involved (human versus bacterial) might explain the faster decrease of SCFA levels in breath compared to BGL.
Similar VOC trends were found in a respiratory study based on an oral glucose tolerance test [23]. This confirms both the proposed assignment of the VOCs to SCFAs and the metabolic origin of these VOCs.
The discussed SCFA-VOCs do not accurately reflect the patient's BGL over the full time observed. As shown in figure 11 only the starting increase of BGL is correctly reflected, while maximum and decrease are earlier than BGL. SCFAs also showed a huge variation across patients, e.g. count rates of propionic acid did vary from about 1500 ions s−1 to about 21 000 ions s−1. This can be due to different conditions of gut microbiota or medication. Therefore, such exogenous VOCs (of bacterial origin) are not suitable as stand-alone markers for BGL prediction.
VOCs with m/z of 43.03 and 57.04 also showed good correlation to BGL (see table 3) and were tentatively assigned as 'ion fragments'. Fragmentation is a process that can take place in the drift tube of the PTR-TOF instrument. After protonation, molecule-ions can break apart in smaller neutral molecules and fragment ions. Adding the molar mass of water (18 g mol−1) to m/z 43.03 and m/z 57.04 gives the m/z 61.03 (acetic acid) and m/z 75.05 (propionic acid). Also, time trends of these fragments and the SCFAs are similar (see figure 12). This supports the assignment of the two fragment ions as main fragments of acetic acid and propionic acid. As with the pure SCFAs, their fragments must be carefully used for BGL prediction. Fragments can also originate from other molecules not linked to glucose metabolism. For example, fragment m/z 43.03 was also found in reference sampling of pure butanone. Butanone is present in human breath in higher concentrations [55], but did not show any correlation to BGL. Nevertheless, SCFAs and their fragments can support a glucose prediction algorithm if additional markers are included and a robust database is present.
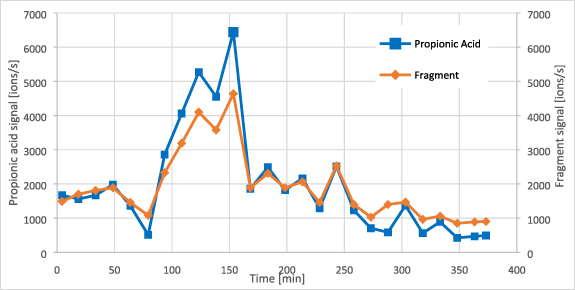
Figure 12. Trend of propionic acid and fragment m/z 57.04 in a type 1 diabetic patient (male, 69 years old).
Download figure:
Standard image High-resolution imageResults of VOC-trends were also compared between the two groups of diabetic subjects to find differences as a potential insight into the disease of diabetes. The mean relative trend of indole divided along the two groups is shown in figure 13 and compared to the relative BGL. Correlation coefficients to BGL of compounds listed in table 3 were also divided in groups and are shown in table 4.

Figure 13. Mean relative trend of indole versus relative BGL splitted among groups of subjects with type 1 and type 2 diabetes.
Download figure:
Standard image High-resolution imageTable 4. Group-wise comparison of correlation coefficients for the compounds listed in table 3 (SD is standard deviation).
| Compound | Subject group | Mean correlation coefficient r | SD of r |
|---|---|---|---|
| Indole | T1 | −0.35 | 0.26 |
| T2 | −0.41 | 0.29 | |
| Formaldehyde | T1 | 0.40 | 0.28 |
| T2 | 0.33 | 0.30 | |
| Propionic acid | T1 | 0.24 | 0.35 |
| T2 | 0.38 | 0.33 | |
| Acetone | T1 | 0.33 | 0.34 |
| T2 | 0.31 | 0.36 | |
| Phenol | T1 | −0.26 | 0.27 |
| T2 | −0.34 | 0.30 |
Neither indole trend nor correlation coefficients are significantly different among the two groups. This was similar for the other two SCFAs (acetic acid and butyric acid) discussed above.
3.2. Additional experiments
The increase in VOCs observed immediately after ingestion of carbohydrates led to the assumption that recorded VOCs might directly originate from food or from bacterial metabolism in the oral cavity. To investigate this, additional experiments were performed with a healthy 22 year old subject (see experimental). In the first test, the subject consumed a breakfast (BF) as described in table 1 but on different days and with varied composition (at constant load of carbohydrates). The change in composition was not reflected in the recorded VOC trends (see figure 14 showing the trends of m/z 74.04 propionamide). Other VOCs from table 3 (including indole) showed similar behavior.
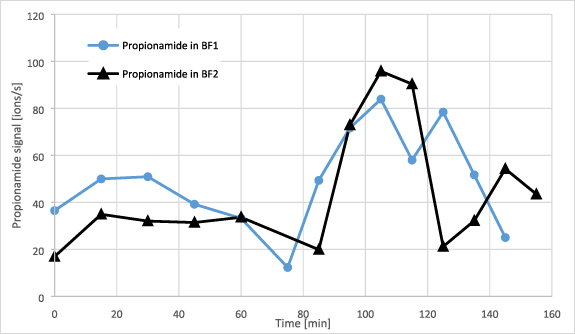
Figure 14. Trend of propionamide during the two breakfast (BF) experiments with varied amounts of ingredients.
Download figure:
Standard image High-resolution imageA second test investigated the effect of repeated washings of the oral cavity with glucose solution (without swallowing) before and after breath sampling. This caused a slight increase of a few VOCs but ten times less compared to the increase after meal consumption. In addition, signal increase after mouth washing with glucose solution lasted significantly shorter (<5 min) than the time lag between BF and the respective signal increase (about 15 min). Thus, VOCs from food or bacterial metabolism in the oral cavity should not interfere with VOC trends recorded more than ten minutes after a meal. VOCs generated during digestion can only manifest in exhaled breath by entering the bloodstream and by subsequent gas exchange in the lungs (see section 1).
Two further experiments were performed to differentiate exogenous VOCs of bacterial origin from endogenous VOCs from human metabolism. The first test consisted of ingestion of a lactulose solution. Lactulose is a disaccharide (galacto-fructose) that cannot be digested by humans but only by intestinal bacteria [56]. It is metabolized mainly to SCFAs [57]. During this experiment, the subject's BGL and indole level remained constant (see figure 15). Minor fluctuations in BGL were within the measurement accuracy of the glucose meter. However, the SCFA trends in breath (acetic acid and propionic acid) showed a similar rise and decrease as in BF experiments (figure 16). This is further evidence that SCFAs originate from the digestion metabolism of intestinal bacteria. It is also evidence that this metabolism does not alter indole concentration.
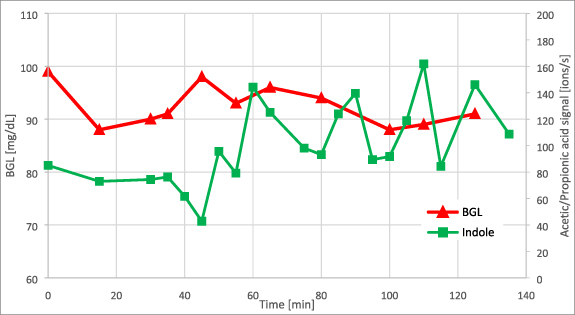
Figure 15. Trend of indole against BGL during lactulose test. Lactulose intake was at t = 30 min.
Download figure:
Standard image High-resolution image
Figure 16. Trend of acetic acid and propionic acid against BGL during lactulose test. Lactulose intake was at t = 30 min.
Download figure:
Standard image High-resolution imageIn a second experiment, the healthy subject performed two oral glucose tolerance tests with solutions of normal glucose and labeled 1-13C glucose. BGL and VOC trends were recorded over time as before. VOC-trends were similar to those in BF experiments. However, in this case the isotopic pattern of the studied VOCs was different due to the 13C-label. In PTR-TOF-analyses, a molecule M of interest is analyzed at the m/z value of the protonated ion [M + H+]. Experiments with normal and labeled 13C-glucose enable comparison of VOC-metabolites at the normal [M + H+] mass peak versus the [(M + 1) + H+] mass peak from the 13C label (one m/z unit higher). Figure 17 shows this signal change during the two tests for the masses of acetic acid, propionic acid and indole. VOC-signals were cumulated during the postprandial time-range with high glucose levels (i.e. BGL > 140 mg dl−1; sober state was at a BGL of about 90 mg dl−1). Significantly increased signals of the [(M + 1)+ H+]-peak for acetic acid and propionic acid were observed during the experiment with 1-13C labeled glucose. Notably, indole levels did not change.
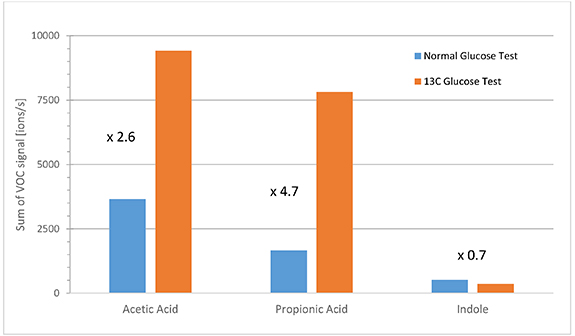
Figure 17. Cumulative signals during postprandial phases of glucose tolerance tests with normal glucose and labeled 1-13C glucose. Signals of 13C-acetic acid, 13C-propionic acid and 13C-indole were summed during phases with BGL > 140 mg dl−1.
Download figure:
Standard image High-resolution imageIn glycolysis, pyruvate is formed from degradation of glucose by metabolic processes of various enzymes. The C1- and C6-atoms of glucose rearrange to the C3-atom of pyruvate (see figure 18). Since two molecules of pyruvate are formed from one molecule of glucose, only one pyruvate contains the labeled 13C1-atom. Glycolysis continues with pyruvate decarboxylation (at position C1) and formation of acetate. The C3-atom of pyruvate becomes the C2-atom of acetic acid (acetate). The labeled 13C-atom is now the C2-atom of acetic acid [58]. This inclusion of the labeled 13C-atom is similar for other SCFAs, since they are also formed from pyruvate [54].

Figure 18. Metabolic pathway of individual carbon atoms starting from glucose [58].
Download figure:
Standard image High-resolution imageThe glycolysis scheme in figure 18 explains the increase of 13C-signal of SCFAs in the experiment with labeled 13C-glucose compared to the same experiment with normal glucose (figure 17). This result validates that SCFAs in breath originate directly from glycolysis. The lack of change in the 13C-signal of indole indicates that indole in breath is not directly affected by bacterial glycolysis (confirming the result of the lactulose experiment).
As an example for the option of breath based CGM, a simple (personalized) quantitative model for BGL prediction was computed for the healthy male subject using the VOCs acetic acid, propionic acid, butyric acid and indole. The model was created using breath data from the two BF experiments. The model was used to predict BGL values on two different following days. The predicted trends showed satisfactory accuracy with a mean relative error of about 10% (see figure 19).

Figure 19. Example of a prediction model for BGL (in a healthy subject) using a model based on three SCFAs and indole.
Download figure:
Standard image High-resolution image
4. Conclusion
The present work reports a clinical study with 60 diabetic patients (30 of type 1 and 30 of type 2) aimed to investigate on-line analysis of exhaled breath via PTR-ToF-MS in parallel to BGM. The goal was to find VOCs in exhaled breath of diabetic subjects that correlate to changes of BGL within 5 h after the intake of food. Such VOCs could become markers to enable breath-based non-invasive glucose monitoring.
Relevant VOCs showing said correlation (at 10% error level) were filtered out in an exploratory analysis from more than 500 mass peaks from individual breath spectra. The VOCs are indole, acetone, formaldehyde, phenol and propionic acid.
The VOC with best mean correlation to BGL across all subjects was indole. Correlation was statistically significant (at 5% error level) in 36 from 60 subjects. The type of diabetes did not affect results. Indole is a product of tryptophan breakdown in intestinal bacteria. Unlike other metabolites of gut bacteria, indole is unaffected by carbohydrate breakdown for energy usage. This was the result of additional experiments of one healthy male using ingestion of lactulose and labeled 13C-glucose. Indole has been mentioned as a potential signal molecule for BGL homeostasis [43]. It can thus be a tentative marker for non-invasive CGM. However, the bacterial origin of indole implies limitations of this application due to between-person variations in the human intestinal flora [52]. Many but not all types of intestinal bacteria can metabolize tryptophan, thus an unfavorable correlation of indole to BGL cannot be excluded. Microbial patterns might be largely stable over time [52] but they can be influenced due to diabetes and associated medication. The use of bacterial metabolites such as indole or SCFAs as markers in breath must be considered with caution.
Breath based BGL predictions can be based on PTR-ToF-MS data using personalized algorithms. Specific gas sensors for relevant VOCs in exhaled breath will be an important step for progress in this field. Use of a PTR-ToF-MS system is a feasible approach for an explorative clinical study, but not feasible for diagnostic applications as it is expensive, difficult in logistics and not readily accessible to general research.
Acknowledgments
We thank Dr Eugen Hartungen (Ionicon Analytik GmbH) for assistance with transport and setup of the PTR-ToF-MS. We also thank Dr Sebastian Schauer (IDT Ulm) for assistance during the clinical study.
Data availability statement
The data that support the findings of this study are available upon reasonable request from the authors. Please contact the corresponding author.
Funding
This work was funded by Roche Diabetes Care.
Ethical statement
Results were obtained from a clinical study with the Roche-internal code CIR_DC000069.
The study was carried out by the Institute of Diabetes Technology in Ulm, Germany.
The responsible ethics committee approved the study protocol.
Informed consent was obtained from each subject prior to the study procedure at the screening visit according to the regulatory and legal requirements in Germany. Subjects who did not meet the selection criteria were not included in the study.