
Abstract
Ketone testing is an important element of the self-management of illness in type 1 diabetes. The aim of the present study was to see if a breath test for acetone could be used to predict quantitatively the levels of the ketone betahydroxybutyrate in the blood of those with type 1 diabetes, and thus be used as an alternative to capillary testing for ketones. Simultaneous capillary ketones and breath acetone were measured in 72 individuals with type 1 diabetes attending a diabetes clinic and on 9 individuals admitted to hospital with diabetic ketoacidosis. Capillary blood measurements ranged from 0.1 mmol l−1 (the lower limit of the ketone monitor) to over 7 mmol l−1, with breath acetone varying between 0.25 and 474 parts per million by volume. The two variables were found to be correlated and allowed modelling to be carried out which separated breath acetone levels into three categories corresponding to normal, elevated and 'at risk' levels of blood ketones. The results on this limited set of participants suggest that a breath acetone test could be a simple, non-invasive substitute for capillary ketone measurement in type 1 diabetes.
Export citation and abstract BibTeX RIS

Original content from this work may be used under the terms of the Creative Commons Attribution 4.0 license. Any further distribution of this work must maintain attribution to the author(s) and the title of the work, journal citation and DOI.
1. Introduction
It has long been known that elevated levels of breath acetone can occur in individuals with untreated type 1 diabetes [1], and there has been much effort devoted to studies attempting to show the usefulness of acetone breath testing in the management or diagnosis of the disease [2–5]. Acetone is formed by the decarboxylation of a ketoacid, acetoacetic acid, which is virtually 100% dissociated in the blood to form the acetoacetate anion (AcAc). Acetone is highly soluble in blood plasma, and appears in breath following gas exchange in the alveoli. Normal levels of acetone in the breath are between 0.3 and 1 parts per million by volume (ppm) [1] and correspond to plasma levels of approximately 0.03 mmol l−1 [6], with AcAc of the order of 0.02–0.1 mmol l−1 [7]. However when insulin levels are low, the concentration of acetone increases as a result of the mechanism controlling the formation of its precursor, AcAc. Insulin mediates the concentrations of non-esterified fatty acids (NEFA) in the blood by providing a route for their esterification, and increased concentrations of NEFA caused by low insulin levels result in the rates of both transport into the hepatic mitochondria and conversion therein to AcAc being increased [8]. AcAc can be reduced to betahydroxybutyric acid, which again is virtually fully dissociated, forming the betahydroxybutyrate anion, βHB [1]. AcAc and βHB can increase in concentration when insulin is deficient or ineffective, with βHB predominating [8]. Acetone, AcAc and βHB are collectively referred to as 'ketone bodies' in the blood: acetone is present as the neutral molecule, whilst the other two species are anions and thus their production from the two ketoacids also yields hydrogen ions. Excess ketoacids formed when insulin is insufficient can therefore give rise to a significant lowering of the blood pH if the normal buffering action of bicarbonate is overwhelmed, ultimately resulting in diabetic ketoacidosis, DKA.
People with type 1 diabetes are advised to self-check for elevated ketone levels, following 'sick day' protocols [9], and two such tests are available. AcAc is eliminated in urine, and urine dipstrips are able to measure the concentrations: these are cheap, but their interpretation is limited because ketones in urine lag behind blood values, and the tests can be influenced by other metabolites [8]. The preferred method is by an enzymatic electrochemical blood assay of βHB using a fingerprick sample and there are a number of proprietary brands of ketone meters and strips which are prescribed to people with type 1 diabetes.
The commonly used Diabetes UK and TREND 'Sick Day' guidelines suggest that βHB capillary levels measured below 0.6 mmol l−1 are normal and should not give rise to concern, while levels between 0.6 and 1.5 mmol l−1 indicate that more ketones are being produced than normal, and a further test should be carried out after 2 h. Values between 1.6 and 3 mmol l−1 indicate there is a risk of developing DKA and additional correction doses of rapid insulin are required, while ketone levels above 3 mmol l−1 require larger correction doses and to seek medical advice [10].
Measurement of breath acetone as an alternative to blood βHB could be attractive as a non-invasive method for early detection of ketone formation in type 1 diabetes. A small number of studies have examined this relationship quantitatively. One of the earliest investigations found elevated levels of both breath acetone and blood βHB in individuals admitted with DKA [6], with blood βHB levels measured up to 10 mmol l−1, a factor of approximately 20 above normal levels. Breath acetone was seen up to 600 ppm: normal levels as discussed later are of the order of 0.5–1 ppm, showing the very marked increase in this breath constituent. In 1982 Owen et al published an important study of nine DKA subjects [11], measuring a range of parameters including all three blood ketones together with breath acetone. Blood βHB ranged from 6–18 mmol l−1 with breath acetone between 50 and 350 ppm. Animal studies have also shown positive correlations: Sun et al found that breath acetone sampled from type 1 diabetic rats showed values which increased with blood βHB [12]. Correlations have also been explored for participants with type 2 diabetes [2, 13–15]. In one such study of 99 individuals grouped according to their urine ketone levels, it was found that the higher the average level of urine ketones, the higher the levels of both breath acetone and blood βHB [2], with values of the latter up to 3 mmol l−1. Other investigations however have found correlations only at low acetone/βHB levels [14, 15], with only a weak correlation at higher levels (up to βHB concentrations at the dangerously high values of 6–7 mmol l−1) [14].
Far more extensive studies have been carried out on the measurement of blood βHB and breath acetone during dieting, as increases in both of these are expected because of increased AcAc formation when body fat is burnt as fuel in the absence of glucose [16–18] and the literature up to 2015 has been comprehensively reviewed [18]. For example, Tassopoulos et al [16] found that prolonged fasting (10–36 d) in obese patients led to breath acetone values of over 100 ppm, with blood βHB above 3 mmol l−1. Anderson [18] has summarised the findings from a number of dieting studies together with the type 2 diabetes grouped measurements of Qiao et al [2] in the form of an exponential relationship between the two variables. Similar increases are seen during a high fat/low carbohydrate diet [19], and the effect of exercise on the relationship between breath acetone and blood βHB has also been explored [20].
In 2014 we published a study of 113 children with type 1 diabetes [21] attending a clinic at the Oxford Children's Hospital (OCH), and found a significant positive correlation between breath acetone and capillary βHB when both constituents were within normal bounds, in this case between 0.1 and 0.4 mmol l−1 for βHB and 0.4–2 ppm for breath acetone. We concluded that breath acetone appeared to be a useful predictor of blood βHB, but our study lacked data on higher levels of blood ketones, particularly those found in individuals with DKA. The aim of the present study of participants with type 1 diabetes was to see if such a correlation exists over as wide a range of these variables as possible. Capillary βHB was the blood measurement of choice, as it is routinely used for testing and management of type 1 diabetes, and as a check a subset of the participants had βHB measured by both capillary and blood plasma methods. If such a correlation can be shown, then it opens the possibility that a breath test can be used as a non-invasive management tool for the determination of ketone values for those with type 1 diabetes.
2. Methods
The study was designed to produce as wide a range of breath acetone and blood ketone samples as possible from both clinic attendees and DKA admissions. Two cohorts were selected. First, adults with type 1 diabetes were asked to provide a breath and capillary blood sample, as well as an optional venous blood sample. Each volunteer had samples taken at a single clinic visit (both morning and afternoon clinics were used, and we comment below on the influence of the time of day upon acetone in breath). Fingerprick samples were analysed for capillary βHB with an Abbott Freestyle Optium Meter (resolution 0.1 mmol l−1). Venous samples were immediately centrifuged and plasma stored (77 K) for later batch analysis for βHB. Serum βHB was measured in our routine hospital biochemistry lab using an automated LiquiColor® kit using β-hydroxybutyrate dehydrogenase (Stanbio Laboratory, Texas, USA), monitored at 510 nm on a Konelab 30 analyser. The method reproducibility, expressed as between batch % coefficient of variation, was 2.2% at 0.57 mmol l−1 and 4.8% at 2.81 mmol l−1 and ongoing performance was monitored through participation in an external quality assurance programme.
For breath samples, the participant made a complete exhalation by blowing through a drinking straw into a breath bag (FAN GmbH), such that the sample in the bag (300–400 ml) was continuously refreshed as a result of excess breath eliminated in the space between the straw and the neck of the bag. The bag was sealed at the end of the exhalation and analysed within 24 h by Ion Molecule Reaction Mass Spectrometry (IMR-MS), (V&F Airsense, operating with a Hg ion source for optimum acetone detection). CO2 was simultaneously analysed, and the instrument was calibrated regularly with standard acetone/air and CO2/air mixtures (BOC). The advantage of the IMR-MS technique is that the parent ion dominates, with little fragmentation, so that the signal at m/z = 58 is a true representation of the acetone concentration in the presence of other breath gases [21]. The breath samples had been shown in previous studies to undergo negligible degradation over a 24 h analysis delay [21].
A second cohort consisted of those with type 1 diabetes admitted to hospital with DKA. Capillary βHB values were determined as early as possible after admission—this was in all cases before treatment commenced as it formed an integral part of DKA diagnosis. Breath acetone samples were taken (via breath bags) as soon as possible after the capillary blood samples, and in all cases reported in this paper after a delay of less than 4 h (average delay 1.9 h). A control group consisted of ten adult volunteers with no previous history of diabetes who all provided venous and capillary blood samples paired with a breath sample.
All volunteers gave written informed consent and ethical permission was granted by the NRES Committee South Central—Berkshire (ref. 15/SC0285, adult volunteers) or the West of Scotland Research Ethics Committee 3 (ref. 12/WS/0164, paediatric volunteers). Experimental protocols and patient information and consent forms were approved by the Head of Clinical Trials and Research Governance, University of Oxford. All research was performed in accordance with the relevant guidelines and regulations.
All data were anonymised. The study size was designed to result in as high a quality of statistical analysis as possible, but with the aim that the inclusion of DKA data would address the previous study shortcomings [21] of few samples outside the normal range of βHB and acetone values.
Results were processed for Spearman's rank correlation and, where linearity was assessed, by Pearson's correlation. A cumulative link model [22] was used to assess the probabilities of acetone measurements lying within a set of ranges of blood ketone values.
3. Results
Seventy-two volunteers provided simultaneous breath and capillary (fingerprick) blood samples, with 47 further consenting to give a venous blood sample. Nine individuals diagnosed with DKA participated, six adults and three children. For two of the adults with DKA, additional breath samples were collected as a function of time during treatment.
3.1. Correlation between capillary βHB and breath acetone occurs across the range of values
Figure 1 shows the 72 clinic measurements and 9 DKA measurements for which capillary βHB and breath acetone were measured, presented on a log—log scale. Measurements in the clinic had βHB and acetone measured simultaneously. In all DKA cases the βHB values plotted in figure 1 were those taken on admission. In two of these, where breath acetone was measured at the longest delay, 4 h after admission, βHB had reduced by 18% and 39% respectively from the admission values, and the validity of including these two data points is discussed later. All other individuals with DKA (where delays were between zero and 2 h) had the same βHB values measured on admission and at time of acetone measurement.
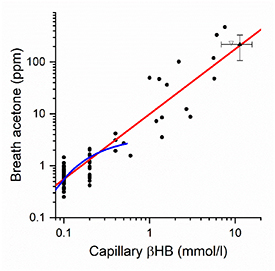
Figure 1. Breath acetone and capillary blood ketones (βHB) measured for individuals with type 1 diabetes attending a clinic (n= 72) or admitted to hospital with DKA (n= 9). Data are plotted as filled circles on a double logarithmic scale, with a straight line fit shown in red (Pearson's r = 0.921, p < 10–6). Also plotted are the averaged results for DKA from [11], filled triangle, and the single DKA measurement from [6], open triangle. The blue curve is the fit at low values of both variables found from the previous study of 113 children with type 1 diabetes [21].
Download figure:
Standard image High-resolution imageWe first note the grouping of many data points at low βHB concentrations 0.1, 0.2 and 0.4 mmol l−1 as a result of the precision of instrument used for the capillary βHB measurements (±0.1 mmol l−1). As with our previous study on children with diabetes, the majority of volunteers were fit and well at their clinic visit and so had βHB levels within normal limits (0.1–0.4 mmol l−1). Six clinic attendees had higher values, between 0.5 and 1.4 mmol l−1, and all those admitted with DKA had values above 1.4 mmol l−1, with a maximum concentration of 7.6 mmol l−1. The βHB and breath acetone concentrations are highly correlated (Spearman's ρ = 0.69, p < 10–6) and a straight line fit to the logarithms of these two variables is shown in figure 1 with slope 1.25 ± 0.06 (Pearson's r = 0.921). Also shown is the function fitted to the data of the previous OCH study with the limited range of βHB values [21], together with published results on DKA taken from the literature [6, 11].
The breath collection method was designed to ensure that the samples were as close to being representative of alveolar breath as possible, and as a check each breath bag sample was simultaneously analysed by IMR-MS for CO2. Values were close to those expected for end tidal CO2 (an average of 4.4 ± 1% compared to 5% expected for end tidal CO2 [23]) Furthermore, when the acetone results were individually normalised to a 5% CO2 level the correlation plot of figure 1 was essentially unchanged (Spearman's Correlation of 0.70 compared to 0.69 without normalisation and with the slope of the plot 1.32 ± 0.06 with a Pearson's r of 0.925 compared to slope = 1.25 ± 0.06 with r = 0.921 without normalisation). Sampling close to the initial exhalation can change the acetone (and CO2) concentrations by up to a factor of 2 [23], but our results indicate that improper sampling is not an issue in the present experiments.
All subjects exhaled through a straw of diameter 5 mm. We note that effects of sampling via such small mouthpieces has been noted: for healthy patients a change of acetone concentration of 3% was measured when the mouthpiece cross section was increased by a factor of 25 [24]. This is a very small effect compared with the range of values seen in the present study and in the absence of any evidence to the contrary, we assume the effect will not be of importance for exhalation under identical conditions by subjects with diabetes.
Although in this study we did not measure ambient air samples for possible contamination by acetone, we have noted that 'high' acetone values (and high values of βHB) are preceded/followed by normal values taken during the same clinic (separated by less than one hour), a result which would not be expected if contamination was a serious issue.
We finally comment on the fact that participants were breath tested both in morning and afternoon clinics. In a study on paediatric individuals with type 1 diabetes but who were otherwise healthy, Trefz et al measured a decrease in breath acetone by 58 ppb h−1 over the course of a nine hour day [25]. In our study a similar decrease (66 ppb h−1 over 10 h spanning morning and afternoon clinics) was measured for data taken at 'normal' acetone levels (below 2.5 ppm). Such changes were accompanied by a decrease in βHB as expected from the correlation observed at higher values. However, the changes in both acetone and βHB over the day were very small in comparison with the absolute values of both components observed in the elevated cases (above 2.5 ppm), and we conclude that there is insignificant variability introduced as a result of sampling at different times during the day.
3.2. Breath acetone falls more gradually than βHB during resolution of ketosis in DKA
Figure 2 shows the time resolved behaviour for one of the adults admitted with DKA. Breath acetone (red triangles) appears to remain approximately constant over the observation period (4–10 h after admission) whereas βHB drops by a factor of two in approximately 4 h after admission. In a second DKA case, very high values of breath acetone and βHB were found initially (400 ppm and 6.5 mmol l−1 respectively). Breath acetone increased by 25% between 2 and 8 h after admission, whereas βHB dropped by a factor of 2.6 over the same period.
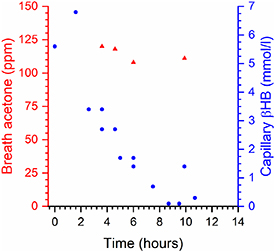
Figure 2. Time history of capillary βHB (blue circles, right hand scale) and breath acetone (red triangles, left hand scale) in a single individual admitted to hospital with DKA. The zero on the time scale is the admission time, with the first breath measurement taken 3 h 40 min after admission.
Download figure:
Standard image High-resolution image3.3. Breath acetone and plasma βHB are correlated within the normal range
Figure 3 shows the breath acetone concentrations as a function of venous (plasma) βHB measurements for both type 1 diabetes participants (black circles) and the healthy controls (green triangles), together with the best fit line from the capillary measurements of figure 1. In the group consenting to venous sampling, only three type 1 diabetes participants (out of 47) had βHB levels above 1 mmol l−1, and the controls (n = 10) all showed venous βHB and breath acetone values in the low ranges expected for healthy individuals (0.05–0.4 mmol l−1 and 0.35–2.9 ppm). There is an indication that the relationship between the logarithms of the two quantities may become non-linear (i.e. deviating from the straight line in figure 3) at low values.
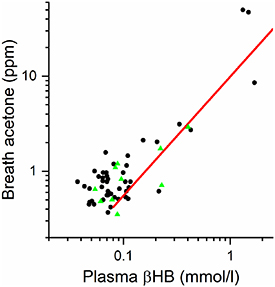
Figure 3. Breath acetone measurements versus venous (plasma) βHB measurements for 47 individuals with type 1 diabetes (black circles) and 10 healthy controls (green triangles). The red straight line is the correlation determined in figure 1 where capillary (fingerprick) βHB was measured.
Download figure:
Standard image High-resolution imageComparing βHB values measured in 47 people with diabetes plus 10 controls by both capillary and venous blood analyses showed a linear correlation over the range measured (0.04–1.68 mmol l−1 for venous samples). However, the limits of detectivity and the precision of the capillary measurements (0.1 mmol l−1, with a precision ±0.1 mmol l−1) affected the correlation: the lower capillary limit of 0.1 mmol l−1 was observed 31 times, for which the average venous concentration was 0.07 mmol l−1. For three cases observed above 1 mmol l−1 (where the precision of the capillary measurement, ±0.1 mmol l−1 was better than 10% of the absolute value), the capillary measurements were on average some 17% lower than the venous measurements. The reasons for this discrepancy in the absolute values are not known, but as will be seen later this does not affect the main conclusions of this study.
3.4. Using the breath acetone data to assess risk of DKA
We have divided our results into three levels of risk based on capillary ketone testing, namely capillary βHB < 0.6 mmol l−1 ('normal'), 0.6 ≤ capillary βHB < 1.65 mmol l−1 ('elevated') and ≥1.65 mmol l−1 ('high risk') giving rise to a traffic light system (green, amber and red respectively) with levels set to be a close as possible to the guidelines [10] taking into account the finite number of data points available (67 green, 7 amber, 7 red). The relationship between these categories and the breath acetone measurements was then explored by fitting these data to a cumulative link model which is a generalisation of logical regression for response variables with three or more categories [22] and the results are shown in figure 4. From the model, we can estimate the probability that an individual will be in a particular category, given their level of breath acetone. The model was cross-validated by fitting to N-1 of the N individuals, then using the model to find the most probable category of the remaining individual. This was repeated N times, leaving out each individual in turn, and 91% of the left-out data points were categorised correctly.
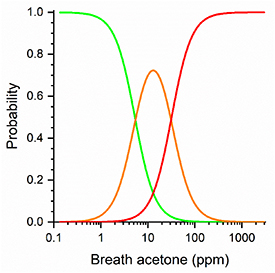
Figure 4. Results of the cumulative link model showing the probabilities of finding capillary levels of βHB corresponding to 'normal' (the sigmoidal curve on the left shown in green), 'elevated' (the Gaussian shaped curve in the middle shown in amber) and 'high risk/dangerous' (the sigmoidal shaped curve on the right shown in red) as a function of breath acetone.
Download figure:
Standard image High-resolution image
Even with this small data set we can get an indication of the potential predictive nature of the results using figure 4. For example, a breath acetone value of 5.4 ppm would mean that green and amber states are equally likely, with the probability of the red state of only 0.03. A value of 31 ppm (corresponding to βHB ≈ 2.5 mmol l−1) would estimate amber and red to be equally likely with green having a probability of 0.03. We note that the amber classification maximises at ca. 13 ppm acetone, corresponding to a βHB concentration of 1.25 mmol l−1, that the βHB 'danger level' of 1.65 mmol l−1 corresponds to 20 ppm acetone and the level at which the current advice is to seek immediate hospital attention, 3 mmol l−1, corresponds to 40 ppm. We stress that these observations are on a very small cohort of individuals (14) with levels of βHB above the normal upper limit of 0.65 mmol l−1 and it is clear that more data in the amber and red areas are required to put the model on a more quantitative basis and to define the boundaries more precisely to see if they could become diagnostically useful. With this caveat in place however, we can suggest from the present observations with our present capillary ketone monitor that breath acetone concentrations between 20 and 40 ppm appear to be at the warning threshold for DKA associated with type 1 diabetes.
4. Discussion
This study confirms that breath acetone is correlated with blood βHB levels in patients with type 1 diabetes and we have demonstrated this at a wider range of βHB values than previously reported (up to a maximum βHB of 7.6 mmol l−1). We have used these data to suggest a prediction model that with more data could be developed into a clinical tool using breath acetone rather than capillary βHB as a marker of developing ketosis.
We first consider the potential error limits on our data. First, for βHB the precision of the capillary meter is 0.1 mmol l−1, and does not affect the conclusions concerning levels approaching ketosis. The accuracy appears to be different from that of a standard biochemical assay by an average of 17% with the biochemical assay giving the higher value. For the IMR-MS measurements of breath acetone, the repeatability of measurements on the same sample (less than 2% error) was far better than the repeatability of the values when more than one sample was taken from the same individual at essentially the same observation time (error of ca.10%) and is thus a measure of our sampling accuracy. If we apply these potential errors to our present tentative suggestion of a warning threshold of 20–40 ppm acetone, then (a) these limits should be extended to 18–44 ppm to allow for sampling errors, and (b) decreased to values between 16 and 33 ppm if the ketone meter underestimated the βHB values by 17%. Our warning threshold could therefore lie between 16 and 44 ppm, but we note that these limits are not substantially changed from the values of 20–40 ppm described earlier.
We now compare our results with other studies. Figure 1 shows the averaged values together with error limits for the DKA study by Owen et al [11]. Although the agreement of the averages with the present data is good, individual values cluster around the line of best fit, but do not show a monotonically increasing change of breath acetone with blood βHB. For instance, the three highest breath acetone values, all equal to 350 ppm to within 1% show βHB ranging from 7.25 to 18.10 mmol l−1 [11]. Figure 1 also shows a point taken from the data presented by Sulway and Malins [6], again in good agreement with the present observations. As a check on the capillary data, we have also shown that breath acetone is correlated with both plasma measurements of βHB, albeit at lower levels of these two components.
We have observed that during the recovery phase of DKA, breath acetone falls much more slowly than βHB. A limitation of the study is that data are still lacking on the relationship between breath and capillary ketones at the peak values seen on admission in DKA and during the time course for recovery. However, our data in two adults suggests that the breath acetone decline during recovery from DKA lags behind the normalisation of βHB. This confirms observations from almost 50 years ago, when Sulway and Malins investigated the time dependences of all three blood ketones (βHB, AcAc and acetone) together with breath acetone in individuals with DKA as a function of time after treatment [6]. It was found that the rate of decrease of both plasma and breath acetone was far lower than those of βHB and AcAc. Quantitative data on one individual showed that βHB and AcAc had half-lives of 5 and 7 h respectively, whilst plasma acetone (which was found to be proportional to breath acetone) had a half-life of 15 h and acetone could still be detected on the breath when the recovery had taken place after a treatment period of 23 h. A similar result was presented by Owen et al [11], showing that reduction of βHB by over a factor of 2 occurred some 10 h after treatment, whereas plasma acetone (which was shown to be proportional to breath acetone) was essentially unchanged. These results agree with our limited studies of the time dependencies, and we conclude that a measurement of breath acetone in adults with DKA after a period of up to four hours from treatment commencement are representative of the breath acetone on admission. We have further data on nine cases of DKA (not included here) when breath sampling was not possible until between 5 and 22 h after admission. In all cases, the capillary ketones measured at the same times as the breath acetone were considerably below the admission values. If the data for these measurements were plotted on figure 1 they would all lie above the line of best fit: for example in the most extreme case a βHB value of 5.9 mmol l−1 was measured at admission, had decreased to 0.3 mmol l−1 after 22 h but the acetone level was still far above normal at 90 ppm. Although in the present studies we did not measure blood AcAc, we note that there are reports on treatment of DKA with insulin where the concentration of AcAc often increased initially over a period of 3–4 h at the same time as the βHB concentrations were falling [11, 26]. Our observation in a single case of an increase in breath acetone would be consistent with an increase in AcAc. Our findings are consistent with previous conclusions [6, 11] that the elimination of acetone in breath is the slowest (rate determining) step involving the kinetics of formation and loss of acetone formed from excess ionised ketone bodies in the blood.
We finally note the correlation between βHB and breath acetone derived by Anderson [18] for dieting studies together with the five averaged points for type 2 diabetes from Qiao et al [2]. The functional form fitted to the data is in good agreement with the relationship shown in figure 1 for the regions of overlap (βHB up to a maximum value of 3.5 mmol l−1). Care therefore needs to be taken to distinguish the increases in both breath acetone and βHB resulting from dieting induced ketosis from increases caused by poor diabetic control.
Currently home testing of ketones is recommended for people with type 1 or ketosis-prone diabetes when they become unwell and may also be occasionally indicated for individuals with type 2 diabetes using Sodium/glucose cotransporter 2 inhibitor agents who have a small risk of euglycaemic ketoacidosis. Both the current common methods have limitations: capillary blood testing for βHB is invasive and expensive and the ketone testing strips have a short shelf-life, whilst urine testing for AcAc does not accurately reflect current blood ketones and as testing relies on being able to void urine cannot be used to reliably track ketone levels. A non-invasive breath test would therefore have a number of advantages over current methods. A very large number of breath acetone measurement techniques have been proposed in the literature, and have been recently reviewed [27, 28]. Most, by necessity, have demonstrated the appropriate sensitivity, but the requirements of selectivity, calibration, portability, cost and ease of operation are such that a single method does not yet seem to satisfy all of these criteria. For type 1 diabetes, the gradual move away from fingerpricking methods to implanted sensors for the determination of blood glucose may accelerate the move away from fingerpricking for ketone determination to the development of an acetone breath analyser with the required characteristics. Again, we stress that more measurements on individuals with type 1 diabetes are needed to see if a correlation is more statistically robust than the present observations. In particular, any relationships with other variables such as gender, age and BMI needs to be explored, relationships which have not been possible in the present study because of the limited number of cases observed at elevated βHB levels.
5. Conclusions
Measurements of capillary βHB and breath acetone are shown to be correlated in a group of 81 individuals with type 1 diabetes attending a clinic or admitted to hospital with DKA. βHB ranged from 0.1 to 7.6 mmol l−1, and breath acetone from 0.25 to 474 ppm. From these observations we conclude that breath acetone should be explored as a potential marker of accumulation of ketone bodies during intercurrent illness in type 1 diabetes and as a warning threshold for DKA. It cannot be used in the hospital admission setting to monitor recovery as ketosis resolves.
Acknowledgments
The research was supported by the National Institute for Health Research (NIHR) Oxford Biomedical Research Centre (BRC). The views expressed are those of the author(s) and not necessarily those of the NHS, the NIHR or the Department of Health. Funding for the project was provided by Oxford Medical Diagnostics through the award of a Small Business Research Initiative award 3923: 'Breath ketone analysis for improved diabetes management.' We would like to thank Dr Tim James in the John Radcliffe Hospital biochemistry lab for the analyses of the plasma βHB levels. One of the authors (DL) sadly died during the preparation of this manuscript.
Trial registration
NRES Committee South Central—Berkshire ref. 15/SC0285 (adult volunteers) West of Scotland Research Ethics Committee 3 ref. 12/WS/0164 (paediatric volunteers).
Conflict of interest
During the data gathering phase of this project, RP and GR were employed by Oxford Medical Diagnostics, GADR and GH were Consultants to the Company, and GH was a Director. The company ceased trading in March 2018.