
Abstract
Exhaled breath condensate (EBC) collection provides a promising matrix for bioanalysis of endogenous biomarkers of health and also for exogenous compounds like drugs. There is little information regarding drugs and their metabolites contained in breath, as well as their pharmacokinetics. In this present work, we use a simple and non-invasive technique to collect EBC from chronic pain patients using different analgesic opioid drugs to manage pain. Six patients received continuous infusion of morphine and hydromorphone intravenously (IV), together with other analgesic drugs (IV and orally). Repeated sampling of serum and EBC was done at two time points separated by 90 min. The EBC was collected using a glass tube surrounded by dry ice, and an ethanol solvent wash of the glass was performed after EBC extraction to retrieve the apolar compounds stuck to the glass surface. All samples were analyzed with liquid chromatography coupled to mass spectrometry (LC-MS/MS) to identify possible metabolites present in the sample, and to quantify the drugs being used. Several metabolites, such as normorphine (norM), norhydromorphone (norHM) and dihydromorphone (diHM) were detected in both fractions, while hydromorphone 3-glucuronide (HM 3G) was only detected in the solvent rinse fraction. Results were correlated to explain the pharmacokinetics of the main drugs administered. This pilot study presented promising correlations between drug concentrations in blood and breath at different time points for norM, norHM and HM 3G.
Export citation and abstract BibTeX RIS

Original content from this work may be used under the terms of the Creative Commons Attribution 3.0 licence. Any further distribution of this work must maintain attribution to the author(s) and the title of the work, journal citation and DOI.
1. Introduction
Chronic pain is widespread in the general population, often in those with underlying specific medical conditions. Patients suffering chronic pain of moderate to severe intensity are commonly prescribed opioids and other analgesic drugs to manage pain. The initial choice is usually non-prescription analgesics which include non-steroidal anti-inflammatory drugs (NSAIDs), such as ibuprofen and naproxen, and acetaminophen. However, over-the-counter drugs are frequently not enough for moderate to severe pain relief, and opioids can be more effective when administered correctly with monitoring programs. Opioids analgesics are relatively low cost and have high patient acceptance. Several opioids are isolated from the poppy plant, such as morphine and codeine, or semi-synthetically produced from it, such as hydromorphone, oxycodone, hydrocodone, buprenorphine, and oxymorphone. Other opiates including fentanyl, meperidine, methadone and tramadol are synthetic [1].
Despite therapeutic indications, the intentional or unintentional overuse and abuse of these drugs is a serious health crisis around the world [1, 2]. The identification of opioids and their metabolites in patients is very important to make suitable medical decisions and to prevent confounding treatment effects such as drug–drug interactions or cardiovascular problems, and to monitor appropriate use. The assessment of the presence and amount of a drug by chemical testing of blood and urine samples has been widely used as a diagnostic tool in clinical, sports, and forensic situations [3, 4]. However, obtaining blood and urine may be difficult in non-clinical and non-voluntary settings.
Although it is important to be able to detect specific opiates and other common drugs, it is also critical to understand opioid metabolism when considering drug detection methods. For example, some commercial opioids are easily metabolized to other commercial opioids or may be present as impurities [1]. This metabolism allows the biotransformation of the drugs, mainly in the liver, to intermediates that can be removed by the body. The way the body alters the drugs into other compounds is called pharmacokinetics, and it involves absorption, distribution, metabolism and elimination processes. The multiple metabolites formed can also be active (even more potent) or inactive. Table 1 summarizes the main metabolites detected for opioid analgesic drugs [1, 5–11].
Table 1. Main metabolites from opioids [1, 5–11].
| Opioid | Inactive metabolites | Active metabolitesa |
|---|---|---|
| Morphine | Normorphine | Hydromorphonea,b |
| Normorphine 6-glucuronide | Morphine-3-glucuronide | |
| Morphine 3,6-diglucuronide | Morphine-6-glucuronide | |
| Morphine ethereal sulfate | ||
| Hydromorphone | Hydromorphone-3-glucoside | Hydromorphone-3-glucuronide |
| Dihydroisomorphine-6-glucuronide | ||
| Dihydromorphine-3-glucuronide | ||
| Dihydromorphine/Dihydroisomorphine | ||
| Norhydromorphone | ||
| Hydromorphone-3-sulfate | ||
| Oxycodone | — | Oxymorphonea |
| Noroxycodone | ||
| Oxymorphone | Oxymorphone-3-glucuronide | 6-hydroxy-oxymorphone |
| Codeine | Norcodeine | Hydrocodonea |
| Codeine-6-glucuronide | Morphinea | |
| Hydrocodone | Norhydrocodone | Hydromorphonea,b |
| Tramadol | Nortramadol | O-desmethyltramadol |
| Fentanyl | Norfentanyl | — |
| Methadone | 2-ethylidene-1,5-dimethyl-3,3-diphenylpyrrolidine (EDDP) | — |
| Heroin | Normorphine | Morphinea |
| 6-monoacetylmorphine |
aIdentical to commercial opioids. bOnly low levels are observed.
Morphine and hydromorphone are frequently prescribed opioids for pain management [9], as are with oxycodone and methadone. Morphine has a broad variability in both analgesics and adverse effects. It is mainly metabolized in vivo to morphine-3-glucuronide and morphine-6-glucuronide, and through minor routes to normorphine or normorphine-6-glucoside, morphine-3,6-diglucuronide, morphine ethereal sulfate and hydromorphone [5–7, 10]. Hydromorphone is more potent than morphine and is mostly transformed to hydromorphone-3-glucuronide and dihydroisomorphone among other minor metabolites [6, 8–10, 12]. Because of these transformations, there is tremendous interest for minimally invasive screening methodologies that allow the detection of the different drugs and their corresponding metabolites.
Current methods of drug screening involve biological samples, such as urine and blood, and drugs are detected through immunoassays and confirmatory gold-standard methods. Confirmatory methods usually involve separation techniques coupled to mass spectrometry (MS). Although these methodologies offer reliable drug testing results, both specimens have sampling limitations. Urine is typically used for longer exposures, has a risk of adulteration, and there are privacy concerns. Blood collection using plasma or serum can reflect short term consumption, but it is invasive and requires specialized personnel to collect. Other specimens, such as oral fluid, sweat, hair, and exhaled breath have been proposed to document drug exposure [1–4]. The latter has gained interest recently in clinical environments to detect drugs, and some proof-of-concept has been demonstrated [3, 4, 13–19].
Exhaled breath collection represents a painless, easily available, and non-invasive technique that would enable clinicians to make quick and well-informed decisions [20]. Breath compounds are found in either the exhaled breath gas or the exhaled breath condensate (EBC) phase. This latter EBC phase contains non-volatile substances, mainly lipids and proteins, that come from the respiratory tract lining fluid and surfactant. EBC provides a promising biomatrix for analysis of endogenous biomarkers and also for exogenous compounds like drugs, which can enter to the body through different routes [18, 21]. Drugs are mainly large and low-volatile molecules that can be potentially detected in exhaled breath aerosol (EBA), e.g. exhaled microcroplets, using filters [3, 4, 18, 19, 22, 23], and in EBC using a cooling system [24]. EBC likely contains some fraction of the EBA, but may not contain all of the EBA because some aerosol may be lost in the EBC collection process. EBA collection also likely depends on how EBC is sampled, and the EBC also contains some VOCs with low vapor pressure and boiling point that condense at the EBC sampling temperature. Both EBC and EBA breath fractions are easy to obtain, safe, and well-accepted by patients. Although EBA collection offers a fast and simple way to collect sample, it can show discrepancies when compared to blood and urine results, possibly by contamination with saliva [3, 14]. EBC is usually collected by 10–15 min of tidal breathing through a cooled tube that condense the aqueous fraction of the exhaled breath that contain drugs [23–25]. There are studies that use custom, lab-made devices with a glass tube cooled with dry ice at −80 °C and a trap that removes salivary contamination [22, 26, 27].
Even though the detection and quantification of drugs in breath has increasing interest, there are relatively few reports of how breath detection corresponds to gold-standard blood measurements [28]. There are few studies to describe plasma pharmacokinetics of drugs using breath particles detected in EB [17], instead of the whole EBC fraction. Such data can be very important to further characterization of EBC as a tool for drug analysis, as well an understanding how drugs partition into the breath over time. The aim of our present study is to use pain management drugs, such as morphine and hydromorphone, as model drugs to determine breath composition, metabolite detection and correlation with blood concentrations after controlled administration, together with other administered medications. For this, EBC and a solvent wash of the EBC collection device were collected and analyzed using liquid chromatography (LC) coupled to MS and compared to gold-standard serum blood tests at various time points.
2. Materials and methods
2.1. Chemicals and standards
All opioid reference substances were purchased as ampoulled solutions in methanol from Cerilliant Co (via Sigma-Aldrich, Round Rock, TX, US). The stock and working solutions were prepared in methanol and stored at −20 °C. The list of substances and mass spectrometric parameters are summarized (table 2). Retention time (RT, min), molecular formula and theoretical exact mass are presented together with experimental values of the main precursor ion detected with MS ([M + H]+), calculated experimental mass error (in ppm), confirmation fragment MS/MS ion and limit of detection (LOD in ng ml−1 in EBC) using spiked and clean EBC samples. All other chemicals including LC-MS grade acetonitrile and water (Fisher Scientific AB, Gothenburg, Sweden) and formic acid (VWR international) were of highest analytical grade.
Table 2. List of studied drugs with the molecular formula, exact mass and mass spectrometric information.
| Peak | Compound | RT (min) | Formula | Exact mass | Precursor [M + H]+ | Mass error (ppm) | MS/MS confirmation | LOD (ng ml−1) |
|---|---|---|---|---|---|---|---|---|
| 1 | Morphine | 1.7 | C17 H19 N O3 | 285.1364 | 286.1456 | −1.7 | 286 > 165 | 0.1 |
| 2 | Oxymorphone | 2.2 | C17 H19 N O4 | 301.1314 | 302.1392 | 0.7 | 302 > 227 | 0.75 |
| 3 | Hydromorphone | 3 | C17 H19 N O3 | 285.1365 | 286.1443 | 1.4 | 286 > 185 | 1 |
| 4 | Codeine | 5.45 | C18 H21 N O3 | 299.1521 | 300.1615 | −2.3 | 300 > 165 | 0.1 |
| 5 | Naloxone | 5.65 | C19 H21 N O4 | 327.147 | 328.1548 | 1.2 | 328 > 212 | 0.25 |
| 6 | Oxycodone | 6.2 | C18 H21 N O4 | 315.147 | 316.1563 | −3.5 | 316 > 241 | 0.25 |
| 7 | Naltrexone | 6.6 | C20 H23 N O4 | 341.1627 | 342.1705 | 1.8 | 342 > 324 | 0.5 |
| 8 | Hydrocodone | 6.7 | C18 H21 N O3 | 299.1521 | 300.1599 | 2.0 | 300 > 199 | 0.5 |
| 9 | Tramadol HCl | 7.95 | C16 H25 N O2 | 263.1885 | 264.1957 | 7.6 | 264 > 246 | 0.5 |
| 10 | Meperidine | 8.3 | C15 H21 N O2 | 247.1572 | 248.165 | 18.5 | 248 > 174 | 0.05 |
| 11 | Fentanyl | 8.97 | C22 H28 N2 O | 336.2201 | 337.2283 | 1.8 | 337 > 105 | 0.05 |
| 12 | Buprenorphine | 9.25 | C29 H41 N O4 | 467.3035 | 468.3113 | 7.0 | 468 > 396 | 2.5 |
| 13 | EDDP | 9.5 | C20 H23 N | 277.183 | 278.1903 | 20.1 | 278 > 234 | 0.01 |
| 14 | Methadone | 9.9 | C21 H27 N O | 309.2092 | 310.2172 | 7.7 | 310 > 105 | 0.5 |
All opioid stock solutions (100 mg ml−1) were diluted with methanol to obtain a mix solution of 250 ng ml−1 per compound. Pure standards from the mixed solutions were used to optimize the instrumental method and protocols. These same standards were used to spike breath condensate by adding different concentration to 1 ml of pooled clean EBC (non-medicated subjects). Spiked EBC contained 0.05–200 ng ml−1 of opioids and were used to determine calibration curves, the limits of detection (LOD) and matrix effects of the method. After standards addition, spiked EBC were treated as real samples by lyophilization, reconstitution in 50 μl and analysis as described below (section 2.4).
2.2. Clinical study
Subjects were recruited from the infusion center at the UC Davis Comprehensive Cancer Center (Sacramento, CA, USA). This research adhered to good clinical practices and protocols as approved by the University of California, Davis Institutional Review Board (IRB Protocol #425708). All the participants signed an informed consent after providing a written and oral information. Thereafter, subjects were interviewed to obtain individualized case report informs.
A total of 12 subjects participated in the study. Nine were patients under pain management treatment and three were healthy-control subjects, all aged between 25 and 38 years. Three of the patients received a morphine solution (M, 5 mg ml−1 in 50 ml), and six received a hydromorphone solution (HM, Dilaudid, 1 mg ml−1 in 50 ml). All the opioids were infused intravenously, except one subject who had an additional oral HM administration. Two participants were excluded from analysis once the EBC samples were collected due to the low amount of sample collected. The prescribed drugs were intermittently (every 20–30 min IV boluses) infused during 6–7 h in the center (table 3). Samples were performed at two time points: first at time 0, when patients were finishing infusions of medications; and the second was taken 60–90 min after the first collection and after the patients had stopped their infusions. The amounts were considered as the average of drug present in the patient system. No pain medications or prescribed opioids were used by any of the healthy participants for 24 h before sample collection.
Table 3. Information about medication form subjects under pain management: gender, age, main opioids and use of other prescribed drugs. Administration mode is shown, and amounts taken are listed in parenthesis (in mg).
| Patient | 1 | 2 | 3 | 4 | 5 | 6 | 7 | |
|---|---|---|---|---|---|---|---|---|
| Gender | M | F | F | M | F | M | M | |
| Age | 25 | 36 | 36 | 29 | 31 | 34 | 38 | |
| Opioids | Morphine | IV (250) | IV (250) | O* | — | — | — | — |
| Hydromorphone | — | — | IV (50) | IV (50) | IV + O (50) | IV (50) | IV (50) | |
| Oxycodone | — | O (80) | O* | O (160) | O (160) | O (60) | O* | |
| Methadone | — | — | — | — | — | — | O* | |
| Other drugs | Ketorolac | IV (30) | — | — | IV (30) | — | IV (30) | — |
| Naloxone | — | * | * | * | * | * | * | |
| Ibuprofen | O* | O* | O* | O* | O* | O* | O* | |
| Albuterol | NEB (2.5) | — | NEB (2.5) | NEB (2.5) | NEB (2.5) | — | — | |
| Diphenhydramine | O (25–50) | O (25–50) | — | O (25–50) | O (25–50) | O (25–50) | O (25–50) | |
Note. —: Not Administered; *Unknown amount or last intake M: Male; F: Female, O: oral; IV: Intravenous (Patient Control Anesthesia); NEB: Nebulization.
Other opioids administrated were: oxycodone in six of the patients, and methadone in 1 patient. Both drugs were taken orally the same day but prior to the drug infusion treatment. Other medications such as albuterol, an asthma and COPD treatment nebulizer, were used by five patients; the oral antihistaminic diphenhydramine was used by seven patients; and ketorolac was also infused in four patients. Additional analgesics like ibuprofen and naloxone were prescribed for most of the patients, but no information about recent administration was available.
2.3. Sample collection
2.3.1. Blood/serum collection
Blood was collected after venous puncture into EDTA vacutainer tubes. Samples were stored at −20 °C and sent to a clinical lab for analysis (ARUP Laboratories). The LC-MS/MS method was applied with a positive cutoff of 2 ng ml−1 for all drugs. Only the main infused drug was determined by target analysis in each blood/serum sample.
2.3.2. EBC collection
Breath collection was achieved using a novel, in-house device that was previously demonstrated [26, 27]. This device consists of a glass tube surrounded by dry ice that sets the sample condensation at −80 °C. During the breathing maneuver, the exhaled breath passes through a mouthpiece and goes through a trap that separates saliva and larger particles. Participants were asked to perform normal tidal breathing (no nose clip). Sample collection was done for 15 min; and two separate collections separated by 60–90 min were performed for each participant. After each EBC collection, blood samples were immediately taken.
Before every EBC collection participants rinsed their mouth with water. Moreover, while the EBC sampler normally collects between 1 and 3 ml from healthy volunteers, several patients were not able to provide more than 0.5 ml. Two subjects of the 12 provided less than 100 μl of condensate, which was not sufficient to produce a suitable analytical response using LC-MS. These subjects were removed from the study, and all volume differences were corrected after analysis (see section 2.6).
2.3.3. Solvent rinse extraction from sampler
A solvent rinse fraction of the glass tube was collected after the aqueous EBC condensate was removed. This fraction allowed complementary EBC information containing more apolar compounds, with organic solvent containing compounds with lower polarity. This step was also applied to get more information due to the low amount of sample provided for some of the participants. For the collection, 2–3 ml of ethanol was pipetted through the closed glass tubed after the EBC collection and mixed for 1 min. EBC and solvent rinse fractions were kept frozen with dry ice during transportation and stored at −80 °C until analysis.
2.4. Sample preparation
A total of 1 ml or the maximum available amount of the frozen EBC was lyophilized. Solvent rinse fractions were dried with nitrogen until completely dry. Both dried extracts were reconstituted with 50 μl of mobile phase (95% water in acetonitrile), vortexed, sonicated for 10 min at 4 °C and centrifuged at 13 000 rpm for 10 min at 4 °C. Supernatant was stored at −80 °C until LC-MS analysis.
2.5. Instrumentation
Samples were analyzed using an Agilent 1290 series HPLC system coupled with an Agilent 6530 quadrupole-time of flight (qTOF) mass spectrometer (Agilent Technologies, Santa Clara, CA, USA). Analytes were separated with an InfinityLab Poroshell 120 EC-C18 column (3.0 mm × 50 mm, 2.7 μm) (Agilent Technologies, Palo Alto, CA, US) held at 35 °C. An autosampler at 5 °C maintained the samples stable until 20 μl of sample were injected onto the column. The mobile phase flow rate was 600 μl min−1 operating in a gradient mode. Mobile phase A consisting of water and mobile phase B consisting of acetonitrile, both with 0.1% formic acid. The gradient profile was as follows: starting with 3% B (hold time 3 min) and continued with linear change to 10% B up in 3 min and to 50% B up in 4 min. Continued up to 100% B in 3 min and held it during 6 min. Sample analysis lasted 19 min and equilibration was performed 3 min to stabilize the system. An electrospray ionization source, with an Agilent Jet Stream nebulizer was used. It was operated at 300 °C with ionization set at 2500 V and fragmentor voltage at 175 V in positive mode. Nitrogen gas was used for nebulization and desolvation. Nebulizer gas pressure, temperature and drying gas flow rate were set at 45 psi, 400 °C and 10 l min−1. Mass measurements were recalibrated using the reference masses m/z 121.0508 (purine) in positive ion mode. Identification of the targeted drugs was performed using Auto MS/MS of preferred precursor ion list (table 2) at collision energies of 0, 20 and 40 V. Mass spectra was acquired at a scan rate of 3 spectra/s between 125 and 800 m/z for MS resolution and at 5 spectra/s between 50 and 700 m/z for MS/MS resolution. Figure 1 shows the chromatograms obtained by the standards mixtures once spiked in an EBC matrix.
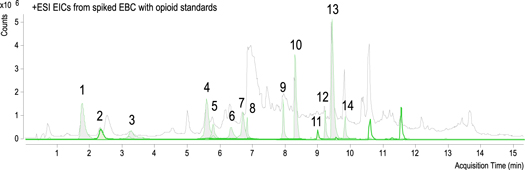
Figure 1. Total Ion Chromatogram (TIC, gray) from spiked EBC with opioid standards mix. Extracted Ion Chromatograms (EIC, green) are presented at the corresponding [M + H]+ specific masses from each compound. Scale corresponding to the EICs (see table 2).
Download figure:
Standard image High-resolution image2.6. Data analysis
Data were processed with Agilent's Mass Hunter Qualitative Analysis B.06.00 and Quantitative (qTOF) Analysis B.07.00 software. Ten-point calibration curves were used for each compound with linear calibration. Optimal calibration curves were considered with correlation coefficients (R2) higher than 0.985. LOD were determined together with matrix effect per each compound (table 2). LOD were determined based on ng ml−1 of EBC and no matrix effects were observed for any of the substances. Compounds were identified in samples by comparing standard RT, exact mass and confirmation MS/MS ions. Potential metabolites were identified using the exact mass and METLIN database search. All compounds and metabolite concentrations were calculated based on the calibration curve from the parent detected compound. Mass error was also calculated based on the theoretical exact mass of the compound in ppm. Correlation between detected opioids in breath and blood concentrations were performed.
Control samples were studied using the same instrumental methodology to determine the absence of opioid and other pain medications in EBC samples. For this, EBC was collected from three healthy subjects (not medicated). Clean profiles were obtained in the region of the studied substances, where the masses of the targeted compounds were not detected at their correspondent RTs.
3. Results and discussion
Obtained data were compared to control samples from subjects, which had no opioid or medication administrated, and the selected masses from opioids and their metabolites were extracted. Quantifications were applied when a signal was detected and based on the parent opioid. For example if morphine-6-glucuronide (the main metabolite from morphine) was detected, it was quantified using the morphine calibration curve. Some of the opioids produce multiple metabolites after administration and identification is not an easy task since genetic factors, medical comorbidities and drug–drug interactions can alter their metabolism. RTs from known standards, exact masses and MS/MS signal was used to confirm a presence of a compound. The main medications of the patients in this study were morphine, hydromorphone, and their major metabolites are listed in table 1. Once the compounds were quantified, the amount was corrected by the volume of sample collected during the experiment and the final concentration was calculated based on the total of sample used for the analysis, expressed in ng ml−1 of sample (table 4).
Table 4. Concentrations in ng ml−1 of drugs detected in patients infused with opioids. Metabolites were quantified based on main drug calibration curve (bold).
| EBC fraction | Ethanol rinse | ||||||||||||||||||||||||||||
|---|---|---|---|---|---|---|---|---|---|---|---|---|---|---|---|---|---|---|---|---|---|---|---|---|---|---|---|---|---|
| P 1 | P2 | P 3 | P 4 | P 5 | P 6 | P 7 | P 1 | P 2 | P 4 | P 5 | P 6 | P 7 | |||||||||||||||||
| Compound | Mass | Formula | RT (min) | Error (ppm) | t1 | t1 | t2 | t1 | t2 | t1 | t2 | t1 | t2 | t1 | t2 | t1 | t2 | t1 | t2 | t1 | t2 | t1 | t2 | t1 | t2 | t1 | t2 | t1 | t2 |
| Morphine (M) | 285.1365 | C17 H19 N O3 | 1.68 | — | — | — | — | x | x | x | x | x | x | x | x | x | x | — | — | — | — | x | x | x | x | x | x | x | x |
| M 6-glucuronide | 461.1685 | C23 H27 N O9 | 2.0* | 9.8 | — | — | — | <lod | <lod | — | — | ||||||||||||||||||
| M 3-glucuronide | 461.1685 | C23 H27 N O9 | 7.25* | 45.4 | — | — | — | <lod | <lod | — | — | ||||||||||||||||||
| NorM | 271.1208 | C16 H17 N O3 | 7.9* | 48.6 | 0.10 | 0.28 | 0.07 | 0.07 | — | 0.11 | 0.17 | ||||||||||||||||||
| HM (#) | 285.1365 | C17 H19 N O3 | 3.16 | −4.5 | — | — | 0.22 | — | — | — | — | ||||||||||||||||||
| Hydromorphone (HM) | 285.1365 | C17 H19 N O3 | 3.16 | x | x | x | — | — | — | — | — | — | — | — | — | — | x | x | x | x | — | — | — | — | — | — | — | — | |
| HM 3-glucuronide | 461.1685 | C23 H27 N O9 | 7.3* | 45.7 | — | — | — | — | — | — | — | — | — | — | 0.09 | 0.09 | 0.09 | 0.09 | 0.10 | — | 0.09 | — | |||||||
| DiHM/DihydroisoM | 287.1521 | C17 H21 NO3 | 0.8* | 52.4 | 0.44 | 0.26 | — | 3.24 | — | 0.67 | 2.70 | 3.32 | 3.40 | — | — | 0.11 | 0.29 | 0.17 | 0.14 | 0.13 | 0.11 | — | |||||||
| NorHM | 271.1208 | C16 H17 N O3 | 8* | 59.9 | 0.59 | 0.97 | 1.22 | 3.21 | — | 0.45 | 4.00 | 5.48 | — | — | 0.32 | 0.09 | — | — | — | — | — | 0.11 | |||||||
| Oxycodone | 315.147 | C18 H21 N O4 | 6.2 | −10.4 | x | — | — | — | — | — | — | — | — | — | — | — | — | x | x | — | — | — | — | 0.07 | — | — | — | — | — |
| Noroxycodone | 301.1314 | C17 H19 N O4 | 4.5* | −30.1 | — | — | — | — | — | — | — | 0.33 | — | — | — | — | — | — | 0.04 | — | 0.02 | 0.02 | 0.08 | 0.02 | 0.02 | 0.03 | |||
| Methadone | 309.2092 | C21 H27 N O | 9.9 | 59.3 | x | x | x | — | — | — | — | — | — | — | — | — | — | x | x | x | x | x | x | x | x | 0.24 | 0.19 | x | x |
| Amount of sample (ml) | 0.8 | 0.4 | 0.4 | 0.6 | 1 | 0.5 | 0.1 | 0.1 | 0.7 | 0.1 | 0.1 | 0.1 | 0.2 | 3 | 3 | 2 | 3 | 3 | 3 | 3 | 3 | 3 | 3 | 3 | 3 | ||||
Note. P: Patient number; * tentative retention time.x: drug not administrated for that subject; —.: not detected.
Non-volatiles are usually found in low concertation in EBC. Especially when an insufficient amount of sample is collected (<0.1 ml), reliable results cannot be guaranteed; and therefore, those samples were discarded from our pilot study. This is the case for 2 patients and the second time point for another patient. Also, the solvent rinse fraction was not available for one of the patients. We observed that lower volumes of EBC were collected compared to our prior work (typically 1–3 ml for 10–20 min sampling). This diminished volume may be related to the use of concomitant medications and respiratory problems in several patients, which can cause decreased secretions. Studies have shown that intake/infusion of opioids like morphine and hydromorphone can induce unwanted side effects, such as respiratory depression [8–10]. Moreover, five of the patients in the study were prescribed and used albuterol, a nebulized medication that treats respiratory diseases such as asthma. Although longer collection times can help on sampling volume, these were not extended to avoid undue stress on the patients.
3.1. Morphine patients
Two of the patients were treated with morphine through IV infusion and one orally with morphine elixir. However, serum samples from the last subject were not analyzed for this drug. One of the subjects ingested oxycodone orally (no blood data from that drug). Figure 2 summarizes the opioids and metabolites detected in the studied EBC and solvent rinse fractions for IV morphine treated patients.
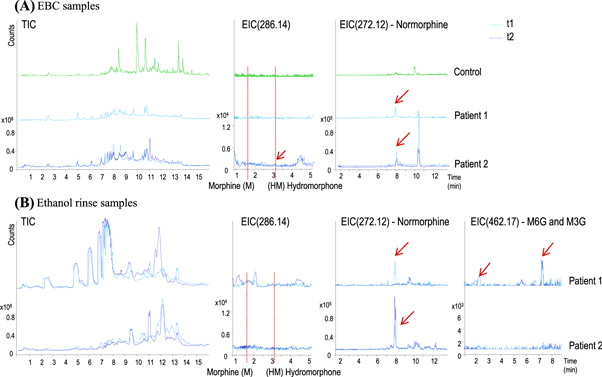
Figure 2. Chromatographic profiles of (A) EBC and (B) solvent rinse samples from patients infused with morphine. EBC is compared to control subjects (green lines, only for EBC). Total ion chromatograms (TIC, left) and extracted ion chromatograms (EIC) at 286, 272 and 462 m/z, corresponding to morphine/hydromorphine, normorphine and morphine 3-/6-glucuronide, respectively, are represented for each patient and each time-point (t1 in light-blue and t2 in dark-blue). Peaks corresponding to the extracted compounds are represented with red arrows. (M: Morphine, HM: Hydromorphone, M6G and M3G: morphine 6- and 3-glucuronide.)
Download figure:
Standard image High-resolution imageWe can observe that none of the parent original infused drug was detected in any samples, including controls and patients. In figure 2, we can see the RTs corresponding to the main drugs (EIC 286.14), morphine and hydromorphone. Some papers suggest that hydromorphone can be found as morphine metabolite [5–7, 10]. In this study, only small amounts of normorphine, a metabolite of morphine metabolized by N-demethylation can be detected in EBC (close to limit of detection of 0.07 ng ml−1). When solvent rinse fractions were analyzed, small amounts of normorphine were detected. In this case, small signals corresponding to morphine 3- and 6-glucoronide were detected for Subject 1, as well as small signal for hydromorphone for Subject 2 (time point 1). No other parent drugs nor their metabolites were detected in the samples.
3.2. Hydromorphone patients
Five patients intermittent bolus hydromorphone injections (Dilaudid). All patient blood samples were analyzed, as well as the EBC and solvent rinse fractions containing breath information. Figure 3 summarizes the compounds detected in the studied fractions.

Figure 3. Chromatographic profiles of (A) EBC and (B) solvent rinse samples from patients infused with hydromorphone. EBC is compared to controls (green). Total ion chromatograms (left) and extracted ion chromatograms at 286, 462, 288 and 272, corresponding to morphine/hydromorphine, normorphine and hydromorphone 3-glucuronide, dihydromorphine/dihydroisomorphine and norhydromorphone, respectively, are represented for each patient and each time-point (t1 in light-blue and t2 in dark-blue). Peaks corresponding to the extracted compounds are represented with red arrows.
Download figure:
Standard image High-resolution imageSimilar to morphine, the final concentration of hydromorphone was calculated based on the total of sample used for the analysis, expressed in ng ml−1 of sample. We can observe that no infused parent drug (hydromorphone) was detected in any of the samples, including controls and patients. However, some of the metabolites could be detected in small amounts (below the limit of quantification of the method (1 ng ml−1). This is the case of hydromorphone-3-glucuronide, slightly detected only in solvent rinse fractions, dihydromorphine or dihydroisomorphine, and norhydromorphone.
Five of all the patients participating in the study were also prescribed and ingested orally doses of oxycodone. From all, only a small amount of one metabolite, noroxycodone, could be detected in a single patient (Subject 4). However, when looking at the ethanol rinse fractions, this same metabolite can be detected in more patients but below the limit of quantification. In this case, noroxycodone was quantified using the oxycodone calibration curve. Moreover, the original oxycodone could be detected in one of the subjects solvent rinse fraction (Subject 4, time point 1) in small amounts. Also, one of the subjects (Subject 5) was prescribed methadone. This opioid and its main metabolite, EDDP, were determined and small amounts of methadone could be detected in both timepoints in the ethanol rinse fraction (table 4).
Finally, other drugs (non-opioids) were also investigated in these samples. Albuterol (or salbutamol) was used by five patients. Although there are studies where this compound (239 m/z) and its major metabolite, albuterol-4-o-sulfate (319 m/z) have been detected using LC-MS [29], we were not able to detect it (data not shown). Diphenhydramine and ketorolac, an allergy medication and NSAID, respectively, were not detected in any of the samples (data not shown). We are unsure if this is because of the dosing schedule, which may have been at time points too far preceding the EBC collection.
Serum pharmacokinetics with breath. Once we obtained the breath data, we compared the concentrations in breath with the concentrations in blood serum via LC/MS analysis (provided by an external lab in the medical school). Table 5 shows the final concentrations of the opioids and metabolites in breath and the concentration of opioids (morphine and hydromorphone) detected in blood.
Table 5. Concentrations in ng ml−1 of opioids and metabolites detected breath and blood.
| Concentration in breath (ng ml−1) | Conc. in blood (ng ml−1) | ||||||||
|---|---|---|---|---|---|---|---|---|---|
| Fraction | Subject | Time | NorM | HM | HM-3G | DiHM/DiHisoM | NorHM | M | HM |
| EBC | 1 | t1 | 0.10 | — | — | — | — | 47 | x |
| 2 | t1 | 0.28 | — | — | — | — | 110 | x | |
| t2 | 0.13 | 0.22 | — | — | — | 84 | x | ||
| 3 | t1 | — | — | — | 0.44 | 0.59 | x | 38 | |
| t2 | — | — | — | 0.26 | 0.97 | x | 38 | ||
| 4 | t1 | — | — | — | — | 1.22 | x | 131 | |
| t2 | — | — | — | 3.24 | 3.21 | x | 83 | ||
| 5 | t1 | — | — | — | — | — | x | 69 | |
| t2 | — | — | — | 0.67 | 0.45 | x | 45 | ||
| 6 | t1 | — | — | — | 2.70 | 4.00 | x | 190 | |
| t2 | — | — | — | 3.32 | 5.48 | x | 270 | ||
| 7 | t1 | — | — | — | 3.40 | — | x | 120 | |
| t2 | — | — | — | — | — | x | 228 | ||
| Ethanol solvent rinse | 1 | t1 | 0.07 | — | — | — | — | 47 | x |
| 2 | t1 | 0.11 | — | — | — | — | 110 | x | |
| t2 | 0.17 | — | — | — | — | 84 | x | ||
| 4 | t1 | — | — | 0.09 | — | 0.32 | x | 131 | |
| t2 | — | — | 0.09 | 0.11 | 0.09 | x | 83 | ||
| 5 | t1 | — | — | 0.09 | 0.29 | — | x | 69 | |
| t2 | — | — | 0.09 | 0.17 | — | x | 45 | ||
| 6 | t1 | — | — | 0.10 | 0.14 | — | x | 190 | |
| t2 | — | — | — | 0.13 | — | x | 270 | ||
| 7 | t1 | — | — | 0.09 | 0.11 | — | x | 120 | |
| t2 | — | — | — | — | 0.11 | x | 228 | ||
Note. x: drug not administrated for that subject; —: not detected M: Morphine; HM: hydromorphone, NorM: Normorphine, HM-3G: Hydromorphone-3-gulcuronide; DiHM/DiHisoM: dihydromorphone/dihydroisomorphone, NorHM: Norhydromorphone.
Correlations between morphine were detected in blood and normorphine from both, EBC, and ethanol rinse breath fractions (figure 4(A)). Hydromorphone, considered a minor metabolite after morphine administration, was detected in one of the patients with morphine infusion. However, the correlation was not possible due to the lack of replicates. When comparing EBC and serum concentrations in hydromorphone-infused patients, the detected opioid in the blood samples also correlated with dihydromorphine/dihydroisomorphine (figure 4(B)) and norhydromorphone (figure 4(C)) from both. This is true for both the EBC and solvent rinse and hydromorphone-3-glucuronide (figure 4(D)) in ethanol breath fractions.

Figure 4. Correlation between morphine (A) and hydromorphone (B)–(D) in serum and its detected metabolites in breath from patients infused with both opioids.
Download figure:
Standard image High-resolution image
4. Conclusions
In this pilot study, we were able to detect, quantify, and identify several opioid metabolites in EBC and the subsequent ethanol solvent wash of the collection device. This confirms that infused opioid drugs are present in exhaled breath, albeit in low amounts. Since opioid drugs go through several possible sites of metabolism before being excreted into the alveolar lining fluid to enter the breath, it is anticipated that we would see much lower drug concentrations in breath compared to blood [30]. We found promising correlations between concentrations in blood and breath for some of the main opioids and their metabolites, such as normorphine and norhydromorphone in EBC and hydromorphone 3-glucuronide in both EBC and ethanol rinse fractions.
Techniques that monitor exhaled drugs in breath are relatively new, and most of them are in the early stages of development. However, the use of breath drug monitoring platforms is very attractive in terms of being non-invasive and useful in a variety of settings. Though blood and urine are widely accepted gold standards, they are limited by the need for invasive collection and, often, the need for clinical lab analysis. Breath offers the opportunity to collect a diagnostic biospecimen non-invasively and, eventually, a way to obtain near real-time results almost anywhere. Though this study did not utilize portable analytic systems, future breath drug detection platforms used to identify targeted (known) compounds will be available for point-of-care use. This will enable opioid detection in many settings including roadside, drug treatment facilities, field emergency response, home, and rural areas with limited access to healthcare.
The main goal in this study was to demonstrate feasibility of drug detection in breath and to show that there is a correlation between breath opioid concentrations and serum concentrations. Future studies are needed to better understand: 1. how opioids metabolize into breath; 2. correlation coefficients between breath and serum opioid concentrations; and 3. the optimal opioid metabolites to assess to determine parent opioid concentrations. This study has clear limitations. First, the volume of EBC is a limiting factor for this type of patients and alternative conditions and fractions will be addressed in future studies. For example, an initial water rinse of the glass tube after collection in case low volumes are collected could provide more information of the EBC fraction. Second, the collected EBC fraction catch only some fraction of the aerosol (EBA) that goes through the saliva trap and contains larger molecules. In future research the aerosol fraction will be also analyzed in more detail to cover a wider spectrum or droplet sizes. And third, the small number of subjects precludes any robust conclusions, and more subjects taking a specific opioid and at various times from opioid ingestion will be required also in future studies. The small sample size also limits our ability to discern between different biologic characteristics (e.g. sex, weight, basal metabolic rate, etc) and the findings of opioid concentrations and EBC-blood correlations. Again, more subjects (minimum of 25–30 per drug) with further analysis would help understand these factors better. By developing studies and analytic tools to answer these questions, we envision breath opioid platforms living up to the promise of a point-of-care and broadly useful detection method.
Acknowledgments
Support was provided by UC Davis UCDMC Collaborative for Diagnostic Innovation [CED, MS]; NIH award U01 EB0220003-01 (CED); the NIH National Center for Advancing Translational Sciences (NCATS) through grant UL1 TR000002 (CED); NIH award 1P30ES023513-01A1 (CED); NIH award UG3-OD023365 [CED]; NIH-National Heart, Lung and Blood Institute 1K23HL127185 [MS]. This work was performed, in part, under the auspices of the US Department of Energy by Lawrence Livermore National Laboratory under Contract DE-AC52-07NA27344 and supported, in part, by LLNL Lab-directed Research and Development (LDRD) project 17-LW-021 [MF, KR, CED, EB]. The contents of this manuscript are solely the responsibility of the authors and do not necessarily represent the official views of the funding agencies.