
Abstract
In this pilot study, volatile molecules produced by cultures of Mycobacterium tuberculosis were evaluated to determine whether they could be used to discriminate between uninfected and M. tuberculosis-infected macaques. Thirty seven of the culture biomarkers were detectable in macaque breath and were shown to discriminate between uninfected and infected animals with an area under the curve (AUC) of 87%. An AUC of 98% was achieved when using the top 38 discriminatory molecules detectable in breath. We report two newly discovered volatile biomarkers, not previously associated with M. tuberculosis, that were selected in both our in vitro and in vivo discriminatory biomarker suites: 4-(1,1-dimethylpropyl)phenol and 4-ethyl-2,2,6,6-tetramethylheptane. Additionally, we report the detection of heptanal, a previously identified M. tuberculosis breath biomarker in humans, as an in vitro culture biomarker that was detected in every macaque breath sample analyzed, though not part of the in vivo discriminatory suite. This pilot study suggests that molecules from the headspace of M. tuberculosis culture show potential to translate as breath biomarkers for macaques infected with the same strain.
Export citation and abstract BibTeX RIS
1. Introduction
Mycobacterium tuberculosis infection kills at least 1.5 million people each year and current diagnostic tools have limitations that hamper control efforts. Diagnostic methods including culture, nucleic acid amplification, and smear microscopy, are dependent on sputum production, a sample not produced or of insufficient quality for up to one third of patients [1, 2]. In 2014, the World Health Organization (WHO) released a report calling for the development of a rapid, non-sputum-based biomarker test that did not require bacterial isolation for the detection of active tuberculosis (TB) [3]. The non-invasive and rapid analysis of exhaled breath has the potential to fulfil these requirements. The introduction of a breath-based diagnostic test for M. tuberculosis infection could have significant impact by providing diagnosis, potentially in a point-of-care setting, especially in cases where sputum is of low quality or cannot be produced [4].
The development of breath-based TB diagnostics has utilized three primary approaches for volatile biomarker discovery, including the analysis of in vitro culture [5–9], the analysis of breath from animal models [10, 11], and the direct analysis of human breath samples [5, 12–18]. Several pilot studies in humans [5, 12–18] have demonstrated the efficacy of volatile molecules in breath for discriminating individuals with and without TB-disease, however it remains unknown whether these biomarkers are pathogen- or host-derived. Pathogen-produced volatile biomarkers may be identified by analyzing the volatile molecules produced by mycobacteria grown in isolated culture. Studies on other respiratory pathogens have linked culture-derived volatile molecules such as 2-aminoacetophenone [19–22] and hydrogen cyanide [23, 24] to the setting of Pseudomonas aeruginosa lung infection, and α-and β-trans-bergamotene in the setting of an Aspergillus fumigatus lung infection [25]. Although M. tuberculosis volatile biomarkers have been evaluated in both in vitro [5–9] and in vivo [5, 10–18] conditions, a comprehensive evaluation of culture biomarkers for discriminating in vivo samples has not yet been reported.
Macaques have been used to model over 70 different human infectious diseases [26]. With regard to M. tuberculosis infection, macaques have been shown to share the complete spectrum of clinical and pathological characteristics of human lung infection, allowing the disease to be monitored through measures similar to those used for human infection [27]. This quality is not shared by other animal models of M. tuberculosis, such as the mouse, guinea pig and rabbit [28, 29]. Implementation of breath analysis to macaque models [10], where the infection timing and dose can be controlled, and the severity of disease assessed by imaging and other measures, provides a controlled opportunity to evaluate volatile biomarkers identified from culture.
In this pilot study, volatile molecules from the headspace of M. tuberculosis cultures were investigated as potential biomarkers for infection in a non-human primate model, by using comprehensive two dimensional gas chromatography coupled to mass spectrometry (GC × GC-MS) [30]. Thirty seven volatile molecules produced by in vitro-grown M. tuberculosis were detectable in the breath of macaques and achieved an area under the curve (AUC) of 87% for discriminating uninfected and infected animals. The highest level of discrimination (98%) was achieved through use of a suite of 38 molecules selected directly from the breath samples, two of which were are part of the in vitro discriminatory biomarker suite.
2. Materials and methods
2.1. Bacterial culturing and sample preparation
The M. tuberculosis strain Erdman was used for all experiments. For in vitro sample preparation, 10 ml Middlebrook 7H9 broth (BD Diagnostics, Franklin Lakes, NJ, USA) supplemented with OADC enrichment (BD Diagnostics), and 0.05% Tween 20 was inoculated with a 1/100 dilution of the Erdman strain culture. Culture samples were prepared at the Harvard T H Chan School of Public Health (Boston, MA). Samples were incubated aerobically at 37 °C for 2 or 7 days. Supernatant samples of each culture were harvested by filter sterilizing twice (Pall 25 mm syringe filter, (VWR, Radnor, PA)) and stored at −80°C until analysis. See supplementary figure S1 available online at stacks.iop.org/JBR/13/016004/mmedia for cell counts at time of harvest. Sterile media control samples were prepared in the same fashion. For the extraction of volatile molecules, 6 ml supernatant was pipetted into a 20 ml GC headspace glass vial, sealed with a PTFE/Silicone cap (Supelco, Bellefonte, PA), and incubated at 37 °C for 10 min. By penetrating the PTFE/Silicone cap with two 18 gauge syringe needles (VWR, Radnor, PA), and with the sample maintained at 37 °C, a vacuum pump was used to draw 1.5 L room air through the vial headspace (gas phase above liquid sample) and onto a thermal desorption tube containing Carbopack Y, Carbopack X and Carboxen 1000 (Supelco, Bellefonte, PA). Samples were stored at 4 °C and analyzed within one week of extraction.
2.2. Animals
Nine adult Cynomolgus macaques (Macaca fasicularis) (4–8 years old, 5–8 kg) were purchased from Valley Biosystems (West Sacramento, CA) and housed at the University of Pittsburgh in the Regional Biocontainment Laboratory, a BSL-3 animal facility. All animal protocols and procedures were approved by the University of Pittsburgh's Institutional Animal Care and Use Committee. Prior to admission to the study, each animal underwent rigorous testing including body weight monitoring, complete blood count, and chemistry panel to verify they were free of any pre-existing diseases. Animals were sampled before and during the infection with M. tuberculosis.
2.3. M. tuberculosis infection and confirmation
The M. tuberculosis strain Erdman was used for infection. A frozen aliquot was diluted in sterile saline, sonicated for 15 s, and diluted to the appropriate concentration for infection. An aliquot of the inoculant was plated on 7H10 agar plates to determine the colony forming units (CFU). Cynomolgus macaques were anesthetized with ketamine (Butler Schein Animal Health, 10–20 mg/kg, intramuscularly) and infected with a low dose (3-13 CFU) M. tuberculosis via intra-bronchial instillation, as previously described [29]. Infection was confirmed by tuberculin skin test conversion of negative to positive and by positron emission and computed tomography (PET-CT), as previously described [31, 32].
2.4. Breath collection and concentration
For breath collection, the animals were sedated with an intramuscular injection of ketamine as above and intubated with a low-pressure cuffed endotracheal (ET) tube, as described previously [10]. With the animal freely breathing through the ET tube, a 5 L Tedlar bag (SKC, Eighty Four, PA) was attached via non-rebreathing T-valve (Instrumentation Industries Inc., Bethel Park, PA) and over the course of 3–5 min, 3.5–4 L breath was collected. 1.5 L breath was filter sterilized with a 0.22 μm filter (VWR, Radnor, PA) and concentrated onto a thermal desorption tube containing the same sorbent bed used for culture headspace collection (Carbopack Y, Carbopack X and Carboxen 1000, (Supelco, Bellefonte, PA)) via vacuum pump. Samples were stored at 4 °C and analyzed within one month of breath collection. As demonstrated previously [10], we have shown this method to result in the reproducible detection of a wide array of breath molecules in non-human primates [10] and mice [11]. Breath was collected from the nine animals once prior to infection (over five independent sample collection days) and 1–2 months post-infection with the Erdman strain M. tuberculosis (over six independent sample collection days). Two technical replicates (1.5 L) were collected from the same breath collection bag at each sample collection time point. Supplementary table S1 provides the infection dose as well as the breath collection and infection dates for each animal.
2.5. Analytical instrumentation and feature identification
A Pegasus 4D (LECO Corporation, St. Joseph, MI) two dimensional gas chromatography time of flight mass spectrometer (GC  GC-TOFMS) with Agilent 6890 GC and rail autosampler (MPS, Gerstel, Linthicum Heights, MD) was used for volatile metabolite analysis. Details of the sample concentration, desorption, chromatography and mass spectrometry conditions are shown in supplementary table S2. Data acquisition, analysis, and sample alignment was performed using ChromaTOF software version 4.50 (LECO Corp.). For peak identification, a signal-to-noise (S/N) cutoff was set at 50, and resulting peaks were tentatively identified by a forward search (minimum similarity 850/1000) of the NIST 2011 library. Where available, analytical standards were used for putative identity confirmation, as detailed by Sumner and colleagues [33], in accordance with the Chemical Analysis Working Group Metabolomics Standards Initiative. For the alignment of peaks across chromatograms, maximum first- and second-dimension retention time deviations were set at 6 s and 0.1 s, respectively, and the inter-chromatogram spectral match threshold was set at 600. A S/N ratio of 50:1 was required in at least one chromatogram and a minimum of 10:1 in all others.
2.6. Statistical analysis
All statistical analyses were performed using Python version 2.7.1. After the removal of artifacts (e.g., siloxanes and phthalates) [34], breath and culture samples were normalized by probabilistic quotient normalization [35]. The feature inclusion criteria were as follows:
For culture samples:
- Present in 100% of day 2 culture samples (or day 2 sterile media)
- Present in 100% of day 7 culture samples (or day 7 sterile media)
- Present in 80% of the aggregated day 2 and day 7 culture samples (or aggregated sterile media).For breath samples:
- Present in 80% of either pre- or post-infection breath samples.
For the identification of discriminatory features, the Random Forest [36] classification algorithm was used, which takes into account presence, absence and the abundance of each detected feature. Features were selected as discriminatory if they were ranked in the top 100 in 100/100 RF iterations of 1000 trees, based on their mean decrease in impurity. Volcano plot [37] was used to visualize the discriminatory value and differential expression of each breath feature. Receiver operating characteristic (ROC) curve analysis [38] was used to visualize the discriminatory performance of the Random Forest Model. The Random Forest model used in ROC analysis was internally validated in 100 permutations in which 2/3 of the samples were used for training and 1/3 of the samples used to assess the classification accuracy of the model. Throughout each round of cross validation, all samples from an individual animal were placed in either the training or test set, in order to account for the longitudinal design. Youden's index was used to calculate optimal cutoff values for sensitivity and specificity [39]. To test for statistical significance with regard to the chromatographic peak area of each analyte between classes, the Mann–Whitney U test [40], with Benjamini–Hochberg (BH) correction [41] was used. A significance level of p < 0.05 was selected. The feature reduction methodology is detailed in figure 1.
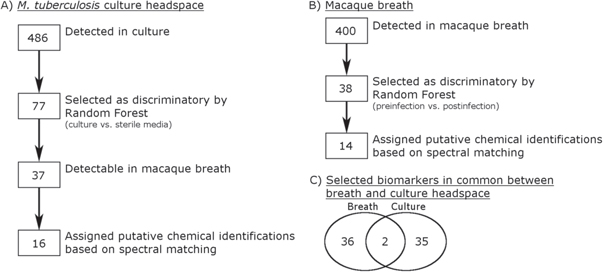
Figure 1. Data reduction steps for macaque breath and culture headspace culture analysis. (A) A total of 486 volatile molecules met the inclusion criteria among the culture headspace samples. 77 of these volatile molecules were selected as discriminatory between culture and sterile media through Random Forest classification, of which 38 were detectable in macaque breath. Sixteen out of the 38 discriminatory culture volatile molecules were assigned putative chemical identifications based on mass spectral similarity to the NIST 2011 library. (B) A total of 400 volatile molecules met the inclusion criteria among the macaque breath samples. Forty-one of these volatile molecules were selected as discriminatory between pre-infection and post-infection animals through Random Forest classification. Fourteen out of the 41 selected discriminatory breath volatile molecules were assigned putative chemical identifications based on mass spectral similarity to the NIST 2011 library. (C) Venn diagram showing the overlap between the 41 discriminatory breath volatile molecules and the 38 discriminatory culture volatile molecules detectable in breath.
Download figure:
Standard image High-resolution image2.7. Data availability
The datasets generated during and/or analysed in the current study are available from the corresponding author upon reasonable request.
3. Results
3.1. Identification of discriminatory volatile features in culture headspace
Sterile media (7H9) and M. tuberculosis Erdman strain cultures were sampled at two time points (day 2 and day 7), which represent approximately exponential and stationary growth phases (see supplementary figure S1 for more details). Aggregating all the culture samples, a total of 486 volatile features met the inclusion criteria and were considered for feature selection (figure 1).
The Random Forest algorithm [42] was used for the selection of discriminatory features between sterile media and culture headspace samples through three models: one using day 2 samples, one using day 7 samples and one using the aggregated day 2 and day 7 samples. Thirty three, 36 and 34 discriminatory features were selected through these three models, respectively (figures 2(A)–(C)), resulting in a total of 76 unique features, five of which were shared between the three models (figure 2(D)). The variance between sterile media and culture when considering the selected features is illustrated using principal component analysis in figure 3.

Figure 2. Selection of in vitro biomarkers of Erdman strain M. tuberculosis. Volcano plots showing log10(mean decrease impurity) versus log2(Culture/Media) of (A) the 380 day 2 volatile features; (B) the 322 day 7 volatile features; and (C) the 435 aggregated volatile features. Triangles represent volatile features selected as discriminatory using the Random Forest Classification algorithm. Black triangles represent volatile molecules statistically different between culture and sterile media (p < 0.05). Circles represent volatile molecules not identified as discriminatory or significant. (D) Venn diagram showing the distribution of the selected volatile molecules among the three in vitro analyses. Values indicate the number of volatile features selected as discriminatory (Dis.) and significant (Sig.).
Download figure:
Standard image High-resolution image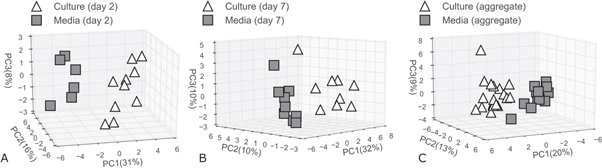
Figure 3. Principal components analysis of culture and sterile media samples. (A) Day 2 culture samples and day 2 sterile media samples when using the 33 selected discriminatory volatile metabolites. (B) Day 7 culture samples and day 7 sterile media samples when using the 36 selected discriminatory volatile metabolites. (C) Aggregated day 2 and day 7 culture samples and aggregated day 2 and day 7 sterile media samples when using the 34 selected discriminatory volatile metabolites.
Download figure:
Standard image High-resolution imageOf the discriminatory features selected in the three models, nine (day 2 samples, figure 2(A)), seven (day 7 samples, figure 2(B)), and nine (aggregated day 2 and day 7 samples, figure 2(C)) features were significantly different between culture and sterile media samples (p < 0.05). A Venn diagram depicting the distribution of the 76 selected features from these three analyses is shown in figure 2(D).
3.2. Identification of discriminatory volatile features in breath
Breath samples were collected from each of the nine macaques before infection and 1–2 months after infection with M. tuberculosis. Aggregating all breath samples, a total of 400 features met the inclusion criteria and were considered for feature selection. The Random Forest algorithm was used for the selection of volatile features in breath that best discriminate uninfected animals from infected animals. The distribution of discriminatory efficacy among the 400 volatile features is shown via a volcano plot in figure 4. Of the 400 volatile features evaluated, 38 were selected as discriminatory by Random Forest, all of which were statistically different in expression between uninfected and infected animals.

Figure 4. Direct selection of breath biomarkers. Volcano plot showing Log10(mean decrease impurity) versus log2(infected/uninfected) for the 400 detected macaque breath volatile features. Triangles represent the 38 volatile features selected as discriminatory between uninfected and infected macaque breath samples using the Random Forest classification algorithm.
Download figure:
Standard image High-resolution image3.3. Assessment of discriminatory value of selected biomarkers
We investigated whether the volatile features produced by M. tuberculosis grown in culture hold discriminatory value in breath and vice versa. As such, we assessed the efficacy of the 76 features selected from culture headspaces for discriminating uninfected and infected macaque breath samples and the use of the 38 features selected from breath for discriminating culture and sterile media samples. Of note, the same volatile molecules sampling approach (dynamic headspace-thermal desorption), adsorbent material (Carbopack Y, Carbopack X and Carboxen 1000), volume of sampling (1.5 L) and detection system (GC × GC-MS) was used for in vitro and in vivo samples, which make molecule comparison and translation more reliable.
Out of the 76 selected culture features, 37 were detectable in the macaque breath samples. Of these 37, 15 were selected from the day 2 culture samples, 20 were selected from the day 7 culture samples, and 13 were selected from the aggregated culture samples (figure 5(A)). To evaluate these 37 culture headspace features for their discriminatory potential in macaques, four Random Forest models were generated: one model using all the 37 features, and three models using the features identified in each of the individual culture comparisons (figure 5(A)). ROC curve analysis with 100 rounds of cross validation was used to evaluate discriminatory efficacy (figure 5(B)).

Figure 5. (A) Venn diagram showing the distribution of culture headspace biomarkers detectable in pre-infection and infected macaque breath samples. Values indicate the number of culture biomarkers detectable (Det.) in breath, discriminatory (Dis.) between pre-infection and post-infection macaque breath samples and statistically significant (Sig.) between pre-infection and post-infection macaque breath samples. (B) ROC curves for the discrimination of pre-infection and post-infection macaque breath samples using: (Blue) the 15 features selected from the day 2 culture samples (AUC = 85%). (Orange) the 20 features selected from the day 7 culture samples (AUC = 65%). (Green) the 13 features selected from the aggregated culture samples (AUC = 87%), optimal cutoff sensitivity, specificity and accuracy = 86%, 67%, 77%. The optimal sensitivity and specificity cutoff is indicated by the circle on this curve. (Black) the 38 features uniquely selected among these three analyses (AUC = 83%).
Download figure:
Standard image High-resolution imageThe highest AUC using features selected from culture headspaces, 87%, was achieved in the model which utilized the culture headspace biomarkers selected from the aggregated samples. The sensitivity, specificity and accuracy of the optimal cutoff for this model were 80%, 75% and 77%, respectively. For comparison, a ROC curve was generated using the top 38 features selected directly from the breath samples. Here, an AUC of 98% was achieved with optimal sensitivity, specificity and accuracy of 97%, 97% and 97%, respectively. Control models which utilized randomized class labels resulted in an average AUCs between 49%–51%, which is significantly lower (p < 0.0001) than the supervised models. In contrast, the top features selected from culture were able to discriminate between culture and sterile media with AUCs of 98%, 89% and 91% for the aggregate, day 2, and day 7 culture samples, respectively.
The discriminatory efficacy of the 38 breath biomarkers selected from pre-infection and post-infection macaque breath was evaluated for their ability to discriminate between culture and sterile media samples. Of those 38, 24 were detectable in the aggregated culture samples, 23 in the day 2 cultures, and 21 in the day 7 culture samples. Random Forest was used to build classification models using the discriminatory breath features that were detected in the culture samples (supplementary figure S2). The AUCs associated with these models were 88%, 49% and 65% for the aggregate samples, day 2 samples and day 7 samples, respectively.
3.4. Putative chemical identification of biomarkers
The putative identification of M. tuberculosis volatile biomarkers identified in culture and breath were investigated based on their spectral match scores to the NIST 2011 library. Twenty four molecules were assigned putative identities (culture: 15/37; breath 11/38) (table 1) and of these, 11 were significantly different between pre- and post-infection macaque breath samples. Of these 11 statistically significant molecules, one molecule, 3-methylidene-6-propan-2-ylcyclohexene (β-phellandrene), was selected as part of the discriminatory suite through culture analyses, two (4-(1,1-dimethylpropyl)phenol and 4-ethyl-2,2,6,6-tetramethylheptane) were selected as part of the discriminatory suite by both culture and breath analyses, and the remaining molecules were selected as part of the discriminatory suite through breath analysis only. Five out of the nine molecules selected through breath analysis only were detectable in the culture samples. See figure 6 to visualize the relative abundance and variation of the 24 putatively identified molecules among pre- and post-infection breath samples.
Table 1. Table of putatively identified volatile biomarkers of M. tuberculosis, selected through the analysis of culture, or directly from the comparison of pre- and post-infection macaque breath samples.
| Putative compound identification | Selected as discriminatorya | Formula | Chemical Abstracts Service (CAS) number | Log2(Infected/Uninfected) |
|---|---|---|---|---|
| 2,3,6-trimethylnapthaleneb | B | C13H14 | 829-26-5 |

|
| 4-methyl-1-deceneb | B | C11H22 | 13151-29-6 |

|
| 4-ethyl-2,2,6,6-tetramethylheptaneb | B,Ce | C13H28 | 62108-31-0 |

|
| 2,2,3-trimethylhexaneb | B | C9H20 | 16747-25-4 |

|
| 2-ethylhexyl isobutyl sulfite | Ce | C12H26O3S | — |

|
| 3-hydroxy-3-methylbutanoic acid | Cd | C5H10O3 | 625-08-1 |

|
| 6-phenyl-4-(1-phenylethoxy)-1-Hexeneb | B | C20H24O | — |

|
| Butyl acetateb | B | C6H12O2 | 123-86-4 |

|
| 2-Pinene | Cd | C10H16 | 80-56-8 |

|
| Azulene | Ce | C10H8 | 275-51-4 |

|
| Heptanalc [7] | Cd, e | C7H14O | 111-71-7 |

|
| 1-propynylbenzene | Ce | C9H8 | 673-32-5 |

|
| 2,3,6-trimethylheptane | Ce | C10H22 | 4032-93-3 |

|
| 1,2,3-trimethylbenzeneb | B | C9H12 | 526-73-8 |

|
| 1,2-xylene | Cd, f | C8H10 | 95-47-6 |

|
| 4-ethyldecane | Ce | C12H26 | 1636-44-8 |

|
| Indaneb | B | C9H10 | 496-11-7 |

|
| 2,5-dimethyldecane | Cf | C12H26 | 17312-50-4 |

|
| 1-nitroadamantane | Ce, f | C10H15NO2 | 7575-82-8 |

|
| 2,6-dimethylheptadecane | Cf | C19H40 | 54105-67-8 |

|
| beta-phellandreneb | Ce | C10H16 | 555-10-2 |

|
| 2,2,4,6,6-pentamethylheptaneb, c[43] | B | C12H26 | 13475-82-6 |

|
| 4-tert-Amyl phenolb | B,Cf | C11H16O | 80-46-6 |

|
| Ethyl butyrateb | B | C6H12O2 | 105-54-4 |

|
 Higher expressed in infected macaque breath samples.
 Higher expressed in uninfected macaque breath samples.Bold underline indicates compounds that have been confirmed by the analysis of analytical standards.Parentheses indicate the reference from which a compound has been previously been reported as an M. tuberculosis biomarker.
aB: Selected as discriminatory directly from the breath samples; C: Selected as discriminatory through in vitro culture analysis.
bSignificantly different in vivo (uninfected versus infected, p < 0.05).
cPreviously identified as M. tuberculosis breath biomarker.
dSelected through day 2 culture samples.
eSelected through day 7 culture samples.
fSelected through aggregated samples.
Higher expressed in uninfected macaque breath samples.Bold underline indicates compounds that have been confirmed by the analysis of analytical standards.Parentheses indicate the reference from which a compound has been previously been reported as an M. tuberculosis biomarker.
aB: Selected as discriminatory directly from the breath samples; C: Selected as discriminatory through in vitro culture analysis.
bSignificantly different in vivo (uninfected versus infected, p < 0.05).
cPreviously identified as M. tuberculosis breath biomarker.
dSelected through day 2 culture samples.
eSelected through day 7 culture samples.
fSelected through aggregated samples.

Figure 6. Expression of the 24 putatively identified M. tuberculosis biomarkers among pre- and post-infection breat samples. (A) 1-nitroadamantane, (B) butyl acetate, (C) ethyl butyrate, (D) 2,5-dimethyldecane, (E) 2,3,6-trimethylnapthalene, (F) 2,6-dimethylheptadecane, (G) o-xylene, (H) 2,3,6-trimethylheptane, (I) heptanal, (J) 2-Pinene, (K) 4-tert-Amyl phenol, (L) 4-methyl-1-decene, (M) beta-phellandrene, (N) 1,2,3-trimethylbenzene, (O) 2,2,4,6,6-pentamethylheptane, (P) 4-ethyl-2,2,6,6-tetramethylheptane, (Q) 6-phenyl-4-(1-phenylethoxy)-1-Hexene, (R) azulene, (S) 2,2,3-trimethylhexane, (T) 3-hydroxy-3-methylbutanoic acid, (U) indane, (V) 1-propynylbenzene, (W) 2-ethylhexyl isobutyl sulfite, (X) 4-ethyldecane.
Download figure:
Standard image High-resolution image
4. Discussion
To the best of our knowledge, this is the first time M. tuberculosis volatile biomarkers identified via in vitro culture analysis have been used to discriminate uninfected and infected non-human primates. The volatile biomarkers selected from culture demonstrated discriminatory efficacy in breath, with an AUC of 87%. In contrast, an AUC of 98% was achieved when using a suite of molecules selected directly from breath. Biomarkers from the breath model could discriminate culture and sterile media samples with an AUC of 88%. We report on two newly discovered volatile biomarkers, not previously associated with M. tuberculosis, that were selected in both our in vitro and in vivo discriminatory biomarker suites; 4-(1,1-dimethylpropyl)phenol and 4-ethyl-2,2,6,6-tetramethylheptane. Both molecules were detected in greater than 75% of post-infection breath samples. Although not part of the in vivo discriminatory suite, we also note the detection of heptanal, a previously reported M. tuberculosis breath biomarker in humans, as an in vitro culture biomarker that was detected in every macaque breath sample analyzed, including uninfected animals.
In the present pilot study, M. tuberculosis was grown in 7H9 broth for in vitro biomarker identification. As the volatile profile produced by bacteria has been shown to be at least partially time point dependent [44–46], samples were prepared at both mid-exponential and stationary phases of growth in order to obtain a broader profile of metabolites that may be produced by this organism when living in the lung. Out of 76 M. tuberculosis biomarkers identified through culture analysis, only five were identified in all three culture models we investigated (day 2, day 7 and the aggregated culture samples). However, out of the 76 culture biomarkers, 38 were detected among the macaque breath samples. This suggests that the investigation of culture samples across a wide range of time points, or perhaps different growth conditions, may result in the identification of a higher number of compounds that translate between in vitro and in vivo breath studies.
Only three volatile molecules have been previously reported as M. tuberculosis biomarkers in both breath and culture: 1-methylnapthalene [14], 1,4-dimethylcyclohexane [14], and 2,2,4,6,6-pentamethylheptane [13, 14]. In both studies, by Phillips and colleagues, all three molecules were detected in M. tuberculosis cultures grown in a media similar to ours (VersaTREK myco bottles), and were selected as discriminatory between patients with confirmed M. tuberculosis infection and those without. We note that 2,2,4,6,6-pentamethylheptane is part of our discriminatory biomarker suite for macaque breath classification, but was not detectable in our culture headspace. Regarding the other two previously reported molecules, 1-methylnaphtalene was detected in 100% of breath and culture samples, but was not identified as discriminatory in either context, while 1,4-dimethylcyclohexane was not detected in either culture or breath samples.
We previously identified a suite of 19 putative breath molecules that could be used to discriminate between uninfected and infected macaques [10]. Here, we detected six of these 19 compounds (3,3-dimethylhexane; phenyl acetate; 4-methylene-1-(1-methylethyl)-bicyclo[3.1.0]hexane; 3-methyldodecane; 1,1'-bicyclohexyl; and hexylcyclohexane) in our cohort of macaques. However, none reached the statistical significance or discriminatory cutoff for being reported in the present work. We suspect that differences in the biomarkers between these studies could be due to the experimental design for each study, specifically the small sample sizes (n = 5 [10] versus n = 9 (this study)) and/or differences in the species evaluated (combination of cynomolgus and rhesus macaques [10] versus only cynomolgus macaques [this study]).
The higher diagnostic accuracy of the volatile molecules selected directly from breath (versus culture headspace) suggests that there are additional molecules in breath that have discriminatory value. It is possible that these additional molecules could be produced by M. tuberculosis under growth conditions in the lung, by the host in response to infection, or by a combination of both. With regards to origination from the host, others have shown that inflammatory processes during bacterial lung infection [47], including M. tuberculosis infection [48, 49], result in the production of reactive oxygen species (ROS) which are associated with lipid peroxidation and the eventual production of aldehydes and saturated hydrocarbons, and which may be exhaled in breath [50–52]. In the present pilot study, the saturated hydrocarbon 2,2,3-trimethylhexane, was selected as a discriminatory molecule in breath and was statistically greater in infected animals. Branched hydrocarbons similar in structure to 2,2,3-trimethylhexane have previously been linked to ROS and lipid peroxidation [53, 54], suggesting that this compound could plausibly have been produced through the same host pathway. What is more, a number of identified molecules were shown to be higher expressed in pre-infection animals as compared to post-infection animals. Although their true origin is unknown, it is possible that these metabolites may be those consumed by M. tuberculosis during infection, or, metabolites down regulated in production during the host's immune response to infection.
Due to the limited number of animals available for the present study (n = 9), cross validation was utilized in order to get an estimate of the classification accuracy using the selected biomarkers. Future studies should consider blinded validation of the reported analytes in order to assess their reproducibility in a larger population. What is more, each animal was anaesthetized with ketamine prior to breath sample collection. To the best of our knowledge, the effects of ketamine on volatile molecule production are unknown. However, as the same dose of ketamine was administered for all animals prior to and after infection with M. tuberculosis, we do not expect this to introduce bias regarding the identified biomarkers. Here, we elected to focus on quantifying the relative concentration of each analyte between classes (i.e. pre- versus post-infection), because we feel that this is most relevant from a biomarker identification standpoint for a study at the pilot-scale.
5. Conclusion
The present pilot study evaluates the efficacy of using M. tuberculosis volatile biomarkers identified through in vitro culture analysis for the discrimination of uninfected and infected macaques. A subset of the headspace molecules from culture demonstrated discriminatory efficacy between animals pre- and post-infection (AUC = 87%); however, higher classification accuracy was achieved when using volatile molecules selected directly from the breath samples (AUC = 98%). Biomarkers selected directly from breath were shown to discriminate between culture and sterile media samples with an AUC of 88%. To gain further utility from this approach, future studies could sample M. tuberculosis growing under a wider range of conditions, sample a larger or more heterogeneous cohort of animals, or collect breath at different time points through infection. Future studies will also investigate the biochemical origin of the biomarkers, and assess the use of breath biomarkers for disease severity evaluation.
Acknowledgments
These studies were supported by grants from the Aeras Global TB Vaccine Foundation (JLF) and from the NIH: AI114674 (JLF), AI111871 (PLL). M N was supported by the Burroughs Wellcome Fund institutional program grant unifying population and laboratory based sciences to Dartmouth College (Grant#1014106).