
Abstract
Hypoxia-like incidents in-flight have increased over the past decade causing severe safety concerns across the aviation community. As a result, the need to monitor flight crews in real-time for the onset of hypoxic conditions is paramount for continued aeronautical safety. Here, hypoxic events were simulated in the laboratory via a reduced oxygen-breathing device to determine the effect of recovery gas oxygen concentration (21% and 100%) on exhaled breath volatile organic compound composition. Data from samples collected both serially (throughout the exposure), prior to, and following exposures yielded 326 statistically significant features, 203 of which were unique. Of those, 72 features were tentatively identified while 51 were verified with authentic standards. A comparison of samples collected serially between recovery and hypoxia time points shows a statistically significant reduction in exhaled breath isoprene (2-methyl-1,3-butadiene, log2 FC −0.399, p = 0.005, FDR = 0.034, q = 0.033), however no significant difference in isoprene abundance was observed when comparing recovery gases (21% or 100% O2, p = 0.152). Furthermore, examination of pre-/post-exposure 1 l bag breath samples illustrate an overall increase in exhaled isoprene abundance post-exposure (log2 FC 0.393, p = 0.005, FDR = 0.094, q = 0.033) but again no significant difference between recovery gas (21% and 100%, p = 0.798) was observed. A statistically significant difference in trend was observed between isoprene abundance and recovery gases O2 concentration when plotted against minimum oxygen saturation (p = 0.0419 100% O2, p = 0.7034 21% O2). Collectively, these results suggest exhaled isoprene is dynamic in the laboratory ROBD setup and additional experimentation will be required to fully understand the dynamics of isoprene in response to acute hypoxic stress.
Export citation and abstract BibTeX RIS

Original content from this work may be used under the terms of the Creative Commons Attribution 3.0 licence. Any further distribution of this work must maintain attribution to the author(s) and the title of the work, journal citation and DOI.
Introduction
In-flight hypoxia-like events have been a recurrent problem since the invention of high performance aviation. Over the past decade these events have increased, leading to casualties both in the air and on the ground. As a result, hypoxia was identified by the US Naval Safety Center as the number one threat for naval aircrew [1]. Therefore, research into early detection of hypoxia onset is necessary to preserve the safety of warfighters and civilians while ensuring the continued success of tactical aviation.
Although exhaled breath has been used for prediction of many physiological and disease states, monitoring changes in the volatile organic compound (VOC) profile of exhaled breath has been recently proposed as a potential method for detecting the onset of hypoxia [2–7]. Previous data suggests exhaled breath VOCs change in abundance during periods of reduced blood oxygen saturation [2]. For example, isoprene (2-methyl-1,3-butadiene) was found to change in response to an overall laboratory simulated hypoxic event [2]. These results established preliminary data in support for the use of exhaled breath VOC abundances to recognize hypoxic conditions.
Isoprene is an abundant compound that is found in exhaled breath and displays a dynamic release profile [8–15]. For instance, isoprene has been previously shown to decrease in certain disease conditions such as lung cancer and acute respiratory distress syndrome (ARDS), while increasing in response to changes in respiratory patterns such as breath holding [5, 9–11]. Additionally, changes in isoprene abundance have been linked to increased immune response and modifications to cholesterol metabolism [9, 16]. Therefore, due to the dynamic nature of isoprene in exhaled breath additional evidence is required to further characterize and understand the release profile during and after acute hypoxic exposures.
In this manuscript, 203 unique features were assessed for differential abundance between serially applied sea-level, hypoxia and recovery exposures, each of a 5 min duration, applied via a reduced oxygen-breathing device (ROBD-2) [2]. The results illustrate the dynamic nature of isoprene during hypoxic exposures, with significant differences in abundance observed between hypoxia and recovery time points. Additionally, analysis of breath pre-/post-bag samples illustrated that isoprene had significant differences in abundance that are correlated with minimum oxygen saturation and recovery gas. These results provide additional evidence for the use of changes in exhaled breath isoprene to monitor hypoxic respiratory stress.
Experimental
Human subject recruitment
All human volunteer test subjects were male, non-smoking, active duty military in the United States Air Force with ages ranging from 22 to 39 (supplemental data 1 is available online at stacks.iop.org/JBR/11/047111/mmedia). The study was approved for human use by the Institutional Review Board at the Naval Medical Research Unit-Dayton (NAMRUD.2015.003). Written consent was obtained from each test subject prior to initiation of the experiment.
Experimental setup
Each volunteer test subject was placed in a modified 20 P flight mask and HGU 68/P flight helmet as shown in supplemental data 2(A) [2]. Oxygen concentration was controlled to the flight mask via ROBD (Evironics, Tolland CT, supplemental data 2(B)). Blood pressure, pulse and blood oxygen saturation (SpO2) were recorded as shown and described in supplemental data 2(A). Test subjects were exposed to two separate normobaric simulated flight profiles on different days. Each exposure consisted of three sequential five-minute periods of sea-level oxygen (21% O2), 25 000 feet equivalent oxygen (7620 m, 8% O2) and either sea-level (21% O2) or 100% O2 recovery (supplemental data 2(C)). Test subjects were progressed to the recovery gas if their individual SpO2 fell below 55% or upon their request. A summary of the exposure data and traces of test subjects' SpO2 are provided in supplemental data 3(A) and (B). A timeline of the experiment illustrating collection periods for bags and time series samples also indicates duration of exposure for each of the O2 conditions (supplemental data 4).
Breath collection
Exhaled breath samples were collected directly on to preconditioned stainless steel Tenax TA thermal desorption (TD) tubes affixed with brass caps having polytetrafluoroethylene ferrules when not in use (Markes International, South Wales, UK).
Exhaled breath was collected serially from each test subject throughout the exposure, from each test subject (n = 8) from the exhalation port side of the modified flight mask, as shown in supplemental data 5(A). Exhaled breath volatiles were captured on to Tenax TA TD tubes in one-minute (550 ml min−1) increments via a Logistically Enabled Sampling System-Portable (LESS-P, SignatureScience LLC, Austin, TX, USA). Flow rate to the LESS-P was continuously monitored throughout the experiment by an inline DryCal Defender 510 l flow meter (Bios International Corp, Butler, NJ, USA). Refer to supplemental data 5(B) and (C) for representative flow rate measurements. All sample TD tubes were capped and stored at 4 °C for less than one week until GC-MS analysis [17].
Exhaled breath samples were also collected in 1 l ALTEF polypropylene bags, prior to and following the entire hypoxic exposure, using the previously established breath exhalation protocol (supplemental data 4, Jansen Inert Products, Coral Springs, FL) [2]. Volatiles were immediately transferred from each bag on to Tenax TA TD tubes by a MultiRAE Pro pump (270 ml min−1, 550 ml total volume). Maximal concentrations of carbon dioxide (CO2, %) were recorded via the MultiRAE pump to ensure end tidal breath sample quality (supplemental data 5(D)) [18, 19]. All sample TD tubes were capped and stored, less than one week, at 4 °C until analysis [17].
Gas chromatography-mass spectrometry (GC-MS)
All samples were analyzed on a Thermo Scientific Trace Ultra-ISQ gas chromatograph affixed with a single quadrapole mass spectrometer following TD on a Markes International TD-100 as described previously (TD, Waltham, MA, USA) [2, 20]. Please refer to supplemental data 6 for a detailed description of the TD-GC-MS methodology.
Feature registration, statistical analysis, compound identification and confirmation
XCMS R library distribution (v 3.5) was leveraged to process raw GC-MS data files [21–23]. Exhaled breath peaks were detected within 1 m/z, registered and aligned using parameters consistent for GC-MS data. Refer to supplemental data 7 for the R script. A table of 3147 features was returned for downstream statistical analysis. Initially, the features were excluded if null values were reported in more than 10% of samples and/or retention time standard deviation post registration was greater than 1.5 s. The remaining matrix of 1742 features was quantile normalized and log2 transformed. Redundant peaks, i.e. different m/z at a common apex, are an expected occurrence when generating peak tables from raw GC-MS samples. In general, the presence of redundant peaks leads to high measurement co-linearity, which may mislead cluster formation or statistical significance tests. To limit this effect, time binning was performed to identify the most abundant ion for each XCMS feature retention time when rounded to the nearest second. Four hundred and twenty-nine features were available for statistical analysis. Four comparisons of peak abundances were performed, three within serial sampling (hypoxia versus sea-level, recovery versus sea-level, recovery versus hypoxia) and a pre-/post-bag sampling comparison, representing a total of 1716 individual comparisons. For serial sampling, comparisons were constructed by computing differences in average abundances taken within sea-level, hypoxia or recovery time periods. The average was based on at most five samples within either sea-level or hypoxia time periods.
All statistical analyses were performed using the Matlab and Matlab Statistics Toolbox (R2013a, MathWorks, Natick, MA). Wilcoxon signed rank test (Matlab function signrank.m) was applied to every feature for each paired comparison (i.e. hypoxia/sea-level paired observations) to determine if the group had a non-zero median distribution. Storey q-values (Matlab function mafdr.m) were calculated to control for false discovery rate (FDR). An FDR of 10% was applied to identify feature comparisons that deviated from the null. All statistically significant features were manually inspected. The feature list was manually reduced by removing features corresponding to redundant ions, i.e. multiple ions of the same compound at a specific retention time, siloxanes (column bleed), and noise. The remaining features were tentatively identified by spectral comparison to the NIST 11 Mass Spectral Library (v.2.0, National Institute of Standards and Technology, Gaithersburg, MD). Tentatively identified compounds were verified by mass spectral and retention time comparison to neat standards. Please refer to supplemental data 8 for neat standard chemical information, supplemental data 9 for tentative identification verification methodology and supplemental data 10 for ID verification results.
Results
Test subject blood oxygen saturation
Individual variation of minimum blood oxygen saturation in response to ROBD reduced oxygen exposures has been observed previously [2, 24]. To monitor this effect, finger blood oxygen saturation (%SpO2) was measured and plotted (supplemental data 3(A)). The data show a high amount of variability (47%–76%) in the minimum %SpO2 achieved across test individuals (supplemental data 3(B)). These results confirm previous observations, of variable minimum %SpO2 by test subjects, related to ROBD hypoxic exposures [2]. The results suggest that physical aspects of an individual may be impactful to the blood's ability to store and transport O2.
Overview of exhaled breath results
The statistical comparisons of exhaled breath VOC abundances yielded 326 significant features amongst all comparisons (serial and bag). Of those 326 features, 203 correspond to unique features, 72 to tentatively identifiable compounds and 51 of those compound identifications subsequently verified by retention time and spectral matching to neat standards. Refer to table 1 for summary of the individual comparison results and supplemental data 10 for tentative ID verification data summary. Due to the large number of features and verified compounds identified, focus will be placed on isoprene and those compounds that were previously observed to change in response to hypoxic respiratory stress [2].
Table 1. A summary of the feature results from the statistical comparisons across all samples.
| Comparison | # Signif. features | # Unique features | # Compound tent. ID | # Verified compound IDs |
|---|---|---|---|---|
| Hypoxia v. Placebo: Increase | 61 | 54 | 23 | 17 |
| Hypoxia v. Placebo: Decrease | 37 | 29 | 18 | 13 |
| Recovery v. Hypoxia: Increase | 42 | 38 | 19 | 18 |
| Recovery v. Hypoxia: Decrease | 26 | 21 | 15 | 13 |
| Recovery v. Placebo: Increase | 98 | 82 | 36 | 28 |
| Recovery v. Placebo: Decrease | 36 | 30 | 15 | 12 |
| Bag: Post v. Pre: Increase | 9 | 8 | 5 | 5 |
| Bag: Post v. Pre: Decrease | 4 | 3 | 1 | 1 |
LESS-P time series analysis
The goal of this study was to determine the effects of recovery gas O2 concentration on exhaled breath VOC composition. A comparison of the mean abundances of the recovery gas time period to the mean hypoxia time period yielded 68 significant features (p-value ≤ 0.05, FDR ≤ 0.1, q-value ≤ 0.1) with 31 verified compound identifications (table 1 and supplemental data 12). Among these features, isoprene (2-methyl-1,3-butadiene) was found to significantly decrease (log2 FC −0.399, p = 0.005, FDR = 0.034, q = 0.033) in abundance with under recovery conditions with no observed difference between recovery gas O2 composition (p = 0.152, figure 1(A)).
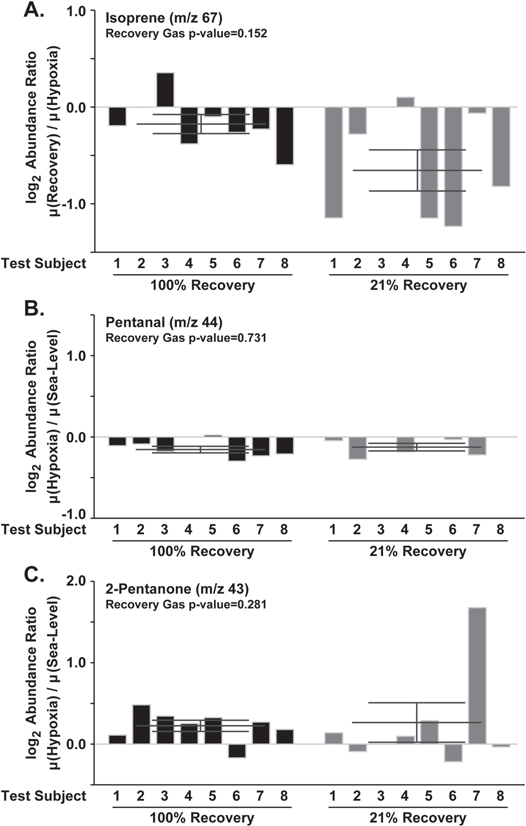
Figure 1. Bar charts of test subjects log2 abundance ratios measured during time course for (A) isoprene (log2 FC −0.399, p = 0.005, FDR = 0.034, q = 0.033), (B) pentanal (log2 FC log2 FC −0.283, p = 0.022, FDR = 0.09, q = 0.088), (C) 2-pentanone (log2 FC 0.244, p = 0.012, FDR = 0.063, q = 0.062). Error bars signify the standard error of the mean. Data shows examples of statistically significant changes in exhaled breath volatile organic compound abundance in response to hypoxic exposure and recovery independent of the recovery gas O2 composition.
Download figure:
Standard image High-resolution imageWhile the goal of this study was to evaluate recovery oxygen's effects on exhaled breath from acute hypoxia exposures, additional samples were acquired across the exposure time course. Of those remaining time series results, 98 features and 30 verified compound identifications were a result of abundance comparisons between hypoxia and sea-level time periods (table 1 and supplemental data 11). A survey of the results highlighted two compounds, pentanal and 2-pentanone, that were previously found to change in abundance in response to reduced oxygen content when compared to sea-level [2]. To further explore the relationship of these compounds to hypoxia exposures, log2 abundance ratios (mean hypoxia abundance/mean sea-level abundance) were calculated and plotted (figures 1(B) and (C)). The results show a statistically significant increase in 2-pentanone abundance (log2 FC 0.244, p = 0.012, FDR = 0.063, q = 0.062) and a significant reduction in pentanal abundance (log2 FC −0.283, p = 0.022, FDR = 0.09, q = 0.088) under hypoxic conditions. These data support previous observations of reduced pentanal abundance under hypoxic conditions when compared to sea-level time points [2]. Interestingly, the results show an inverse response in the 2-pentanone abundance when compared with previous results [2]. While inconsistencies in the data are present, these results support further studies of pentanal and 2-pentanone changes in response to hypoxic stress.
Breath bag analysis
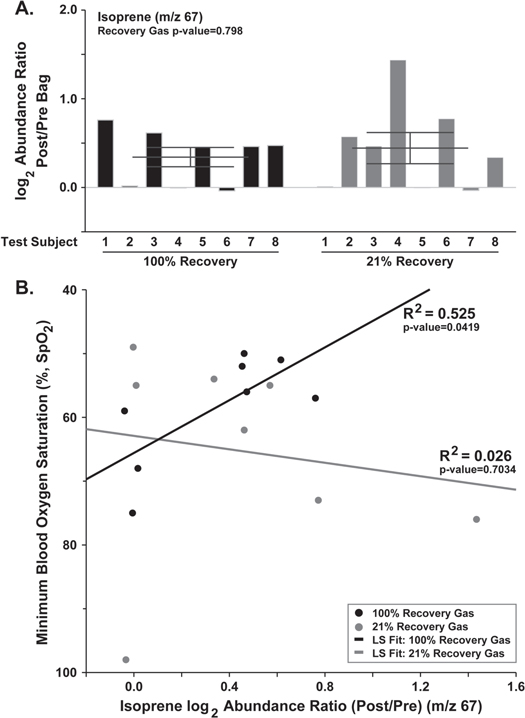
To identify the overall changes in exhaled breath following a hypoxic exposure with different recovery gas O2 compositions, comparisons of VOC abundances from bags collected prior to and following the overall exposure event were performed. Collectively, the data yielded a small number (13) of statistically different features (p-value ≤ 0.05, FDR ≤ 0.1, q-value ≤ 0.1) with only 6 features being verified (table 1 and supplemental data 14). Among the six significant features, isoprene was found to have a significant increase in abundance (log2 FC 0.393, p = 0.005, FDR = 0.094, q = 0.033), post-exposure and recovery, with no observed effect between recovery gas compositions (figure 2(A)). These results suggest increase in isoprene abundance, compared to the breath prior to exposure, may be indicative of an overall hypoxic and recovery event.
Figure 2. (A) Bar chart of the isoprene (log2 FC 0.393, p = 0.005, FDR = 0.094, q = 0.033) log2 abundance ratio (post/pre) from each test subject's exhaled breath bags. (B) A scatter plot of the isoprene log2 abundance ratio by minimum blood oxygen saturation (SpO2) parsed by recovery gas. Data illustrates a statistically significant increase in exhaled breath isoprene post hypoxic exposure. Additionally, the results demonstrate a significant increase (p = 0.0419) in isoprene in those individuals recovered on 100% oxygen gas.
Download figure:
Standard image High-resolution image
Our previous study identified a correlation between increase in isoprene abundance under 100% O2 recovery to the minimal SpO2 achieved by test individuals [2]. To determine if this effect was observed, the log2 abundance ratios (post/pre) for isoprene were plotted against the individual minimum blood oxygen saturation (figure 2(B)). Isoprene abundance significantly increases (p = 0.0419) in the exhaled breath of those individuals recovered under 100% O2, shown by a positive slope of the fit, similar to those results previously observed (figure 2(B)) [2]. However, the effect is not observed (p = 0.7034) in those recovered on 21% O2 gas (figure 2(B)). These results suggest exhaled isoprene is affected by the oxygen concentration or gas delivery provided to the test subject following a hypoxic exposure.
Discussion
As hypoxic events continue to plague the aviation community the need to monitor flight crew is necessary for continued safety. Here, further evidence is provided in support for the use of exhaled breath VOC content to monitor hypoxic stress. The data illustrate the dynamic nature of isoprene in the ROBD setup. In the serial samples, a significant decrease in exhaled isoprene is observed. The significant dynamics of isoprene are not surprising as isoprene has been repeatedly shown to change in response to a large group of stimuli including age, posture, and disease state [8–15]. For example, decreased exhaled isoprene has been shown in other respiratory diseases such as ARDS and lung cancer [5, 9, 10]. Additionally, exhaled isoprene has been shown to be derived from the cholesterol metabolic pathway where decreased cholesterol is linked to decreased breath isoprene [16]. As hypoxia has been shown to negatively influence cholesterol metabolism, the observation of decreased breath isoprene in hypoxic individuals is a plausible hypothesis for the results obtained [25].
The observation that 2-pentanone and pentanal significantly change in response to hypoxic stress is not novel [2]. However, previous results suggest that 2-pentanone significantly decreased under hypoxic conditions whereas the current study shows an increase in compound abundance. While it is currently unknown why the inversion of 2-pentanone abundance was observed, these results support changes of these compounds have been found among multiple studies suggesting development of targeted analytical assays to better quantitate specific exhaled breath compounds of interest.
Pre-/post-bag analysis shows an increase in exhaled isoprene with a correlation to minimum SpO2 levels achieved and the oxygen concentration used in the recovery from the hypoxic exposure. In evaluating these results, it was observed that 100% O2 recovery gas was provided at a positive pressure (∼2'' H2O) while the 21% O2 was provided at a much lower pressure (similar to on demand). Therefore it is plausible that the effect observed maybe due to changes in respiration induced from recovery gas pressure rather than the O2 concentration itself [13, 26, 27]. This hypothesis is further supported by the increased levels of isoprene observed in breath holding and exercise experiments [11, 12]. However further experimentation utilizing alternative methods for exposure, such as a reduced oxygen breathing environment, will be required to fully investigate this hypothesis.
Conclusion
In conclusion, the results illustrate the dynamic nature of isoprene in the exhaled breath of test subjects during and following acute hypoxic exposures. These data provide support for additional research into the use of exhaled breath for non-invasively monitoring personnel with acute hypoxic exposures. However, due to the dynamic nature of exhaled VOCs, alternative exposure methodologies, such as a mask-off nitrogen tent, and targeted analytical assays must be utilized to fully characterize the exhaled breath dynamics in response to these exposures.
Acknowledgments
Support for this work was provided by UES Inc. under subcontract from the United States Air Force (FA8650-14-D-6516). Opinions, interpretations, conclusions and recommendations are those of the authors and not necessarily endorsed by the United States Government. The authors would like to thank Mr Gregory Sudberry and Ms Tenika Dearmond for their help and scholarly input for this manuscript.