

Abstract
Introduction: Advances in the development of high-resolution metabolomics (HRM) have provided new opportunities for their use in characterizing exposures to environmental air pollutants and air pollution-related disease etiologies. Exposure assessment studies have considered blood, breath, and saliva as biological matrices suitable for measuring responses to air pollution exposures. The current study examines comparability among these three matrices using HRM and explores their potential for measuring mobile-source air toxics. Methods: Four participants provided saliva, exhaled breath concentrate (EBC), and plasma before and after a 2 h road traffic exposure. Samples were analyzed on a Thermo Scientific QExactive MS system in positive electrospray ionization mode and resolution of 70 000 full-width at half-maximum with C18 chromatography. Data were processed using an apLCMS and xMSanalyzer on the R statistical platform. Results: The analysis yielded 7110, 6019, and 7747 reproducible features in plasma, EBC, and saliva, respectively. Correlations were moderate-to-strong (R = 0.41–0.80) across all pairwise comparisons of feature intensity within profiles, with the strongest between EBC and saliva. The associations of mean intensities between matrix pairs were positive and significant, controlling for subject and sampling time effects. Six out of 20 features shared in all three matrices putatively matched a list of known mobile-source air toxics. Conclusions: Plasma, saliva, and EBC have largely comparable metabolic profiles measurable through HRM. These matrices have the potential to be used in identification and measurement of exposures to mobile-source air toxics, though further, targeted study is needed.
Export citation and abstract BibTeX RIS
Introduction
Identifying causal agents associated with traffic-related health effects is made challenging given the complex chemical composition of traffic pollution and numerous biological pathways elicited upon exposure. Recently, some have proposed the study of the 'exposome' [1, 2], a theoretical framework which seeks to broaden the scope and capacity within environmental exposure science that aims to measure lifetime exposures to external chemicals and internal endpoints. Moreover, this framework is based upon approaches that link exposure assessment to mechanistic insights linking both exposure and response [3–5]. A key aim of the burgeoning field of environmental metabolomics is the development and validation of analytical platforms to support exposome-related research.
High-resolution metabolomics (HRM) allows for the identification and quantitation of small molecules via high-throughput, high-yield analytical chemistry and bioinformatics. HRM may serve as an ideal tool for conducting exposure assessment of complex external and internal stressors. The use of HRM within traditional environmental epidemiologic settings has been limited, but growing. Previous studies have used metabolomic approaches to characterize high and low exposure to polycyclic aromatic hydrocarbons (PAHs) or metals, as well as differential perturbations in metabolism, between high and low exposure cohorts [6–10].
Traditional exposure assessment methods have experienced difficulty in identifying the specific compounds, compound classes, or non-chemical exposures of traffic-related pollution (TRP) that are primarily driving human health response. However, the toxic effects of exposure to airborne total particulate matter (PM) from primary TRP have been demonstrated [11–14]. These toxic effects range from increased short-term morbidity in individuals with preexisting respiratory and cardiovascular disease to excess mortality rates over life-long exposure durations [15, 16]. Given the extreme chemical and physical heterogeneity of TRP, however, it is not clear which components or mixtures are most responsible for driving the observed adverse responses [17–20], nor which specific biological pathways contribute to PM-specific disease etiology [20–25]. Metabolomics may provide much needed insight into these gaps that traditional exposure assessments conducted to date have been unable to address.
As an initial step, understanding how metabolomic profiles vary by biological matrices in the same individuals may inform future study designs in this exposure science subfield. Non-invasive sampling of exhaled breath (EBC) [12, 26] and saliva [27] may serve as viable alternatives to more invasive blood sampling. Comparative metabolomic profiling across the plasma, EBC, and saliva matrices may assist with the identification of the most relevant components of PM exposure for health. To date, studies of HRM and human health have mainly considered human blood and urine. Relatively few studies have been conducted on saliva or EBC using HRM, with even fewer examining metabolomic profiles across multiple biological matrices simultaneously [28–33]. Another question of longitudinal changes of profiles remains as few studies have examined daily changes in metabolomic profiles for humans [34–39]. The paucity in the literature of HRM profile comparability for these three matrices is an opportunity to examine their utility for air pollution epidemiology.
To address these questions, a pilot commuter study was conducted in which plasma, EBC, and saliva were collected for a small set of participants. The overarching aims of this pilot study were to (a) assess feasibility of conducting metabolomics analyses on these three matrices using a novel, powerful HRM platform; (b) compare metabolomic profiles in plasma samples with those in the two, non-invasively collected matrices, saliva and EBC; and (c) assess whether the metabolomics platform we used has the potential to identify features expected to be associated with exposure to TRP, specifically.
Methods
The current analysis used data collected as a pilot field study, nested within two larger panel studies of daily car commuters in Atlanta, GA [40–42]. To conduct this pilot study, we recruited a convenience sample of four participants, who provided repeated samples of venous blood, EBC, and saliva over a multi-day period. These participants lived within 5 miles of the study site, and refrained from highway traffic exposures over the weekend preceding sample collection. To mirror the larger commuter study designs, the pilot sampling was conducted before and after a 2 h commute during morning rush hour over prescribed, predominantly highway routes. This study was approved by the Emory Institutional Review Board as part of the larger Atlanta Commuters Exposures Study.
The pilot study protocol comprised four repeated measures of biological samples for four participants. Two sample collections were conducted on the first day (Day 0), a Monday; one pre-commute session at 7AM, and one immediately following the commute at 10AM. The subsequent sampling times occurred at 11AM on both +1 and +2 days. The design permitted careful control of exposure and follow-up with a small panel of participants with the expectation of producing thousands of measurements of chemicals within samples at every time point.
Biological sampling
For each subject, sampling sessions included whole blood collection, passive saliva, and EBC collection [41]. Briefly, venous blood was collected in 3 ml, ethylenediaminetetraacetic acid-treated (EDTA) tubes (BD Vacutainer) from either the left or right median cubital vein and centrifuged immediately for plasma retrieval. Saliva was collected passively, meaning it was not spit or expectorated but allowed to pool, into sterile 15 ml conical centrifuge tubes (Falcon) held against the lips. Rtubes (Respiratory Research), disposable exhaled breath condensers, were used to collect roughly ∼2 ml of EBC. Biological samples from each matrix were aliquoted into microcentrifuge tubes and stored at −80 °C within 20 min of collection. Metabolomic analyses were conducted within four months of collection.
Metabolomics and data processing
Analytical chemistry was performed following procedures developed by Soltow et al [43]. For each sample, 65 μL were diluted into 130 μL of acetonitrile spiked with 14 stable isotopic standards [43]. After a 30 min equilibration on ice and protein precipitation, triplicate 10 μL aliquots were placed into separate autoinjector vials and run across two batches through a C18 reverse phase liquid chromatography coupled with high-resolution mass spectrometry (HR-MS) on a QExactive (Thermo Scientific) [43]. The analytical platform allows both positive and negative electrospray ionization (ESI), providing two, distinct runs per replicate. For this analysis, we focused only on positive phase features from positive ESI, since a greater number of features for this phase have been validated and annotated using spectral information available in the Human Metabolome Database (HMDB).
Raw mass spectra output from the analytical platform are processed to extract features, which represent individual ions detected from the mass spectrometer. Each feature is indicated by a unique combination of its mass-to-charge ratio (m/z) and retention time (RT). The relative concentration of a given feature within a replicate is indicated by the integrated ion intensity. Notably, we use the term 'feature' as distinct from the term 'metabolite', which would be the amalgamation of isotope and adduct peaks that correspond to a single, identifiable compound.
Feature extraction was performed using two, integrated algorithms developed by the Emory University Clinical Biomarkers Laboratory (clinicalmetabolomics.org), a research center integrating expertise in metabolomics and informatics. The two algorithms were the adaptive processing of liquid chromatography mass spectrometry (apLCMS, v. 6.0.1) and the xMSanalyzer (v. 2.0.6.1) packages, which were developed for use in R (v. 3.0.1) [44, 45]. The apLCMS program was run in 'hybrid' mode, which allowed us to input information related to known metabolite masses and, thus, improve extraction efficiency of those potential metabolites from chromatograms [46]. The list of known metabolites was comprised of monoisotopic masses from HMDB (v. 3.6) and the US Environmental Protection Agency's Master List of Compounds Emitted by Mobile Sources. The xMSanalyzer package then modifies the resulting data from apLCMS for quality and reproducibility, including cut-offs for triplicate coefficients of variation, triplicate correlations, prevalence across biological samples (supplemental table 1, available online at stacks.iop.org/JBR/12/016008/mmedia). Complete feature extraction and data processing were done separately for each biological matrix in order to reduce noise introduced by mixing sample types. This resulted in three distinct feature tables for each sample type: plasma, EBC, and saliva.
The feature tables were pre-processed following Soltow et al [43]. Briefly, the ion intensities in each of the feature tables were log2 transformed after the addition of 1 to all intensities, including zeroes. The zeros resulting from log2 transformation were set to missing for downstream analysis. Triplicate intensity values for a feature within a biological sample were averaged, with missing values ignored, to produce the final feature tables for statistical analysis. Metabolite levels of select features were generated using reference standardization and compared to previously published ranges [47].
Statistical analysis
Statistical analyses were conducted in R (v.3.1.3). To evaluate the overall associations among the biological matrices, three key data subsets were sequentially examined: (1) all features detected in a biological matrix ('All'); (2) a subset of features measured with low triplicate variability in intensity (i.e. <10% median coefficient of variation) ('<10% CoV'); and (3) a subset of features with masses that matched compounds in the USEPA Master List of Compounds Emitted by Mobile Sources ('EPA-matched'). Feature counts across matrices were compared, descriptively in Venn diagrams using functions provided in 'xMSanalyzer.'
For this analysis, a shared feature across matrix pairs was defined as a feature with an m/z within 10 ppm and a retention time within 300 s of a feature in another matrix. Only shared features between matrix pairs were used for subsequent analyses, similar to the inter-biofluid analysis performed by Pinto et al [32].
Scatterplots of 'All' shared features across matrix pairs provided a visual assessment of the joint distributions of mean feature intensities across subjects at the pre-exposure sampling. Correlations between matrix pairs of mean feature intensities at each sampling time were examined using Spearman's rank correlation analysis (rS), with confidence intervals estimated using the Fisher transformation [48].
To examine the impacts of subjects and sampling time on the association of average intensities across matrix pairs, linear regression was used on the EPA-matched subset. Bivariate analyses were conducted to assess the association between subject or sampling time variables and feature intensity in a given matrix. The analysis focused on this subset because its members were features potentially representing TRP. The model constructed examined associations of a feature intensity in one biological matrix (Xijk) to the m/z and RT-matched feature intensity in another (Yijk). For subject i, at sampling time j, the association between features k can be expressed in the regression:
where Zi =  and Wj =
The variables, Zi and Wj, were subject and sampling time identifiers. Here, μ is the mean intensity of the referent group (subject 1 at pre-exposure) and εijk, the residual error, is normally distributed around 0. The association between the feature intensity in matrix Xijk and feature intensity in Yijk is denoted by α. The coefficients β and γ represent the offsets to μ of the referent group. The model was run separately for each pair of matrices: 'EBC = plasma', 'saliva = plasma', and 'saliva = EBC'. Both the predictor and dependent variables were log2-transformed. A secondary analysis was conducted to explore the range of intensities in the sample population. The variability of specific features in the EPA-matched subset may have differential influence on observed associations and were examined using scatterplots (supplementary figure 1).
Annotation of shared, EPA-matched compounds
Feature annotation is the process in which a putative identification of a feature can be made through mass querying online chemical databases like the HMDB. In this pilot study, the EPA-matched subset provided an opportunity to compare identifications with HMDB and ChemSpider, a comprehensive, chemical structure database curated from roughly 500 sources, to evaluate the feature annotation process and needs for use in environmental epidemiological applications.
Since full validation, using tandem MS approaches, was beyond the scope of this pilot analysis, we conducted a manual annotation of the metabolomics output on those features from the 'EPA-matched' subset shared across all three matrices without multiple-matches (N = 20) using HMDB and ChemSpider [49]. First, the m/z ratios from the 20 features were used to calculate computed masses using only proton adducts and queried in HMDB. If a mass-match was successful, a comparison was made between the compound entry or entries in HMDB and compound identification provided in the USEPA Master List. The number of compound matches that overlapped, if any, was recorded. Secondly, entries from HMDB and the USEPA Master List were compared qualitatively. For example, if an entry in HMDB was detected, quantified, and validated as an endogenous metabolite, then this was determined to be a better identification than a dissimilar compound match with the Master List. However, if no match was found in HMDB, the putative identification using the Master List was used to search ChemSpider. The purpose of this step was to examine other potential sources for exposures. If the putative identification is for a compound shared in other potential exposures, such as consumer products or foods, it was no longer considered a putative TRP-related feature.
Results
We successfully retrieved 14 of 16 plasma, 15 of 16 EBC, and 16 of 16 saliva samples across a three-day sampling period across all participants. Participant metabolic characteristics, derived from the metabolomics analysis of plasma, at baseline, were comparable to or within a range of previously reported values for selected features (table 1) [50]. In total, raw feature extractions yielded unique 9377–10 583 features in both plasma and saliva, and 7688–8565 features in EBC. After summarization and data cleaning, 7110, 6019, and 7747 features were measured in plasma, EBC, and saliva, respectively. The median coefficients of variation across triplicates of samples within each biological matrix was less than 15% (plasma: 13.5%, EBC: 14.3%, and saliva: 13.2%). Saliva had the largest number of unique features (N = 4227) compared to EBC (N = 2381) or plasma (N = 3718). Most identified features in EBC (60.5%) were also found in the other matrices (figure 1). Generally, associations between metabolomic profiles from matrix pairs were consistent across repeated measures and across subjects.
Table 1. Participant characteristics and metabolite levels* from plasma metabolomics.
| Pre-exp | Comb. post-exp | Accardi et al | HMDB | |
|---|---|---|---|---|
| Female (%) | 25 | — | — | — |
| Age (Range) | 29–46 | — | — | — |
| Health indicators | ||||
| Glucose (mM) | 2.6 ± 0.02 | 2.5 ± 0.06 | 6.3 ± 3 | 3.9–6.1 |
| Creatinine | 76 ± 0.8 | 76 ± 0.8 | 85 ± 15 | 56–108.8 |
| Amino acids | ||||
| Phenylalanine | 81 ± 0.6 | 78 ± 0.6 | 142 ± 22 | 48–189 |
| Methionine | 30 ± 0.5 | 30 ± 0.4 | 21 ± 10 | 22–46 |
| Exogenous chemical | ||||
| Benzoic acid | 18 ± 0.3 | 19 ± 0.4 | 4 ± 0.6 | 8.1–145.3 |
*Metabolite matching from reference standardization. Values are presented as mean ± SD or ranges. All metabolite levels are in μM concentrations, unless noted otherwise.
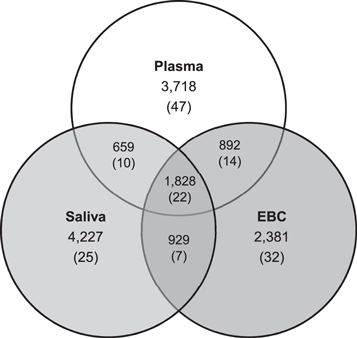
Figure 1. Venn diagram of feature counts. Counts are from features detected at any sampling time. Features in one matrix were matched to features in another if they were within 10 ppm of their respective m/z and within 30 s of retention time. The numbers in parentheses indicate the counts of features from the USEPA Master List of Mobile Source Air Toxics.
Download figure:
Standard image High-resolution imageBetween matrix scatterplots among 'All' features showed positive linear relationships between paired matrices with at least one subject having measurable concentrations in both matrices (N = 1862–2039) (figure 2). When examining 'All' shared features identified at each of the sampling periods, correlations between EBC and plasma ranged from 0.51 to 0.58 across all four sampling time points (p-value < 0.0001, for all pairwise correlations) (figure 3). EBC–plasma correlations were comparable, albeit slightly stronger (rS = 0.56–0.65; p < 0.0001), for those features measured with greater confidence (i.e. '< 10% CoV') (N = 674–861). EBC–plasma correlations involving the subset of features within the 'EPA-matched' subset, ranged between 0.41 and 0.52 (p < 0.0001), across the various sampling time points. Saliva–plasma and saliva–EBC pairwise correlations were also positive and moderate-to-strong across all data subsets (rS = 0.51–0.69; p < 0.0001 and 0.60–0.80; p < 0.0001, respectively). The estimates of the correlation for EBC–saliva were stronger across all subsets ('All': ρ = 0.60–0.66; '<10% CoV': 0.72–0.80; 'EPA-matched': 0.66–0.79).
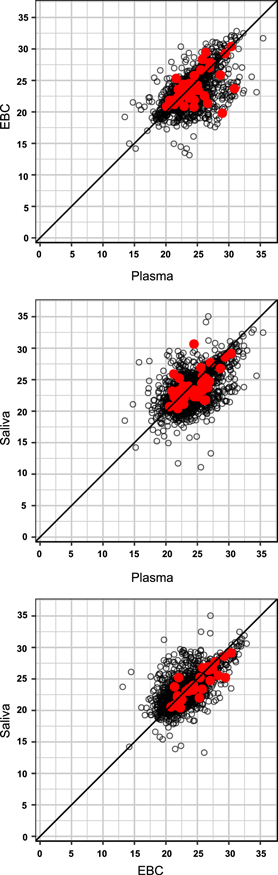
Figure 2. Scatterplots of mean intensities of shared features across subjects between matrix pairs at the pre-exposure sampling time. Red dots indicate those features that also match the Master List of Mobile Source Air Toxics. Sample sizes (from top to bottom) range from 1862, 2039, and 1875 features for plasma–EBC, plasma–saliva, and EBC–saliva, respectively.
Download figure:
Standard image High-resolution image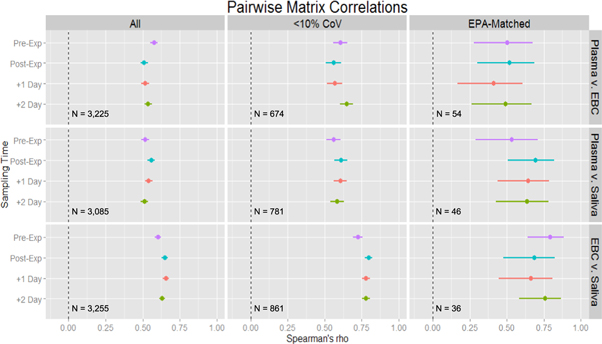
Figure 3. Estimates of Spearman's rank correlations between matrices stratified by time. Three sets of data were considered in turn. The All set (far left) is the complete list of shared, reproducible features. The <10% CoV set (middle) is a subset of All with a very high standard for chemical measurement. The EPA-matched (far right) is the subset of features that match the Master List of Mobile Source Air Toxics. All feature matching here was within m/z of 10 ppm and RT of 300 s.
Download figure:
Standard image High-resolution image
Generally, correlation patterns across all repeated measure sampling time points were consistent within each pairwise matrix comparison and data subset and did not vary by more than 13%. In the examination of the features matching the USEPA Master List ('EPA-matched'), the correlations varied from 16% in saliva–EBC to 23% in plasma–saliva. The greater variation in correlation estimates may be explained by the relatively small number of features being compared (N = 36–54).
Linear regression for the 'EPA-matched' subset demonstrated that the mean feature intensities did not vary by subject or sampling time when examining bivariate associations (subject: β = −0.55–0.08, p < 0.07–0.92). This finding was also true across different sampling time points (sampling time: β =−0.37–0.15, p < 0.09–0.86). Multiple linear regression echoed this as well, with the exception of +1 day sampling time in the EBC–plasma model. The feature intensities in EBC were significantly reduced (β(SE): −0.66 (0.30)) at the +1 day time point relative to the pre-exposure measurement holding plasma intensity and subject constant. Strengths of associations between matrix pairs across all three models were positive and statistically significant (p < 0.0001) (table 2). For example, a 10% increase in the geometric mean of feature intensities in plasma corresponded to a 6.0% increase in the geometric mean intensities in EBC. The same increase (10%) in plasma or EBC was associated with a corresponding 7.7% and 7.4% increase in saliva for models 2 and 3, respectively.
Table 2. Regression estimates of associations in the EPA-matched subset.
| Plasma | Plasma–EBC | EBC | Plasma–saliva | Saliva | EBC–saliva | |
|---|---|---|---|---|---|---|
| X v. Y | Bivariate | Full | Bivariate | Full | Bivariate | Full |
| N | 413 | 318 | 240 | |||
| Coefficients (SE) | ||||||
| α | — | 0.60 (0.04)** | — | 0.77 (0.04)** | — | 0.74 (0.04)** |
| β | −0.46–0.02 (0.18–0.33) | −0.28–0.15 (0.25–0.58)* | −0.52–0.08 (0.20–0.33) | −0.08–0.42 (0.24–0.25) | −0.55–0.13 (0.23–0.31) | −0.08–−0.06 (0.27–0.27) |
| γ | 0.10–0.15 (0.20–0.20) | −0.66–−0.43 (0.29–0.30) | −0.37–−0.04 (0.23–0.23) | −0.53–−0.34 (0.28–0.28) | −0.22–−0.15 (0.25–0.25) | −0.19–0.22 (0.31–0.32) |
SE = standard error; * = p < 0.05; ** = p < 0.001; α is the coefficient for Xij; factor coefficients, β and γ, are ranges of coefficients and SE across levels for subject and sampling time, respectively; significance for range indicates at least one level was statistically significant.
Highlighting the EPA-matched subset permitted an examination of feature annotation. Of features that were found in all three matrices (N = 20), only eight uniquely matched the curated Master List of Compounds Emitted from Mobile Sources and were not found in HMDB (table 3). These features present new, putative identifications found in plasma, EBC, and saliva and are less likely features of endogenous metabolism. A ninth feature, matching the USEPA Master List as n-nitrosomorpholine, had two matches to drug metabolites in HMDB which are unlikely in our healthy population. Three of these features, putatively identified as n-nitrosodiethylamine, n-nitrosomorpholine, and C29H50 (i.e. 30-normoretane), had high relative concentrations across all matrices. Further examination of the usage of the eight compounds, using ChemSpider as the source, suggested that three of them may be from exposure to consumer hygiene or food products.
Table 3. Putative annotation of EPA-matched features shared in plasma, EBC, and saliva.
| Plasma | EBC | Saliva | ||||||||
|---|---|---|---|---|---|---|---|---|---|---|
| # | m/z | RT | m/z | RT | m/z | RT | #HMDB/ #EPA | Overlap | Putative EPA compound name/ formula [CAS RN] | Poss. TRP? |
| 1 | 101.0714 | 63.7508 | 101.0715 | 63.6356 | 101.0715 | 55.4801 | 2/1 | 100% | n-nitrosopyrrolidine [930-55-2] | N |
| 2 | 103.0871 | 40.9973 | 103.0871 | 65.5280 | 103.0871 | 41.0064 | 0/1 | 0% | n-nitrosodiethylamine [55-18-5] | Y |
| 3 | 111.1174 | 566.4460 | 111.1174 | 567.9528 | 111.1174 | 551.2129 | 5/4 | 0% | C8H14/C9H20 (i.e., octyne) | N |
| 4 | 115.0870 | 64.3534 | 115.0870 | 85.3724 | 115.0870 | 84.4289 | 2/1 | 0% | n-nitrosopiperidine [100-75-4] | N |
| 5 | 117.0663 | 50.9270 | 117.0662 | 58.1568 | 117.0662 | 59.8724 | 2/1 | 0% | n-nitrosomorpholine [59-89-2] | Y |
| 6 | 119.0495 | 92.0831 | 119.0495 | 74.8689 | 119.0495 | 92.1704 | 4/1 | 100% | 2,3-benzofuran [271-89-6] | N |
| 7 | 121.0640 | 44.0034 | 121.0643 | 63.3738 | 121.0644 | 69.9346 | 8/7 | 100% | C8H8O (i.e., methylbenzaldehyde) | N |
| 8 | 122.9249 | 80.5810 | 122.9248 | 73.0977 | 122.9248 | 69.6379 | 0/1 | 0% | Tin [7440-31-5] | Y |
| 9 | 123.0795 | 75.2479 | 123.0794 | 70.5669 | 123.0794 | 70.3230 | 11/3 | 66% | C8H10O (i.e., 2,3-dimethylphenol) | N |
| 10 | 129.1277 | 490.6521 | 129.1277 | 462.2666 | 129.1277 | 489.3781 | 19/1 | 100% | octanal [124-13-0] | N |
| 11 | 149.1328 | 32.9848 | 149.1329 | 26.4474 | 149.1331 | 16.8234 | 3/12 | 17% | C11H16 (i.e., pentylbenzene) | N |
| 12 | 151.1118 | 525.9616 | 151.1119 | 534.2908 | 151.1119 | 516.0162 | 28/1 | 0% | 2,3,5,6-tetramethylphenol [527-35-5] | N |
| 13 | 154.8806 | 83.0172 | 154.8806 | 69.3365 | 154.8806 | 66.7111 | 0/1 | 0% | carbon tetrachloride [56-23-5] | N |
| 14 | 185.0414 | 111.3406 | 185.0411 | 113.1992 | 185.0410 | 111.7597 | 0/1 | 0% | dibenzothiophene [132-65-0] | Y |
| 15 | 201.1855 | 550.7727 | 201.1856 | 543.2826 | 201.1854 | 544.6137 | 13/1 | 100% | lauric acid [143-07-7] | N |
| 16 | 223.0639 | 531.9464 | 223.0640 | 514.3256 | 223.0640 | 526.9002 | 4/1 | 0% | hexamethylcyclotrisiloxane [541-05-9] | N |
| 17 | 235.0572 | 116.1874 | 235.0585 | 101.9014 | 235.0571 | 111.0235 | 0/1 | 0% | benzonaphthothiophene [195-52-8] | Y |
| 18 | 266.8493 | 66.2241 | 266.8495 | 79.2979 | 266.8493 | 69.4841 | 0/1 | 0% | pentachlorophenol [87-86-5] | N |
| 19 | 297.0828 | 561.6014 | 297.0832 | 560.7830 | 297.0827 | 560.1216 | 0/1 | 0% | octamethylcyclotetrasiloxane [556-67-2] | N |
| 20 | 399.3951 | 33.7569 | 399.3953 | 37.7646 | 399.3954 | 35.3767 | 0/3 | 0% | C29H50 (i.e., 30-normoretane) | Y |
Discussion
Comparison of feature information across multiple biological matrices is a critical initial step towards evaluating HRM's usefulness as a sensitive, less invasive method for exposure assessment. A number of studies have previously compared metabolite features measured across matrices sampled from the same persons [30, 32, 33, 51–56]. To our knowledge, however, the results from this pilot study are among the first to examine matrix comparability between plasma (relatively invasive) and saliva or EBC (non-invasive) using this measurement method. Our data showed moderate-to-strong associations among extracted features in each of the three matrices, with the strongest association between features in EBC and saliva. These results provide general support for the use of HRM to measure metabolic profiles in matrices collected non-invasively, specifically in EBC and saliva. The number of shared features as well as the between matrix associations among these shared features suggest that either saliva or EBC may also be comparable to plasma.
Importantly, using our bioinformatics platform for metabolomics, we were able to extract a greater number of features than previous investigations [45]. In addition, the use of xMSanalyzer and apLCMS yielded thousands of reproducible features in each matrix, with a majority of features shared across matrices. Although saliva had the greatest absolute number of individual features extracted, EBC shared a larger proportion of detected features than either plasma or saliva.
Generally, we observed strong associations between the mean feature intensities in plasma and corresponding intensities in both EBC and saliva. As indicated by the results from the linear models, these associations were not driven by individual subject effects nor sampling time points. The lack of significant subject effect is contrary to a previous repeated measures study of metabolomics [57]. A possible alternative explanation may be that the sample size of our study does not reflect the true heterogeneity of metabolomes in larger populations. However, intensities of shared features between matrix pairs showed pronounced linearity in their relationships to each other in the scatterplots. Do et al reported that 93.5% of total between-fluid correlations of plasma and saliva matched to the same biochemically-valid networks conferring confidence in annotation, but the average of the significant, partial correlations reported (N = 14 metabolites) was very weak between the same metabolites (r = 0.06) [30]. Our results, with respect to plasma and saliva, show a moderate correlation among feature intensities between the matrices. The difference in interpretation of the association, aside from differing statistical methods, is likely attributable to the authors' exclusion of unknown, unannotated features.
In our results, the relative strength of association was similar regardless of the data subset analyzed, suggesting that the cross-matrix correlation patterns were not merely driven by features that were more reliably measured or identifiable (figure 3). Our regression modeling results using the 'EPA-matched' subset supported these findings, indicating positive and significant associations of mean intensities between matrices that did not vary by subject or time, appreciably. These associations echoed the patterns of correlations between biological matrices in the 'All' and '<10% CoV' subsets. These results provide promising initial support for the use of our environmental metabolomics platform for the robust detection of compounds that may be associated with potential environmental sources.
Previous studies that have examined within- and between-person variability in metabolomic profiles across a variety of analytical platforms and matrices have found that the measured metabolites had much less within-person than between-person sources of variability [58–60]. In contrast, our profiling indicated negligible differences when comparing the mean feature intensities between persons. This finding is consistent with Crews et al, and suggests that a large set of features from metabolomic profiles with greater intensities do not exhibit substantial daily variability within a multi-day sampling protocol [61]. It is worth emphasizing that, although metabolomic profiles overall may exhibit low between-person variability in healthy persons, certain features do have greater between-person variability. In Crews et al, features with high integrated intensities (>106) clustered with CoVs less than 20% across biological samples in plasma. Our secondary analysis shows that some features within the EPA-matched subset have very little variation while others exhibit broad ranges of intensity values. Metabolomic analyses of low intensity features may be liable to greater inter-individual variability. This may be true, for example, in an assessment targeting features indicative of an exposure to an environmental contaminant, which would likely result in relatively low intensity values compared to endogenous metabolism [62].
The moderate correlations (rS ≈ 0.5 to 0.6) between EBC and saliva intensities from the 'All' subset were somewhat unexpected. de Laurentiis et al reported dissimilar spectral profiles between EBC and saliva in samples of healthy subjects and patients with airway disease, suggesting the composition of measurable compounds between the two matrices are different when using nuclear magnetic resonance spectrometry (NMR) [29]. Our results, using mass spectrometry, may support this as many more features were found in saliva than in EBC. Also, our correlation findings show that EBC samples may reflect a large portion of features in both saliva and plasma, and that the metabolomic profiles of EBC were more strongly correlated with saliva. For this protocol, we collected unstimulated, passive saliva, known to mostly be generated from the submandibular glands, but still comprising a mixture of saliva produced from the parotid and sublingual glands [63]. The marginally greater number of features measured in saliva may reflect unique microbial signatures. Previous studies on the salivary metabolome have reported the presence of both endogenous and microbial signatures within this matrix [64]. This interpretation should be viewed cautiously, however, since we were not able to discern metabolites generated from human or microbial metabolism for lack of specificity in putative identification. While definitive validation methods, such as tandem MS approaches (MS/MS), were beyond the scope of this pilot analysis, future targeted analyses including formal feature validation may help discern specific contributions from microbial as well as other sources.
It is possible that the strength of the saliva–EBC association may be explained, in part, by salivary contamination of EBC. When examining immunological markers, however, previous studies have found a negligible influence of salivary concentrations on EBC concentrations [65]. Despite this, our metabolomic analysis captures a much larger chemical space than the more limited immunological markers examined previously. In two recent studies of oral and lung microbiota, the taxonomic composition of oral washes and broncheoalveolar lavage were reported to be mostly similar, though still different in specific, lower-abundance taxa by sampling location [66, 67]. These samples, at least partially, were collected from similar physiological locations we sampled through our passive saliva and exhaled breath. The microbiota occupying these similar locations may produce shared metabolites contributing to the observed correlations between EBC and saliva, relative to correlations between either of these matrices with plasma.
Another key finding from this analysis was the consistent strength of association of the four sampling time points over the span of three consecutive sampling days. This finding suggests observed associations between the metabolomic profiles in this pilot study were generally not time-varying over this duration. The striking consistency in the strengths of associations across time also supports our conclusion that these results were not spurious and driven by artifacts in the data analysis plan. However, the result should not be interpreted to mean that the profiles themselves are time-invariant. Ang et al found both time-invariant and time-variant metabolites in pooled samples [57]. Their study suggests that the selection of metabolites from a total metabolic profile may warrant special consideration depending on their respective temporal characteristics. Our study had repeated samples at nearly the same time of day from healthy individuals, which may explain the robustness of the associations over time.
Although correlations were typically strong among a broad suite of metabolites, without conducting intensive validation, it is unclear whether these were primarily abundant metabolites associated with common metabolic processes, which would not be expected to exhibit daily fluctuation or variability. In a secondary analysis, we examined the range of intensities across all subjects and sampling times of the EPA-matched features. Some metabolites had consistent measures across the study period, while others were far more variable. From our feature annotation, we found that the 20 metabolites identified from the EPA-matched subset were more likely to be features associated with endogenous metabolism, a food chemical, or consumer product exposure. However, six features, detected in all samples and matrices, were exclusively identified using the USEPA mobile-source metabolite list. This may indicate an environmental origin and suggests, albeit non-validated, that the current metabolomics platform detected features that are potentially from exposure to TRP. This conclusion should be viewed cautiously as the utility of mass-matching of high-resolution masses is limited by the comprehensive capture of the annotation databases used. It may be possible that these features are truly unrelated to TRP exposures, and that HMDB has yet to identify these with as great reliability as other compounds. Our comparative approach for identifying metabolites of interest does not replace formal validation procedures, such as tandem MS; it does provide a relatively quick and inexpensive means of leveraging available information about the identity and sources of several thousand features.
One limitation of the analysis is that the matches were identified strictly through a search of proton adducts to a parent compound ion. For example, our putative annotation of tin as a feature in all three matrices is an unlikely candidate using our LC ESI+ chemical analysis. As our samples were diluted in acetonitrile, there is a high likelihood of acetonitrile, sodium, and potassium adducts, which complicate database annotation by providing many more matches to a single mass-to-charge ratio. Until tools are available to utilize data structure, correlations, and expectations of presence in various biological matrices, simple mass-matching will continue to be a challenge for environmental metabolomics when environmental data is still poorly represented in available public datasets.
There are numerous caveats in interpreting the findings from this analysis. Most notably is the sample size, which was conducted on a non-random convenient sample of four subjects. Similar sample sizes, however, are not unprecedented in metabolomics analyses [61]. To offset noise and potential confounding from uncontrolled factors associated with field-based observational designs involving multiple subjects, we elected to enroll four subjects, who were carefully monitored and followed during their participation in the study protocol. This degree of monitoring would not have been possible given a larger number of participants in a pilot study. Additionally, the purpose of the pilot study was to compare the metabolomic profiling of three distinct matrices, which requires, primarily, a sufficient number of features measured in the participants. The use of apLCMS and xMSanalyzer produced measurements of 6000–8000 features from HRM, providing more than adequate power to detect differences among the matrices. Despite this, although the model results showed that the strength of the associations did not vary by subject, given the limited number of observations, it is not possible to generalize these findings to a broader population.
Relatedly, although not a traditional limitation, there may be a concern of noise retained from untargeted metabolomics approaches. Standard, targeted metabolomics practices often subtract signals from laboratory blanks to remove background signals. This approach is a gold standard when the targets of the analysis, the research question, are known and quantifiable. In untargeted or hybrid metabolomics approaches, such as those used in this study, a blank correction is inappropriate, especially when measuring low intensity features representing ubiquitous environmental exposures. This is compensated for through the use of advanced bioinformatics methods, quality controls, isotopic standards, and an HRM platform in tandem [3, 68]. Thus, noise is dramatically reduced in the final feature tables used in the analyses here without the explicit and overly conservative removal of signals.
To further address the issues of sample size and generalizability to other study populations, we repeated a similar analysis, using an identical sample collection and metabolic analysis protocol, examining linear correlations between plasma and saliva metabolites in a cohort of 54 college-aged students. EBC was not collected as part of this specific protocol. In this analysis (results not shown), we found comparable correlations in the subset of highly-reproducible features (<10% CoV) (rS = 0.59 versus 0.64). While our results are still limited in generalizability to the participants in the study, the general concordance of the current pilot results to those shown in this larger cohort provides some external validation that the pilot study findings were not spurious.
Future work should contribute to the capture of spectral data of those compounds in the Master List of Mobile Source Air Toxics to public annotation databases. The degree of curation in resources such as the Human Metabolome Database provides an invaluable resource for metabolomic analysis, but still lacks in compounds associated with or direct metabolites from environmental exposures. Nevertheless, the access to monoisotopic masses of the mobile-source air toxics list enabled putative matching using a curated list of compounds known to be emitted from mobile sources. The detection of EPA-matched features in all matrices is encouraging for air pollution exposure science, but cannot be determined with computation alone. Only after definitive identification, through targeted MS/MS analysis, of compounds associated with traffic pollution exposure in each matrix can a determination be made on which of plasma, EBC, or saliva is best suited for exposure assessment while minimizing participant burden.
Conclusions
Collectively, we believe this pilot analysis efficiently demonstrated matrix comparability between plasma, saliva, and EBC and the putative detection of several features that may be associated with TRP. Our methodology was successful in retrieving thousands of features and was able to characterize robust, consistent metabolomic profiles across plasma, saliva and EBC. As metabolomic databases become better curated for environmental health applications, analyses in studies such as this will presumably improve. Today, there is much ambiguity in putative matching by accurate mass with respect to mobile-source air toxics. Detection and validation of these compounds in all three matrices will help towards understanding exposure and relevant biological pathways associated with traffic pollution toxicity.
Acknowledgments
The authors would like to acknowledge the support provided by J Kancherla and R Judson from USEPA with procuring monoisotopic mass from the USEPA Master List of Compounds Emitted by Mobile Sources. The presented research was supported by a Clean Air Research Center grant to Emory University and the Georgia Institute of Technology from the US Environmental Protection Agency (USEPA, RD834799) and a pilot award from the Human Exposome Research Center (HERCULES) at Emory University. Shared instrumentation for metabolomics analysis was support through the National Institutes of Health (NIH, OD018006). CL acknowledges additional pre-doctoral support from the Burroughs Wellcome Fund through the Molecules the Mankind Doctoral Pathway at Emory University. RG gratefully acknowledges support by a post-doctoral fellowship from the Environment and Health Fund, Jerusalem, Israel. The content of this publication is solely the responsibility of the authors and does not necessarily represent the official views of the National Institutes of Health or the USEPA. Further, USEPA does not endorse the purchase of any commercial products or services mentioned in the publication.