
Abstract
On-line analysis of exhaled human breath is a growing area in analytical science, for applications such as fast and non-invasive medical diagnosis and monitoring. In this work, we present a novel approach based on ambient ionization of compounds in breath and subsequent real-time mass spectrometric analysis. We introduce a plasma ionization source for this purpose, which has no need for additional gases, is very small, and is easily interfaced with virtually any commercial atmospheric pressure ionization mass spectrometer (API-MS) without major modifications. If an API-MS instrument exists in a laboratory, the cost to implement this technology is only around  500, far less than the investment for a specialized mass spectrometric system designed for volatile organic compounds (VOCs) analysis. In this proof-of-principle study we were able to measure mass spectra of exhaled human breath and found these to be comparable to spectra obtained with other electrospray-based methods. We detected over 100 VOCs, including relevant metabolites like fatty acids, with molecular weights extending up to 340 Da. In addition, we were able to monitor the time-dependent evolution of the peaks and show the enhancement of the metabolism after a meal. We conclude that this approach may complement current methods to analyze breath or other types of vapors, offering an affordable option to upgrade any pre-existing API-MS to a real-time breath analyzer.
Export citation and abstract BibTeX RIS
1. Introduction
Mass spectrometry is an essential analytical tool for chemical analyses in a wide range of fields, including breath research. Traditionally, breath has been sampled as condensate; its head space has been analyzed offline via gas chromatography-mass spectrometry (GC/MS) [1]. This method has been the gold standard for decades, showing an impressive wealth in composition, with hundreds of compounds detected [2]. Moreover, modern GCxGC-MS platforms reveal around 2000 volatile organic compounds (VOCs) in human breath [3].
Whilst the analyte scope of GC-MS is broad, it requires long analysis times, hindering its use to capture transient changes in human breath (e.g. circadian phases). Alternatively, real-time mass spectrometric techniques, mainly proton transfer reaction-mass spectrometry (PTR-MS) [4] and selected ion flow tube-mass spectrometry (SIFT-MS) [5], have paved the way to investigate the dynamics of human volatiles without any sample collection and manipulation. These methods were applied in large breath studies [6, 7] where VOCs like isoprene or acetone and many others have been discovered as disease-related metabolites. SIFT-MS and PTR-MS are commercially available and are able to quantify small molecules (e.g. ethanol) down to the ppbv–pptv range.
An alternative (non-commercial) method to analyze vapors in real time is based on the exposure of neutral vapors to electrosprays of pure solvent at atmospheric pressure and subsequent mass analysis [8–13]. This approach has been dubbed secondary electrospray ionization-mass spectrometry (SESI-MS) [14], and it has been successfully applied to investigate volatile bacterial compounds [15–19] as well as human breath and skin vapors [20–27].
Following this initial idea, we present here a novel approach in which the standard ionization source (i.e. electrospray meant for liquid samples only) of a commercial atmospheric pressure ionization mass spectrometer (API-MS) is substituted by a 'soft' plasma source that creates ions from breath vapors at ambient conditions.
Plasma-based methods are mostly known for their application in elemental analysis, such as inductively coupled plasma (ICP) or glow discharge (GD) mass spectrometry. Beside these high-power and hard ionization sources, there are also soft and low-temperature plasma sources, which use a capacitively coupled plasma. Because of the softer ionization they are interesting for the analysis of organic compounds [28]. Some of these have been developed as ionization sources for liquid sample introduction [29] from, e.g., high performance liquid chromatography (HPLC) and other separation techniques for the analysis of samples under ambient pressure like direct analysis in real-time (DART) or low temperature plasma (LTP) [30]. Because these plasma-based sources are easy to build and maintain due to the fact that there is generally no need for additional gases, and that these sources can be realized in small dimensions, we used in our work this kind of ionization technique.
We selected a dielectric barrier discharge technique, which can be classified as low-frequency capacitively coupled plasma source. More specifically, we developed the active capillary plasma ionization source described by Nudnova et al [31] for the analysis of breath. Via a discharge through a dielectric (quartz capillary) the source produces a plasma, which then ionizes water vapor in the air. In the capillary the H3O+ and OH− produced can then ionize the analytes in a soft way, by proton transfer. Therefore the capillary can be coupled directly to the mass spectrometer, and no special chamber for ionization is necessary because the ionization reaction takes place in the capillary. No reaction gases (besides ambient air) are needed to maintain the plasma. In this proof-of-principle study we show that this technique is suitable for breath analysis and fulfils the basic requirements, including sensitivity, ability to measure in real-time and time-resolved monitoring capabilities.
2. Experimental section
2.1. Human subjects
Three non-smoking volunteers (1 female/2 males) participated in the measurements. The sampling took place before and after lunch (11 a.m., 12 p.m. and 1 p.m.) without special diet and restrictions. Subject A was not present for the 12 p.m. and 1 p.m. measurements. The local ethical committee had previously approved at the measurements (EK 2012-N-25) and all volunteers gave written informed consent to participate.
2.2. Breath sampling
Breath was sampled with a device consisting of an exchangeable mouthpiece with built-in flow resistance, and a T-piece that diverted part of the exhaled air towards a manometer (Traceable, Thermo Fisher Scientific Inc., Waltham, MA, USA) to control the sampling pressure. The main air flow passed a PTFE tube (32 cm length, id 4.9 mm) heated up to approx. 90 °C with heating tape. This tube was then coupled to the ionization source such that the open tube end was approximately 5 mm in the front of the source (figure 1). No direct coupling was necessary but would be possible with an overpressure valve. During the breath sampling procedure, the subjects exhaled their full lung capacity (lasting typically 5–10 s). The exhalation flow rate was controlled by instructing the subjects to breathe with an overpressure of 14 mbar (as read on the manometer), which yields a flow of 4.5 L min−1. Three replicates were performed per measurement. The ambient laboratory air was continuously monitored and only the signals arising above the background level during the exhalations were considered for further analysis.

Figure 1. (a) The breath vapor is sampled with an exchangeable mouthpiece (1) followed by a heated (to approx. 90 °C) PTFE tube ((2) id 4.9 mm, length 32 cm), and directed to the soft plasma ionization source. The breath pressure is controlled during sampling with a manometer. The active capillary plasma ionization source consists of a custom-built rf generator (sine wave generator, audio amplifier and high voltage transformer) and generates a dielectric barrier discharge plasma via two copper electrodes ((3) cap electrode, (4) high voltage electrode). The electrodes are fitted onto a quartz capillary ((5) id 1.0 mm) which is connected to an interface (8) with O-ring (6) and plastic cap (7). The interface is connected to a commercial API mass spectrometer. The breath vapor is sampled with the MS vacuum trough the capillary. (b) Photograph of the ionization source coupled to the mass spectrometer and the heated breath sampling tube delivering the breath sample towards the ionization source. (c) Magnification of the quartz capillary and the electrodes of the ionization source.
Download figure:
Standard image High-resolution image2.3. Soft plasma ionization source
The active capillary plasma source (figure 1) consists of two principal components, the capillary/electrodes with a plastic cover towards the mass spectrometer and the rf-generator. As a capillary, a melting point determination quartz capillary with an inner diameter of 1.0 mm and 1.5 cm length was used. The electrodes were home built and made of copper. The high voltage electrode was in the form of a cylinder and surrounded the capillary in front of the mass spectrometer interface. The grounded cap electrode was inserted into the open end of the capillary. This construction was then fixed to the mass spectrometer's interface with an O-ring and a plastic cap. No other modifications were necessary to couple the source to the MS. The exhaled breath delivered by the sampling tube was sucked into the ionization capillary by the vacuum of the mass spectrometer.
For generating the plasma, a home-built rf-generator was connected to the electrodes. The generator was constructed from a function generator (Function Pulse Generator 8551, Tabor Electronics Inc., Tel Hanan, Israel) which delivered a 10 kHz sine wave, whose output was amplified with an audio amplifier (Stereo Integrated Amplifier SU-V45A, Technics, Panasonic Corp., Kadoma, Osaka, Japan), and finally converted with a home-built HV-transformer to approx. 1.2 kV ac current. The signal amplitude and voltage were monitored with an oscilloscope (9410 Dual 150 MHz, Le Croy, Teledyne Technologies, Thousand Oaks, CA, USA). The power delivered by the function generator was optimized to obtain the highest signal intensity while avoiding an electrical breakdown through the quartz capillary.
2.4. API mass spectrometer
Quadrupole time-of-flight-mass spectrometers are especially well suited for metabolomics studies because of their high resolution capabilities. In this case, we interfaced the plasma source to a commercial API instrument (QTOF Ultima, Micromass/Waters, Milford, Manchester, UK). Except for removing the standard ESI source and the cover of the MS, no modifications were necessary. The measurements were performed in negative ion mode; we observed mostly [M-H]− species.
2.5. Data analysis
The data were acquired and background corrected (i.e. ambient air) with the MassLynx software (V4.0, Waters, Milford, Manchester, UK) and exported into txt files. Afterwards, the data was further processed with MATLAB 2012b (The MathWorks, Natick, MA, USA). First, the mass spectra were resampled (linear interpolation) to have an equal m/z vector per spectrum. The spectra were denoised (via wavelets) and converted into peak lists (centroided data). The intensity threshold was set to 50 counts, leading to 201 features. By further visual inspection the dataset was reduced to a final number of 104 peaks. Subsequent data analysis was done on this reduced dataset. The mass spectra matrix was z-score normalized and subjected to principal component analysis (PCA).
3. Results and discussion
The data shown in figure 2 suggest that this simple approach may indeed be suitable for real-time breath analysis. It shows a mass spectrum each (mean of three replicates) from subjects A, B and C. The spectra are corrected for the presence of ambient air, which is continuously monitored except during the exhalation periods. The spectra are fairly rich, with peaks up to m/z 340, resembling those obtained by SESI-MS [24]. The spectra all show a notable series of deprotonated fatty acids separated 14 Da, showing that the plasma is 'gentle' enough not to promote fragmentation that may complicate spectra interpretation, akin to electrospray. The peaks form two distributions around m/z 140 and m/z 250, which are known as the fatty acids stemming primarily from breath (lower m/z range) [24] and skin (upper m/z range) [23].
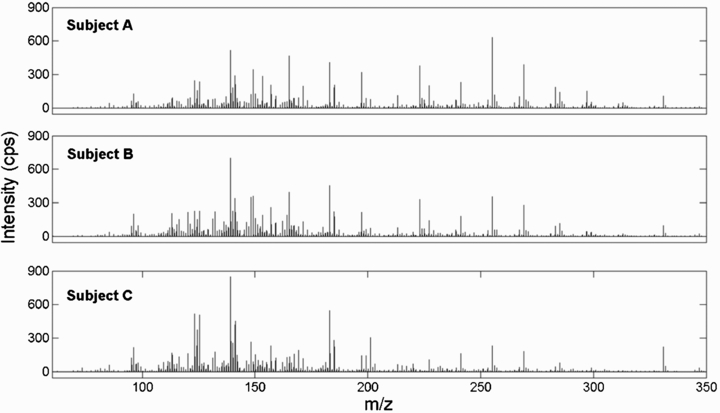
Figure 2. Background corrected breath mass spectra from three subjects A, B and C (mean of three replicates per subject). Intensity differences between equal m/z peaks in the different spectra can be noticed.
Download figure:
Standard image High-resolution imageThe peak patterns and m/z range of the mass spectra are comparable to those measured with SESI-MS. We mainly found peaks of homologues fatty acid series as well as related compounds like 3-hydroxypentanoic acid. While the breath patterns are in general similar among the three subjects, one can notice distinct peak distributions for each subject [26], already by visual inspection.
Real-time analysis has obvious advantages, because it avoids sample manipulation and enables the investigation of transitory processes, for example, due to physical exercise [4]. The method presented here allows for such time-resolved measurements (cycle time of 2.1 s), as illustrated in figure 3. It shows extracted ion currents of some representative breath compounds as function of time. The measurements were conducted at three different times (11 a.m., 12 p.m. and 1 p.m.) during one day. Each subject provided three consecutive replicate exhalations (i.e. breath cycles). As a result, some signals are clearly observable and resolved from each other and the background. The selected signals show intensity differences between the subjects, which is in line with previous studies suggesting high inter-individual variability in breath [26, 32, 33]. Note however that humidity may have an impact in the signal intensities, much in the same way as in SESI-MS [24]. Nonetheless, because the water vapor content in breath (saturated at 37 °C—about 6%) [34] and the pressure along the sampling line (14 mbar) can be assumed as constant for all subjects, it is most reasonable to assign the (relative) differences among the subjects and intra-subjects, to actual differences in breath composition. This pilot study has some limitations: (a) we did not attempt further quantification of the detected species. However, we readily detected a series of fatty acids, which have been found to be in the 100 ppt concentration range in human breath [21]. Further studies are being conducted to assess whether plasma-based ionization sources are more sensitive than electrospray-based techniques. (b) While we allowed more than 30 min between the meal and the last measurement to minimize confounding factors, the contribution of mouth volatiles cannot be totally excluded [35, 36]. We nevertheless considered only the last (i.e. end tidal) fraction of the exhalation for the data analysis.
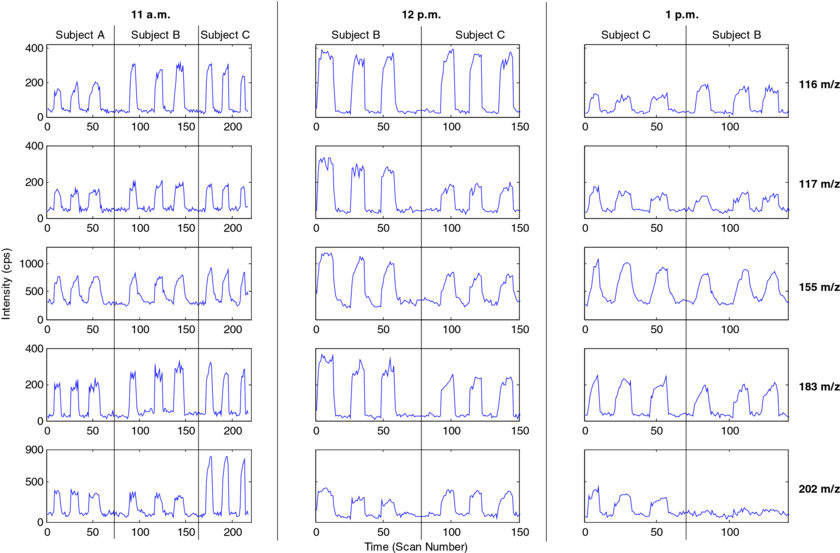
Figure 3. Real-time breath analyses, showing extracted ion time traces of five representative compounds: m/z 116 (unknown), m/z 117 (3-hydroxypentanoic acid), m/z 155 (C9:1), m/z 183 (C11:1) and m/z 202 (unknown). Each subject gave three replicates per time with satisfactory repeatability. The ion currents of the peaks show intensity differences that are characteristic for the subject and the time of day.
Download figure:
Standard image High-resolution imageTo ease visualization of the data, PCA of the mass spectra was performed. In figure 4(a) the projection of the mass spectra from each subject onto a two-dimensional subspace is plotted. The first observation is that the three replicates per measurement tend to cluster together, in line with the good repeatability shown in the extracted ion time traces (figure 3). Secondly, each individual tends to occupy his/her own space, consistent with the known high inter-individual breath variability. It can also be seen that the projections have a time-dependent trend, which is expected and described in the literature. This trend is greatest between 12 p.m. and 1 p.m., which is a hint that the metabolite concentrations are varying significantly. This could be explained by the fact that the subjects had lunch between 12 p.m. and 1 p.m., which is expected to enhance the metabolism. The PC axis 2 seems to deliver information to distinguish between the subjects, while axis 1 seems to contain information more related to the time-dependent evolution of the projections (subject C and partially subject B). Figure 4(b) displays the corresponding loading plots, showing that the feature at 122 m/z (among others) contributes mainly to the temporal evolution. It is visible that many of the observed fatty acids have negative PC1 loadings what is an indication for an intensity enhancement during the temporal evolution. Moreover, the loading plot shows the wealth of compounds that are enhanced and decreased. It can also be said for subject B and C that between 12 a.m. and 1 p.m. an evolution in both PC directions happens, what indicates that compounds related to both PC axes are involved in the time-dependent evolution of the PCA patterns.

Figure 4. (a) Projection of the breath mass spectra from three subjects A (circles), B (squares) and C (triangles) measured at three different times of day (11 a.m. (red), 12 p.m. (blue) and 1 p.m. (black)) with three replicates onto a two dimensional PCA subspace. The breath mass spectra of the different subjects are distinguishable from each other. It is also observable that the projection of each subject changes with time (marked with arrows) and that this change is minor before (11 a.m. to 12 a.m.) and quite significant after lunch (12 p.m. to 1 p.m.). (b) Plot of the principal component axis 1 loadings, showing maximum features at m/z 122 in positive and at m/z 97 and m/z 241 in negative direction. (c) Plot of the m/z intensity differences between 11 a.m. and 1 p.m. for subjects B and C. It can be seen that the subjects mostly have intensity differences with the same sign. In addition the m/z differences can be recognized as individual patterns related to the magnitude of the intensity differences.
Download figure:
Standard image High-resolution image
In figure 4(c) a plot of the intensity differences between the 11 a.m. and 1 p.m. time prints for subjects B and C is shown. As expected from the PC1 loadings, both intensity enhancements and decreases are observable. The intensity changes are characteristic for each subject and could indicate differences related to the metabolite levels of the subjects. In addition it is observable that the intensity changes of signals that are enhanced have a higher magnitude compared to those that are decreased.
Table 1 lists 104 features with possible compound assignments and the PC1 loadings. In addition, table 2 in the online supplementary material (available from stacks.iop.org/JBR/8/027102/mmedia) lists the previous information as well as the subjects and time-related mean peak intensities with relative standard deviations. For subjects B and C, the m/z intensity differences were checked for consistency with the PC1 loadings. Because of the detection in negative ion mode it was assumed that detected all compounds were present as [M-H]− ions. For all peaks, it was checked by MassLynx whether they were related to exhaled breath. Fatty acids from C4:X (X = 0,1) up to C19:0 were found. In addition, compounds like 3-hyroxypentanoic acid were found, which are known the from breath analysis literature. Furthermore many unidentified peaks were found, which shows the need for high-resolution mass spectrometry in combination with MSn to elucidate this wealth of VOCs in exhaled breath. In addition, clear intensity differences between the subjects and a time-dependent intensity increase/decrease can be recognized. Not for all masses showing an enhancement or decreasing behavior (related to PC1 loadings) was the behavior observed for both subjects. For example, the saturated fatty acid C10:0 has a negative PC1 loading indicating enhancement behavior. In contrast, subject B had an intensity decrease from 124 to 77 counts. This could be explained by differences in the metabolome of individuals. In summary subjects B and C show a similar intensity change related to accordance with the PC1 loadings.
Table 1. Peaks found during the PCA analysis. For the identification [M-H]− ions were considered. Possible compounds are assigned. PC1 loadings are shown with additional comparison with a check of the intensity differences. (PC1 rel. int. chg.) PC1 related intensity changes.
| Feature mass m/z | Tentative assignment | PC1 loadings (a.u.) | Feature mass m/z | PC1 loadings assignment | Tentative (a.u.) | Feature mass m/z | Tentative assignment | PC1 loadings (a.u.) |
|---|---|---|---|---|---|---|---|---|
| 85.4 | C4:1 | 0.12 | 139.2 | −0.112 | 198.2 | −0.079 | ||
| 95.2 | −0.122 | 140.2 | −0.12 | 199.2 | C12:0 | 0.086 | ||
| 96.2 | −0.114 | 141.1 | C8:1 | −0.123 | 201.2 | 0.094 | ||
| 97.2 | Methylpentenal | −0.14 | 142.3 | C8:0 | 0.139 | 203.2 | 0.098 | |
| 98.2 | Pyrrolidinecarboxaldehyde | −0.104 | 143.1 | −0.108 | 213.1 | C13:0 | −0.054 | |
| 99.3 | C5:1 | 0.136 | 145.2 | −0.037 | 215.2 | 0.084 | ||
| 101.3 | C5:0 | 0.048 | 146.3 | 0.121 | 217.2 | 0.099 | ||
| 107.3 | 0.108 | 147.3 | 0.105 | 220.2 | −0.045 | |||
| 109.4 | 0.099 | 148.3 | 0.139 | 223.1 | 0.05 | |||
| 111.2 | Octene | −0.07 | 150.2 | 0.132 | 224.1 | 0.047 | ||
| 112.2 | −0.096 | 151.2 | 0.078 | 225 | C14:1 | 0.052 | ||
| 113.2 | C6:1 | −0.084 | 152.3 | 0.137 | 227.2 | C14:0 | −0.076 | |
| 114.2 | −0.06 | 153.2 | −0.098 | 228.2 | −0.099 | |||
| 115.2 | C6:0/3-Methyl-2-oxobutanoic acid | −0.041 | 154.3 | −0.102 | 229.1 | 0.019 | ||
| 116.3 | N-Methyl-α-aminoisobutyric acid | 0.105 | 155.1 | C9:1 | −0.099 | 232.1 | −0.067 | |
| 117.3 | 3-Hydroxypentanoic acid | 0.107 | 157.1 | C9:0 | −0.074 | 239.2 | C15:1 | −0.03 |
| 118.3 | 3-Methylbutanic acid | 0.14 | 159.1 | −0.117 | 241.2 | C15:0 | −0.13 | |
| 120.3 | 0.138 | 162.2 | 0.132 | 242.2 | −0.099 | |||
| 121.3 | 0.089 | 163.2 | 0.119 | 253.2 | C16:1 | −0.118 | ||
| 122.3 | 0.158 | 164.2 | 0.135 | 255.2 | C16:0 | −0.116 | ||
| 123.3 | 0.105 | 165.2 | 0.1 | 256.2 | −0.124 | |||
| 124.3 | 0.099 | 166.2 | 0.116 | 257.1 | 0.055 | |||
| 125.2 | Nonene | −0.077 | 167.2 | 0.105 | 267.1 | C17:1 | −0.038 | |
| 126.3 | 0.136 | 167.3 | 0.093 | 269.1 | C17:0 | −0.055 | ||
| 127.2 | C7:1 | −0.015 | 168.2 | 0.126 | 270.1 | −0.073 | ||
| 128.3 | 0.088 | 169.2 | C10:1 | 0.026 | 271.1 | −0.046 | ||
| 129.3 | C7:0/4-Methyl-2-oxopentanoic acid | 0.011 | 171.3 | C10:0 | −0.056 | 275.1 | −0.027 | |
| 131.3 | 0.151 | 173.3 | 0.029 | 283.1 | C18:0 | −0.042 | ||
| 132.3 | 0.118 | 175.2 | 0.145 | 285.1 | −0.002 | |||
| 133.3 | 0.113 | 180.2 | 0.148 | 286.1 | −0.032 | |||
| 134.3 | 0.118 | 181.2 | 0.061 | 297.1 | C19:0 | −0.013 | ||
| 135.3 | 0.026 | 183 | C11:1 | −0.121 | 299 | 0.013 | ||
| 136.3 | 0.137 | 185 | C11:0 | −0.122 | 331 | −0.095 | ||
| 137.3 | 0.121 | 187.2 | 0.053 | 332 | −0.096 | |||
| 138.2 | 0.112 | 197.2 | C12:1 | −0.096 |
4. Conclusions
We coupled a home-built soft plasma ionization source to a mass spectrometer without major modifications of the interface. We showed that the active capillary plasma ionization is suitable for real-time analysis of exhaled breath with ambient mass spectrometry. The technique is sensitive enough to detect relevant VOCs like fatty acids in the mass range up to m/z 340. In addition, we were able to detect the metabolic pattern differences between three individuals and monitor the time-dependent evolution of these patterns. We showed that several metabolites are enhanced or decreased after food intake. It was observable that the intensity changes are mostly similar for both subjects as far as the sign of the change. In contrast, it was shown that the magnitude of the intensity changes is different from one subject to the other. Summarizing all measurements and data analysis, the analytical results have similarities to SESI-MS and add to other real-time techniques like PTR-MS and SIFT-MS.
Acknowledgments
We thank the test subjects for their study participation. This research was supported by a Marie Curie European Reintegration Grant (PMLS) within the 7th European Community Framework Programme (276860). Christoph Baertschi and René Dreier from ETH mechanical and Heinz Benz from ETH electronic workshops are gratefully acknowledged for their contribution to the prototype development.