

Abstract
The transition away from a fossil-fuel powered economy towards a cleaner production system will create winners and losers in the global trade system. We compile a list of 'brown' traded products whose use is highly likely to decline if the world is to mitigate climate change, and explore which countries are most at risk of seeing their productive capabilities 'stranded'. Using methods from economic geography and complexity, we develop novel measures of transition risk that capture the extent to which countries' export profiles are locked-in to brown products. We show that countries exporting a high number of brown products, especially technologically sophisticated ones, could find it relatively easy to transition. Conversely, countries with exports highly concentrated in a few, low-complexity brown products have much fewer nearby diversification opportunities. Our results suggest that export complexity and diversity play a key role in determining transition risk. Path-breaking diversification strategies are needed to prevent nations from becoming stranded.
Export citation and abstract BibTeX RIS

Original content from this work may be used under the terms of the Creative Commons Attribution 4.0 license. Any further distribution of this work must maintain attribution to the author(s) and the title of the work, journal citation and DOI.
1. Introduction
As the world transitions from dirty to clean energy sources and modes of production, some countries will be affected more than others. Previous research has explored which countries have the know-how, skills and innovative drive that makes them likely leaders in the 'race' towards green competitiveness (Fankhauser et al 2013, Mealy and Teytelboym 2020). However, there has been less work to better understand the characteristics of countries that could get left behind. Are all exporters of 'brown' (or emissions intensive) products likely to face significant transition risk, or are some brown export industries more challenging to transition from than others? While recent literature has studied transition risks to companies (e.g. Bolton and Kacperczyk 2021) and financial systems (e.g. Semieniuk et al 2021), quantitative estimates at the country-level are lacking. This paper fills this gap by estimating the degree to which countries' productive capabilities are 'locked-in' to sectors that are at risk of stranding.
A rich literature in economic geography has shown that industrial development in countries and regions is path dependent (Hausmann and Klinger 2006). Places are more likely to diversify into new activities that are similar to those they already have an advantage in (Hausmann and Klinger 2006, Frenken et al 2007, Hidalgo et al 2007, Neffke et al 2011). This, alongside the fact that exporting more technologically sophisticated products tends to be associated with higher income and growth (Hausmann et al 2007, Hidalgo and Hausmann 2009), has given rise to the 'Smart Specialization Policy' paradigm. The latter emphasizes place-based industrial policy which targets complex new economic activities that are also related to existing regional capabilities, thereby increasing the likelihood of success (Boschma and Gianelle 2013, Balland et al 2019). Path dependency implies that existing productive capabilities are important drivers of countries' ability to seize opportunities emerging in the green economy (Mealy and Teytelboym 2020). It also creates the potential for countries to be locked-in to brown industries, possibly resulting in stranded assets, stranded jobs and the risk of economic decline.
Fossil fuel resources may become effectively worthless as countries around the world take action to mitigate climate change (Caldecott 2015, Cust et al 2017), with significant implications for the companies and countries owning them. While the literature on asset stranding often focuses on carbon lock-in through long-lived physical infrastructure (e.g. Pfeiffer et al 2018, Fisch-Romito et al 2021), a broader definition beyond the risk to fossil fuel companies includes the risks to countries which are heavily dependent on fossil fuel exports, as well as workers whose skills are specific to declining activities (Van Der Ploeg and Rezai 2020). Country-level vulnerability to the transition will be governed both by their exposure to declining sectors, and their flexibility to adapt and change their economic structure accordingly (Zenghelis et al 2018).
Here, we quantify the degree to which countries' productive capabilities are tied up in declining sectors and identify viable transition paths, which is crucial to achieving a just transition. With the exception of Jee and Srivastav (2022), there has been limited research on this issue. Jee and Srivastav (2022) use patent data to show that direct knowledge spillovers between green and brown technologies are limited, but most green patents are connected to a brown patent through two or more degrees of separation. However, the ability of different energy-related inventions to build on one another need not directly translate into the ease with which a country's productive capabilities as a whole may transition to new activities. Moreover, mitigating transition risk need not require moving into green sectors, but rather moving out of brown ones.
We leverage methods introduced by Hidalgo et al (2007), Hidalgo and Hausmann (2009), and Mealy and Teytelboym (2020) to develop indicators of country-level lock-in to brown sectors and transition opportunities into activities which require similar capabilities. First, we compile a list of traded 'brown' products that are likely to see reduced global demand in a green economy. Drawing on the product space approach developed by Hidalgo et al (2007), we explore transition possibilities out of each brown product, and rank them in terms of their product complexity and transition outlook. While some products like coal or crude oil appear to have relatively limited diversification opportunities, other products such as engines, pumps and hydrocarbon-derived chemicals involve a wider variety of skills, capabilities and factors of production that could be used to diversify into other industries.
We then turn to countries and develop several novel metrics to explore the extent to which countries may be locked-in to brown exports. We show that countries exporting a high number of brown products, especially technologically sophisticated ones, may not only find it relatively easy to transition, but could also position themselves to play a key role in the production of green technologies and products. Conversely, countries with export baskets concentrated in few, low-complexity brown products have much more limited diversification opportunities into green or other exports. Their areas of specialization are heavily concentrated in the periphery of the product space, with few 'nearby' areas to move into. This is due to the peripheral location of extractive industries such as oil, gas and mining in the product space. Affected countries have few adjacent areas to move into and are therefore unlikely to adapt to a net zero future without policy to enable path-breaking diversification. Our findings are evocative of the 'resource curse' literature which emphasizes the difficulties resource-rich countries face in diversifying their economies (e.g. Krugman 1987, Manzano 2014, Sachs and Warner 1995).
Our results suggest that export complexity and diversity play a key role in mitigating transition risk and could potentially be more important than the 'brown-ness' of a country's export profile on its own. Early and pro-active policy interventions will likely be necessary to ensure a just and inclusive transition.
2. Method
2.1. Data
We construct our dataset using CEPII's BACI database (Gaulier and Zignago 2010), which is a global database of bilateral trade flows at the HS 6-digit level, spanning the period from 1995 to 2020. To ensure our results are not skewed by short-term trade fluctuations, we average country-product export values over 5-year periods. This results in a panel dataset of 5 distinct periods: 1996–2000, 2001–2005, 2006–2010, 2011–2015, and 2016–2020. Our panel includes 228 countries and territories. We collect control variables from the World Bank's World Development Indicators Database and OECD Stat's Environment Indicators 9 . Table 8 (appendix) displays summary statistics.
2.2. List of 'brown' products
We develop a new list of 'brown' products which are likely to decline in demand as the world decarbonizes. Because our focus is on economic competitiveness in a low carbon global economy, we focus on products which are brown in use rather than brown in production. We create a narrow and a broad list based on an initial keyword search on product descriptions and then validate these lists with key subject experts. We also draw on lists of green (Mealy and Teytelboym 2020) and CCS related (Serin et al
2021) products used in prior research. More detail about the construction of this list can be found in appendix
2.3. Measuring dependence on brown exports
The Green Complexity Index (GCI) introduced in Mealy and Teytelboym (2020) provides a measure of the degree to which countries are able to capitalize on the opportunities the green economy brings, by measuring their export competitiveness in technologically sophisticated green products. A key aim of this paper is to construct a 'brown' counterpart to the GCI: a measure of dependence on brown activities which provide fewer and fewer opportunities to the economy as the green transition progresses. Intuitively, the GCI is a complexity-weighted count of a country's competitive green exports. It therefore has a strong relationship with a country's diversity (the number of products exported competitively) and especially its green diversity (the number of green products exported competitively). Table 11 (appendix) documents this relationship.
When it comes to measuring brown lock-in, however, we find that countries which depend on brown products for a large share of their export value or export diversity tend to have low diversity overall. That is, major hydrocarbon exporters, for example, with up to 90% of export value composed of brown products, have few other competitive exports—including, in many cases, brown competitive exports, as brown diversity and overall diversity are in turn positively correlated (table 11, appendix). As Revealed Comparative Advantage (RCA) in brown exports for major fossil fuel exporters will in many cases be enormous, a binary measure of whether or not a country is competitive in brown products will not necessarily capture the degree of lock-in very well. On the other hand, exporting a large number of technologically sophisticated brown products implies that many pockets of competitiveness in high value-added activities are at risk of stranding. We therefore compute two indices capturing these different aspects of brown lock-in.
Our baseline measure of country lock-in to low-complexity, brown exports is the 'Brown Lock-in Index' (BLI), which we compute as:
Here  is the share of each brown product in overall export values, and
  is the Product Complexity Index normalized to take a value between 0 and 1. Intuitively, the BLI measures the share of brown exports in a country's export volume, weighted by the inverse of PCI such that less technologically sophisticated products (which tend to be associated with lower income and growth compared to more complex ones, and open up fewer diversification paths) carry a larger weight.
We also construct a more obvious brown equivalent to the GCI: the Brown Complexity Index (BCI), calculated as

where  is a binary variable taking the value 1 if the country has RCA in brown product b, and 0 otherwise. This index counts the number of competitive brown exports, weighted by each product's complexity (as opposed to the BLI, which measures their share in exports and gives a greater weight to less complex brown products). Export capabilities in more technologically sophisticated activities may take longer to develop, involve more specialized equipment, and tend to bring greater benefits to the economy in terms of growth and income. On the other hand, countries with high overall complexity tend to have higher income, rendering them more adaptable to climate- and transition risks. Finally, more complex products are located in the denser core of the product space (see figure 1 for an illustration), implying a greater number of other, nearby diversification opportunities. Despite these benefits, countries must move out of brown areas of comparative advantage if we are to transition to a greener production system.

Figure 1. Brown and green products in the product space.
Download figure:
Standard image High-resolution image2.4. Measuring Transition Outlook
Due to the path dependency of industrial development, countries are more likely to develop future competitive advantages in products which require similar capabilities to the ones they already produce. Recall that Hidalgo et al (2007) measure the similarity or 'pairwise proximity' of two products as the probability that a country has RCA > 1 in one if it does in the other. We use this insight to develop measures aiming to capture the ease of transitioning out of brown activities.
While country proximity to non-brown products would be a measure of climate compatible diversification options more generally, there may be physical, institutional and human capital within a country which specializes in a declining sector and cannot easily transition into those new activities—in other words, even if activity in declining sectors were balanced out, or even exceeded, by new opportunities within the same country, the firms and individuals facing the highest transition risk may not be the same as those benefiting from opportunities in the green economy. We therefore aim to measure the proximity of each particular declining activity to other, climate compatible activities.
For each brown product, we compute the average proximity to products in a non-brown list (green or any non-brown), divided by the product's average proximity to all products, as follows:
where  is the pairwise proximity between brown product b and climate-compatible (green or non-brown) product q; Q is the total number of products of type q;
  is the pairwise proximity between product b and product p; and P is the set of all traded products.
We then compute the Country Transition Outlook as the average of product-level transition possibilities from brown products which the country exports with RCA > 1 to products in a non-brown list (green/any non-brown):
where  again indicates whether the country has RCA in product b, and TOb
denotes the product's Transition Outlook to list q.
again indicates whether the country has RCA in product b, and TOb
denotes the product's Transition Outlook to list q.
Indices are standardized to mean 0 and standard deviation 1. Table 7 (appendix) provides an overview over the measures we construct using trade data, some of which are derived from prior literature.
3. Results
3.1. Are brown products different from other exports?
Following the methodology originally used to create the product space (Hidalgo et al 2007), figure 1 plots the network of all products at the 6-digit level, highlighting those categorized as green or brown. In this network, traded products are represented as nodes, linked to each other on the basis of their product-to-product proximity. This provides some visual intuition for where green and brown products are located in the broader product space. Some brown products (such as conventional vehicles) are located within the dense core of the product space, close to many non-brown products, including green ones (such as electric or hybrid vehicles). Others, such as bovine meat or crude oil, are located in the periphery and mostly near other brown products. Petroleum is a particularly interesting case: while refined oil is arguably still within the core and near a good number of other products, crude oil is very peripheral. This would suggest that countries engaged in petroleum refining may find it easier to transition than those mostly exporting crude oil.
Overall, we find that brown products tend to be less complex than green products (see figure 2). We also find that brown products tend to be closer to green products in the product space than they are to other products. This suggests that countries which export these products may find it relatively easy to shift towards greener activities.
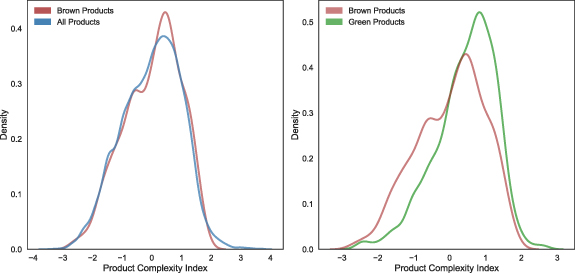
Figure 2. Distribution of Product Complexity Index for brown products.
Download figure:
Standard image High-resolution imageFigure 2 plots the distribution of the Product Complexity Index (hereafter PCI) for products on our narrow brown list (in brown), compared to the distribution of PCI for all products (in blue). The PCI distribution for brown products is not statistically different to the PCI distribution for all products, suggesting brown products are no more or less complex than average 10 . Brown products thus tend to be less complex than green products, the latter on average being more complex than other products (Mealy and Teytelboym 2020).
Tables 13 and 14 (appendix) list the 20 brown products with the highest and the lowest PCI, respectively. Brown products which are high in complexity include engines, pumps and various hydrocarbon-derived chemicals, while low-complexity brown products more prominently feature unprocessed hydrocarbons.
Figure 3 plots the distribution of Product Transition Outlook to green products for the period 2016–2020. Transition opportunities for brown to green products tend to be above average, as indicated by the higher density of products with transition possibilities above 1. This suggests that there are proximate green transition opportunities for many brown exports.

Figure 3. Distribution of Product Transition Outlook from brown to green products.
Download figure:
Standard image High-resolution imageAppendix
3.2. Country dependence on brown exports and transition possibilities
Our results indicate that countries which rely on low complexity brown products for a large share of their exports face very different challenges in the transition to those exporting more sophisticated brown products. For the latter group, we find that brown exports tend to be close to non-brown diversification opportunities in the product space. By contrast, the former group, and petrostates in particular, have low transition opportunities and could find it more difficult to adjust to a low carbon global economy.
Tables 1 and 2 show the 20 countries ranking most highly on the Brown Lock-in Index and Brown Complexity Index, respectively 11 . As we have alluded to, they paint two very different pictures. The countries ranking highest on the BLI include South Sudan, Iraq, and Libya, followed by a number of mostly other petrostates including Venezuela, Kuwait, Saudi Arabia, and Iran.
Table 1. Countries ranking most highly on the Brown Lock-in Index.
| Country | BLI | Brown exports [1M USD] | Brown Export Share [%] | GDP per capita [USD] | Transition Outlook | Green Transition Outlook |
|---|---|---|---|---|---|---|
| South Sudan | 3.57 | 13.49 | 94.82 | Not Available | −4.42 | −2.71 |
| Iraq | 3.48 | 634.12 | 94.50 | 5115.69 | −0.30 | −0.98 |
| Libya | 3.29 | 193.89 | 90.92 | 5810.85 | −2.45 | −2.37 |
| Angola | 3.27 | 307.13 | 88.99 | 3095.46 | −1.58 | −1.76 |
| Equatorial Guinea | 3.21 | 38.62 | 88.80 | 8897.39 | −1.87 | −2.21 |
| Azerbaijan | 3.19 | 148.20 | 89.41 | 4358.97 | −0.99 | −0.67 |
| Nigeria | 3.18 | 449.05 | 87.69 | 2099.86 | −1.51 | −1.99 |
| Brunei Darussalam | 3.02 | 56.55 | 91.51 | 29 177.48 | −0.73 | −0.12 |
| Chad | 2.98 | 11.30 | 81.44 | 690.87 | −4.42 | −2.71 |
| Venezuela | 2.92 | 178.51 | 84.28 | Not Available | −0.31 | −0.74 |
| Kuwait | 2.92 | 479.84 | 90.00 | 29 599.34 | −0.75 | −0.63 |
| Algeria | 2.91 | 299.23 | 93.75 | 3898.94 | −1.27 | −1.36 |
| Qatar | 2.77 | 571.76 | 86.98 | 58 919.32 | −1.71 | −0.99 |
| Turkmenistan | 2.49 | 71.46 | 87.21 | 6888.55 | −0.17 | −0.98 |
| Saudi Arabia | 2.42 | 1592.41 | 74.14 | 21 453.67 | −1.04 | −0.32 |
| Timor-Leste | 2.25 | 0.63 | 69.09 | 1385.77 | −2.05 | −0.35 |
| Gabon | 2.19 | 32.41 | 64.23 | 7364.51 | −2.51 | −1.12 |
| Oman | 2.16 | 240.97 | 69.68 | 17 047.08 | −1.22 | −0.71 |
| Kazakhstan | 2.09 | 343.43 | 63.78 | 9141.98 | −1.18 | −1.22 |
| Iran | 1.99 | 369.01 | 63.00 | 3981.87 | −0.85 | −0.74 |
Note: The Brown Lock-in Index (BLI) constitutes our baseline measure of lock-in to brown exports. It is computed as  where
where  is the share of each brown product in overall export values, and
  is the Product Complexity Index normalized to take a value between 0 and 1. The table shows the 20 countries with the highest BLI.
Table 2. Countries ranking most highly on the Brown Complexity Index.
| Country | BCI | Brown exports [1M USD] | Brown Export Share [%] | GDP per capita [USD] | Transition Outlook | Green Transition Outlook |
|---|---|---|---|---|---|---|
| USA | 4.93 | 2462.74 | 17.11 | 62 013.69 | −0.52 | 0.46 |
| Japan | 4.27 | 1257.50 | 18.67 | 39 814.17 | −0.24 | 0.67 |
| Germany | 3.95 | 1824.49 | 13.21 | 45 520.66 | 0.02 | 0.97 |
| Belgium | 3.73 | 460.61 | 14.92 | 45 068.76 | −0.41 | 0.33 |
| Netherlands | 3.67 | 718.24 | 14.26 | 50 490.97 | −0.44 | 0.09 |
| France | 3.24 | 468.56 | 8.99 | 39 380.82 | 0.27 | 0.78 |
| United Kingdom | 3.03 | 802.30 | 19.29 | 42 026.79 | −0.05 | 0.88 |
| Rep. of Korea | 2.84 | 871.01 | 15.49 | 31 579.38 | −0.19 | 0.32 |
| Thailand | 2.76 | 321.74 | 13.03 | 6977.58 | 0.07 | 0.41 |
| India | 2.48 | 488.12 | 15.91 | 1947.72 | 0.43 | −0.05 |
| Spain | 2.39 | 534.73 | 17.27 | 28 314.84 | 0.14 | 0.02 |
| Italy | 2.22 | 434.85 | 8.74 | 32 645.50 | 0.92 | 1.03 |
| Austria | 2.02 | 147.49 | 9.11 | 48 550.29 | 0.30 | 1.22 |
| China | 1.91 | 652.10 | 2.60 | 9479.06 | 0.88 | −0.19 |
| Poland | 1.67 | 189.41 | 7.87 | 14 646.76 | 0.74 | 0.63 |
| Finland | 1.62 | 98.55 | 14.24 | 47 483.98 | 0.54 | 1.37 |
| Canada | 1.62 | 1269.66 | 31.52 | 44 725.29 | −0.85 | 0.28 |
| Singapore | 1.61 | 507.49 | 16.89 | 62 028.43 | −0.47 | 0.28 |
| Turkey | 1.44 | 222.47 | 12.58 | 9719.31 | 0.80 | 0.17 |
| Portugal | 1.40 | 76.23 | 11.80 | 22 094.78 | 0.48 | 0.10 |
Note: The Brown Complexity Index (BCI) forms a direct counterpart to the Green Complexity Index (GCI) and measures the number and complexity of brown products a country is competitive in. It is computed as  . Export capabilities in more technologically sophisticated activities may take longer to develop and bring greater benefits to the economy. However, by opening up a greater number of diversification paths they are likely associated with easier transition pathways. The table shows the 20 countries with the highest BCI.
The BCI yields very different results. The country with the highest ranking of BCI, shown in table 2, is the United States, followed by Japan, Germany, and predominantly other industrialized nations, as well as emerging economies such as India and China. The BCI correlates positively with the GCI, indicating that countries which competitively export complex products, even if many of them are classed as 'brown', also tend to have strong capabilities to export complex green products. Table 11 (appendix) reports correlations between these and other indices.
Which countries enjoy proximate transition opportunities? Table 3 reports the results of a regression estimating the relationship
where  denotes BLI, BCI or GCI, δt
are year dummies, and ε is the error term. Standard errors are clustered at the country level
12
.
denotes BLI, BCI or GCI, δt
are year dummies, and ε is the error term. Standard errors are clustered at the country level
12
.
Table 3. Correlates of Country Transition Outlook measures.
| (1) Overall | (2) Overall | (3) Overall | (4) Green | (5) Green | (6) Green | |
|---|---|---|---|---|---|---|
| Brown Lock-in Index | −0.518*** | −0.573*** | ||||
| (0.068) | (0.061) | |||||
| GDP per capita (current USD) (log) | −0.051 | −0.028 | −0.073 | 0.091 | 0.049 | −0.014 |
| (0.058) | (0.066) | (0.066) | (0.066) | (0.072) | (0.062) | |
| Coal rents (% of GDP) | −0.066** | −0.083** | −0.083*** | −0.106*** | −0.128** | −0.121** |
| (0.030) | (0.038) | (0.030) | (0.034) | (0.050) | (0.054) | |
| Oil rents (% of GDP) | 0.006 | −0.044*** | −0.038*** | 0.006 | −0.040*** | −0.033*** |
| (0.007) | (0.004) | (0.004) | (0.006) | (0.005) | (0.004) | |
| Natural gas rents (% of GDP) | −0.021** | −0.041** | −0.038*** | 0.001 | −0.015 | −0.013 |
| (0.009) | (0.016) | (0.013) | (0.011) | (0.015) | (0.012) | |
| CO2 emissions (metric tons per capita, log) | 0.042 | 0.065 | −0.005 | 0.180* | 0.049 | 0.055 |
| (0.099) | (0.114) | (0.106) | (0.107) | (0.121) | (0.104) | |
| Brown Complexity Index | −0.115*** | 0.244*** | ||||
| (0.041) | (0.048) | |||||
| Green Complexity Index | 0.082 | 0.365*** | ||||
| (0.050) | (0.044) | |||||
| Year FEs | Yes | Yes | Yes | Yes | Yes | Yes |
| Observations | 854 | 854 | 854 | 854 | 854 | 854 |
| R2 | .267 | .21 | .204 | .347 | .31 | .361 |
*p<0.1; **p<0.05; ***p<0.01.Linear regression. Cluster-robust standard errors in parentheses.Dependent variables are country-level transition opportunities from brown to the list stated.The label (log) refers to the natural logarithm of 1 + the variable in question. Note: The table reports the results of a regression of Green and Overall Transition Outlook on the a number of potential explanatory variables.
Results indicate that the BLI is negatively and significantly associated with the ease of transitioning to green or overall non-brown products. The BCI is negatively associated with transition opportunities to non-brown products overall, but positively with transition opportunities to green products, which tend to be more complex.
We also explore the relationship between natural resource rents and  emissions and the ease of transitioning away from brown areas of competitive advantage. Most coefficients estimated are not statistically significant. Both coal and oil rents (as a % of GDP) seem to be negatively associated with transition possibilities (significant in most specifications), while natural gas rents are negatively associated with transition possibilities to non-brown products overall, but insignificant when it comes to transitioning to green. The coefficient on logged
  emissions per capita is unstable, likely due to its relationship with some measures of brown and green competitiveness.
We carry out robustness checks computing our baseline measures of BLI and BCI for the longer list of brown products, which includes in particular cattle and sheep farming exports, as discussed in appendix
3.3. Validation
We take several steps to ensure our measures are meaningful. First, we regress the Brown Lock-in Index and the Brown Complexity Index on a number of potentially relevant covariates, such as income, natural resource rents, and Revealed Technological Advantage
13
(RTA) in climate-relevant technologies. While there is no statistically significant relationship between the BLI and income, our results suggest high BCI-countries also have higher GDP per capita. The BLI is positively and significantly, the BCI negatively and significantly associated with higher oil rents. The BLI is also positively associated with natural gas rents and patenting in carbon capture and storage (CCS), but negatively with patenting in transport-related mitigation technologies. There is no significant association between BLI and per capita  emissions; however, countries which score highly in BCI have higher
  emissions. By contrast, Mealy and Teytelboym (2020) find that countries with high green complexity have lower per capita emissions.
We also test the relevance of our Transition Outlook measures. We first regress BLI and BCI on lagged Green and Overall Transition Outlook, as well as their own lagged values, GDP per capita and other covariates. Results suggest that the Green Transition Outlook is a statistically significant predictor of future reductions in Brown Complexity Index, but not Brown Lock-in Index 14 . The Overall Transition Outlook, on the other hand, is significantly associated with reductions in future BLI but not BCI 15 .
Regression tables can be found in appendix
4. Discussion
Mitigating climate change requires a systemic technological transformation which is historically unparalleled in speed and scale. This transition is likely to leave large swaths of previously productive and profitable assets stranded. While the transition risk facing oil exporting countries has been noted (e.g. Manley et al 2017, Zenghelis et al 2018), quantitative measures of transition risk at the level of nations' productive structures have been lacking—a gap this paper has endeavored to fill. Our estimates of current lock-in to declining sectors, as well as the ease of transitioning to climate-compatible activities, highlight the isolated nature of extractive industries and the importance of diverse productive assets and capabilities in adapting to global economic shifts (Zenghelis et al 2018). We also map the similarity of brown products to green products within the product space, and find that many brown products seem to require similar productive capabilities as green products—in line with a recent finding by Jee and Srivastav (2022) that most clean patents are at least indirectly connected to a dirty patent in the technology space. This suggests many productive assets currently devoted to brown activities may shift to emerging green ones with relative ease. We find a similar pattern at the country level, with countries exporting a diverse number of sophisticated brown products often being well-positioned to shift into green technologies. Countries depending on a small number of fossil fuel exports, however, face significant transition risk.
There is an ongoing policy debate about transition opportunities for the fossil fuel industry. Suggested possibilities include green hydrogen and other low carbon fuels, ammonia, and products used in CCS. These tend to co-occur with high-carbon products, as  captured and stored with the respective technology can be utilized in a synthesis of methanol, for example (Collodi et al
2017). Hydrogen is primarily an energy carrier, which can be transformed to ammonia for easier transport, another net-zero relevant energy carrier. As the global market for hydrogen still needs to be scaled up, one can expect initially grey hydrogen to increasingly transform into blue and eventually green, as large-scale production facilities in countries such as Namibia, Morrocco, Chile and Australia come on-stream (Bouckaert et al
2021, Eicke and De Blasio 2022)
16
.
captured and stored with the respective technology can be utilized in a synthesis of methanol, for example (Collodi et al
2017). Hydrogen is primarily an energy carrier, which can be transformed to ammonia for easier transport, another net-zero relevant energy carrier. As the global market for hydrogen still needs to be scaled up, one can expect initially grey hydrogen to increasingly transform into blue and eventually green, as large-scale production facilities in countries such as Namibia, Morrocco, Chile and Australia come on-stream (Bouckaert et al
2021, Eicke and De Blasio 2022)
16
.
Our methodological approach has some potential to validate these largely anecdotal accounts. While the above considerations are mostly strategic and forward-looking, and trends in such directions therefore unlikely to feature prominently in historical data, there are some encouraging individual country examples. Saudi Arabia is the world's largest exporter of anhydrous ammonia 17 , accounting for 23% of world exports, followed by Russia and Trinidad and Tobago. Trinidad and Tobago and Saudi Arabia are further the largest exporters of methanol 18 at 13% of world exports each, followed by Iran at 11%. Drawing on the list of products related to carbon capture, utilization and storage (CCUS) compiled by Serin et al (2021), we find that declines (increases) in the share of refined oil, natural gas (liquefied or piped) and coal are all significantly associated with increases (reductions) in RCA in CCUS technologies, as well as—with the exception of LNG—export share of CCUS. There is, however, no correlation between changes in the share of crude and CCUS.
Despite these encouraging examples, however, our results highlight the limitations of exploiting 'latent comparative advantage' in countries which score highly on our Brown Lock-in Index measure. Countries which have reduced their BLI have tended to reduce reliance on coal or crude oil, but have usually done this either by increasing reliance on other hydrocarbon exports, like refined oil or natural gas, or by increasing exports of unrelated products. Pathways for 'related diversification' for these 'locked-in' countries are thus very limited. For example, the United Arab Emirates, whose BLI rank fell from 19 in 1996–2000 to 32 in 2016–2020, reduced the share of crude oil in its exports from 56.24% to 21.42% during the same period 19 . Meanwhile, the share of refined oil almost doubled, from 6.97% to 12.23%. The country further increased its exports of diamonds, metals and gold, jewellery and radio transmissions apparatus.
Overall, our results suggest that the complexity of a nation's exports could be more important to mitigating transition risk than the 'brown-ness' of those exports on its own. The related diversification approach is of limited use to countries which have few areas of latent comparative advantage in sectors that are likely to remain viable in the green economy. The question then becomes: how can countries break out of low complexity, low diversity specialization paths?
There is significantly less quantitative evidence on how regions may break out of path dependent trajectories than there is for the importance of relatedness in driving industrial development. Studies which do engage with this question suggest that the capacity to invest in innovation may play an important role in reducing the constraints of existing capabilities and enabling regions to jump into less related areas of specialization (e.g. Zhu et al 2017, Xiao et al 2018). Xiao et al (2018), in their study of Chinese regions' diversification into related and unrelated new industries over the period 2002–2011, further find a significant and positive effect of factors such as extra-regional linkages (proxied by FDI and imports), human capital and 'open-minded social-institutional contexts' in enabling regions to jump further within the industry space. This suggests that promoting extra-regional knowledge exchange and fostering healthy innovation ecosystems (see e.g. Gomes et al 2018, Brown and Mawson 2019, Leendertse et al 2021) may be key strategies for countries locked-in to low-complexity, declining industrial sectors.
5. Conclusion
This paper estimates the extent to which countries' productive capabilities are specialized in both complex and non-complex brown exports. We make three contributions to the literature. First, we develop novel measures of country-level transition risk that account for the ability of countries with brown exports to transition into more climate-compatible areas of comparative advantage. Second, we develop a list of traded 'brown' products, which provides a previously missing counterpart to the WTO's 'green' list used in prior research. Third, we locate declining brown products within the product space and measure their proximity to climate-compatible products.
Compared to the average exported product, brown products tend to be more proximate to green products. This is an encouraging finding, as it suggests that factors of production currently devoted to many brown activities could be redeployed towards climate compatible alternatives relatively easily. However, the picture is bleaker for major hydrocarbon exporters that score low on diversity, complexity, and have low proximity between their brown areas of comparative advantage and non-brown products within the product space. While smart specialization policies and relatedness measures can highlight the most proximate products for brown activities to shift into, this is less helpful for countries specialized in brown products at the periphery of the product space that have very few proximate diversification opportunities. As the difficulty fossil fuel exporters face in adapting to a low carbon future presents a threat to effective global climate action, there is an urgent need to find viable development pathways for these countries. Further research on how to achieve path-breaking diversification, particularly for low complexity regions, should be a high priority.
While our paper provides trade-based measures of transition risk and opportunities across nations, we recognize that transition risk will also vary within countries. Although our measures are agnostic regarding the underlying mechanisms of relatedness 20 , the ability of workers to move into new activities as some sectors decline is key to achieving a just transition. Existing research has examined the similarity of green skills to non-green skills (e.g. Consoli et al 2016, Saussay et al 2022). Saussay et al 2022 identify the skills intensities required for low- and high-carbon jobs using job ads data, and find evidence to suggest that differences between high- and low-carbon jobs tend to be smaller than those between generic and low-carbon jobs, but that high and low-carbon jobs in the US tend not to be spatially co-located. However, granular evidence on the transferability of skills used in declining sectors to climate compatible ones (green or not) is currently lacking and should be a priority for future research.
More broadly, our measures are based on historical patterns of co-exporting. The low carbon transition requires shifts in global trade, as well as changes in technologies themselves. Such dynamics are likely to transform the product space network and alter the relatedness between different economic activities. The implications of such changes in the network of economic activities for economic development are another important avenue for future inquiry.
Acknowledgments
We thank Joris Bücker, Theodor Cojoianu, Jim Cust, Aldo Ravazzi Douvan, Federico Drogo, Eugenie Dugoua, Marion Dumas, Roger Fouquet, Steve Jenkins, Martin Lokanc, Osmel Manzano, Misato Sato, and two anonymous reviewers for their helpful comments at various stages of this paper's development, as well as the participants of the seminars and workshops where this paper was presented and discussed. Pia Andres acknowledges funding from the Grantham Research Institute on Climate Change and the Environment at the London School of Economics, the ESRC Centre for Climate Change Economics and Policy (CCCEP) (reference ES/R009708/1), and the UK Foreign and Development Office through the Climate Compatible Growth Programme. Nils Handler acknowledges funding from the Foundation of German Businesses. Sam Fankhauser acknowledges funding from the UK Foreign and Development Office through the Climate Compatible Growth Programme.
Data availability statement
The data that support the findings of this study are available upon reasonable request from the authors. Data and additional country-specific figures and insights will also be made available at www.green-transition-navigator.org.
Appendix A: List of 'brown' products
To identify specializations in 'brown' products, we first define and identify such products within trade data, as no such list exists to date. Prior research analysing patenting trends in clean and dirty technologies has compiled various lists of dirty patent codes, which tend to focus primarily on the energy and transport sectors (e.g. Johnstone et al 2010, Verdolini and Galeotti 2011, Aghion et al 2016, Dechezleprêtre et al 2017, Popp et al 2020). Much of our list is in the spirit of this work. While the capacity to innovate is likely geographically correlated with production capabilities in a particular sector, exports are a more direct proxy of a country's actual manufacturing and other production capacity, as well as the jobs and capital tied up therein. They also have significant implications for overall economic viability and terms of trade. We therefore measure productive capabilities using export, rather than patent, data.
Since the goal of this paper is to assess transition risks and transition possibilities for countries, we focus specifically on developing a list of brown products for which global demand is likely to decline as the world decarbonizes. We maintain a focus on products which are mostly brown in use, rather than production. As such, we do not consider products where current production processes are polluting, but which can be expected to form part of the low carbon economy 21 . Moreover, our focus on the transition to a low carbon economy results in a narrower classification than a broader definition of 'brown' might.
We first conduct a keyword search on the descriptions of 6-digit codes within the Harmonized System
22
, aiming to create a 'narrow' and a 'broad' list. The narrow list focuses on fossil fuels and includes the following keywords: 'coal', 'petro', 'hydrocarbon', 'internal combustion engine', 'gas', 'combustion'. Fossil fuels are the biggest contributors to climate change, and their use must decline most substantially to reach net zero  emissions (Shukla et al
2019, 2022). The burning of coal, for example, accounts for 26% of global greenhouse gas emissions and needs to decline by 20%–70% by 2030 in order to reach the goals of the Paris agreement (Steckel and Jakob 2022), and coal consumption without CCS needs to fall by 67%–82% by 2030 to limit global warming to 1.5 ∘C. Oil and gas consumption need to decline less abruptly. Overall, 30% of oil, 50% of gas and 80% of coal reserves are unburnable if we are to limit global warming to 2 ∘C (Shukla et al
2022). Coal, oil and gas patents codes are also classified as dirty in the respective patent-literature (e.g. Aghion et al
2016, Dechezleprêtre et al
2017).
emissions (Shukla et al
2019, 2022). The burning of coal, for example, accounts for 26% of global greenhouse gas emissions and needs to decline by 20%–70% by 2030 in order to reach the goals of the Paris agreement (Steckel and Jakob 2022), and coal consumption without CCS needs to fall by 67%–82% by 2030 to limit global warming to 1.5 ∘C. Oil and gas consumption need to decline less abruptly. Overall, 30% of oil, 50% of gas and 80% of coal reserves are unburnable if we are to limit global warming to 2 ∘C (Shukla et al
2022). Coal, oil and gas patents codes are also classified as dirty in the respective patent-literature (e.g. Aghion et al
2016, Dechezleprêtre et al
2017).
The broad list additionally includes the keywords 'bovine' (relating to cattle) and 'sheep'. Meat consumption, particularly beef and mutton, is particularly emission intensive and consumption reductions can reduce emissions substantially (Shukla et al 2019, Funke et al 2021). While they are brown in production, rather than in use, a more sustainable diet requires a shift away from these agricultural products. Hence we include both in our broader list, which is used for robustness checks.
To validate this keyword search-based classification into brown product categories and respective lists, we elicited feedback from five policy, chemicals and green innovation and growth experts. We approached experts based on their technical ability to assess the implications of the transition for relevant economic sectors. Whenever more than one expert disagreed with our classification, say to classify a product as brown, we followed that suggestion and reclassified the product. Upon cross-checking the proposed new list with the WTO's original green list we found that seven products to be moved to the brown list were on the WTO's list of green products and should therefore remain excluded. In the end, only one additional product was added to the brown list and another removed. We also matched our list to the green list used in prior research (Mealy and Teytelboym 2020) and excluded products which appeared on the brown and the green list from both lists. Following this validation process, 144 products constitute the narrow brown list vis-a-vis 171 products in the broad brown list. The revised green list includes 245 products, which includes CCUS products listed in Serin et al (2021).
We initially approached experts to also review a list of grey products designed to deal with controversial cases—specifically, the small set of products which appeared on both our brown and the WTO's green list, as well as steel, cement and plastic products. Steel, cement and plastic are particularly difficult cases to contend with: they are essential inputs into many sectors of the economy, including clean infrastructure. However, the emissions involved in their production process are very large, and not easily mitigated with available technology. Nevertheless, the fact that demand for some of these products such as cement and steel might increase as a result of the net zero transition, and that there was no clear rationale for including or excluding a product from the grey list given that most fossil-energy based production processes are polluting and need cleaning up, led us to eventually drop the list. Instead, we focus on brown goods which are both brown in use and likely to decline in demand in net zero scenarios.
There are many possible approaches which could be taken, such as selecting products based on embodied emissions (e.g. Broner et al 2012), and we therefore cannot claim this list to be exhaustive or authoritative. We have selected products which we consider uncontroversial in their status as 'highly likely to see demand declines in the green transition', as this approach is best suited to our aim of capturing transition risk. Other research on 'brown trade' (for example, work which focuses on exposure to carbon border adjustments) may be better served by a different list (for example, one which is based on embodied carbon emissions).
Appendix B: Validation
Table 4 reports our estimates of
and
where  is a vector of RTA values in climate-related technologies, δt
are year dummies, and ε is the error term. Standard errors are clustered at the country level.
is a vector of RTA values in climate-related technologies, δt
are year dummies, and ε is the error term. Standard errors are clustered at the country level.
Table 4. Correlates of brown dependence measures.
| (1) BLI | (2) BLI | (3) BLI | (4) BCI | (5) BCI | (6) BCI | |
|---|---|---|---|---|---|---|
| GDP per capita (current USD) (log) | 0.045 | −0.004 | 0.057 | 0.321*** | 0.180* | 0.204 |
| (0.041) | (0.049) | (0.083) | (0.055) | (0.100) | (0.159) | |
| Coal rents (% of GDP) | 0.035 | 0.008 | ||||
| (0.022) | (0.086) | |||||
| Oil rents (% of GDP) | 0.090*** | −0.025*** | ||||
| (0.006) | (0.005) | |||||
| Natural gas rents (% of GDP) | 0.036** | −0.017 | ||||
| (0.014) | (0.015) | |||||
| CO2 emissions (metric tons per capita, log) | 0.050 | 0.421*** | ||||
| (0.098) | (0.159) | |||||
| RTA, Environment-related Technologies | 1.939 | 1.271 | ||||
| (1.198) | (1.809) | |||||
| RTA, Energy-related Mitigation Technologies | −0.425 | −3.280** | ||||
| (1.210) | (1.498) | |||||
| RTA, Carbon Capture and Storage | 3.658*** | −4.977* | ||||
| (0.688) | (2.660) | |||||
| RTA, Climate Change Adaptation Technologies | 0.765 | −1.061* | ||||
| (0.646) | (0.556) | |||||
| RTA, Transport-related Mitigation Technologies | −2.525** | 2.730 | ||||
| (1.066) | (2.748) | |||||
| Year FEs | Yes | Yes | Yes | Yes | Yes | Yes |
| Observations | 933 | 854 | 222 | 933 | 854 | 222 |
| R2 | .00453 | .767 | .203 | .212 | .324 | .171 |
*p<0.1; **p<0.05; ***p<0.01.Linear regression. Cluster-robust standard errors in parentheses.The label (log) refers to the natural logarithm of 1 + the variable in question.Dependent variables relate to brown list (narrow). Note: We regress the Brown Lock-in Index and the Brown Complexity Index on a number of potentially relevant covariates, such as income, natural resource rents, and Revealed Technological Advantage in climate-relevant technologies.
Table 5 reports our estimates of
and
while table 6 reports estimates of
and
where  is a vector of controls, δt
are year dummies, and ε is the error term. Standard errors are clustered at the country level.
is a vector of controls, δt
are year dummies, and ε is the error term. Standard errors are clustered at the country level.
Table 5. Predictive power of Green Transition Outlook.
| (1) BLI | (2) BLI | (3) BCI | (4) BCI | |
|---|---|---|---|---|
| Brown Lock-in Index (t − 1) | 0.959*** | 0.952*** | ||
| (0.018) | (0.034) | |||
| Green Transition Outlook (t − 1) | −0.002 | 0.003 | −0.024** | −0.021** |
| (0.019) | (0.020) | (0.009) | (0.010) | |
| GDP per capita (current USD, log, t − 1) | −0.003 | −0.015 | 0.023*** | 0.021 |
| (0.010) | (0.016) | (0.007) | (0.017) | |
| Coal rents (% of GDP, t − 1) | 0.026*** | 0.002 | ||
| (0.009) | (0.010) | |||
| Oil rents (% of GDP, t − 1) | 0.002 | −0.001 | ||
| (0.003) | (0.001) | |||
| Natural gas rents (% of GDP, t − 1) | 0.004* | −0.001 | ||
| (0.002) | (0.001) | |||
| CO2 emissions (metric tons per capita, log, t − 1) | 0.023 | 0.020 | ||
| (0.027) | (0.027) | |||
| Brown Complexity Index (t − 1) | 0.956*** | 0.947*** | ||
| (0.015) | (0.016) | |||
| Year FEs | Yes | Yes | Yes | Yes |
| Observations | 715 | 661 | 715 | 661 |
| R2 | .931 | .943 | .926 | .93 |
*p<0.1; **p<0.05; ***p<0.01.Linear regression. Cluster-robust standard errors in parenthesis.The label (log) refers to the natural logarithm of 1 + the variable in question.t-1 refers to the previous period's value.
Note: Country Transition Outlook is calculated as  , where
  indicates whether the country has RCA in product b, and
  denotes the product's Transition Outlook to list q (more intuitively called Normalized Product Proximity).
  with
with  being the pairwise proximity between brown product b and climate-compatible (green or non-brown) product q; Q the total number of products of type q;
  the pairwise proximity between product b and product p; and P the set of all traded products. The table reports the results of a regression of the BLI and BCI on their lagged values, lagged Green Transition Outlook and several covariates, showing that a higher Green Transition Outlook predicts future decreases in BCI, but has no statistically significant association with BLI.
Table 6. Predictive power of Overall Transition Outlook.
| (1) BLI | (2) BLI | (3) BCI | (4) BCI | |
|---|---|---|---|---|
Brown Lock-in Index ( ) ) | 0.941*** | 0.939*** | ||
| (0.018) | (0.030) | |||
| Overall Transition Outlook (t − 1) | −0.042*** | −0.024* | 0.005 | 0.010 |
| (0.016) | (0.013) | (0.009) | (0.012) | |
| GDP per capita (current USD, log, t − 1) | −0.005 | −0.016 | 0.022*** | 0.020 |
| (0.008) | (0.016) | (0.007) | (0.017) | |
| Coal rents (% of GDP, t − 1) | 0.025*** | 0.005 | ||
| (0.009) | (0.011) | |||
| Oil rents (% of GDP, t − 1) | 0.002 | −0.000 | ||
| (0.003) | (0.001) | |||
| Natural gas rents (% of GDP, t − 1) | 0.004* | −0.000 | ||
| (0.002) | (0.001) | |||
 emissions (metric tons per capita, log, t − 1) emissions (metric tons per capita, log, t − 1) | 0.023 | 0.019 | ||
| (0.026) | (0.027) | |||
| Brown Complexity Index (t − 1) | 0.948*** | 0.943*** | ||
| (0.015) | (0.016) | |||
| Year FEs | Yes | Yes | Yes | Yes |
| Observations | 715 | 661 | 715 | 661 |
| R2 | .932 | .943 | .926 | .93 |
*p<0.1; **p<0.05; ***p<0.01.Linear regression. Cluster-robust standard errors in parenthesis.The label (log) refers to the natural logarithm of 1 + the variable in question. t − 1 refers to the previous period's value. Note: Like table 5, but using Overall, instead of Green, Transition Outlook.
Appendix C: Supplementary tables
Table 12 reports estimates of the relationships
Table 7. Measures derived from trade data.
| Name | Formula | Source |
|---|---|---|
| Revealed Comparative Advantage (RCA) |
| Balassa (1965) |
| Product-to-Product Proximity |

| Hidalgo et al (2007) |
| Country-to-Product Proximity |
| Hidalgo et al (2007) |
| (Proximity Density) | ||
| Diversity |

| Hidalgo and Hausmann (2009) |
| Economic Complexity Index (ECI) | Eigenvector associated with the second largest right eigenvalue of the matrix given by  where D is the diagonal matrix formed from the vector of countries' diversity values, U is the diagonal matrix formed from the vector of product ubiquity values and M is a binary matrix where rows correspond to countries, columns correspond to products and Mcp
= 1 if country c's RCA in product p is > 1 and 0 otherwise. where D is the diagonal matrix formed from the vector of countries' diversity values, U is the diagonal matrix formed from the vector of product ubiquity values and M is a binary matrix where rows correspond to countries, columns correspond to products and Mcp
= 1 if country c's RCA in product p is > 1 and 0 otherwise. | Hidalgo and Hausmann (2009) |
| Product Complexity Index (PCI) | Eigenvector associated with the second largest right eigenvalue of the matrix given by 
| Hidalgo and Hausmann (2009) |
| Green Complexity Index (GCI) |

| Mealy and Teytelboym (2020) |
| Brown Lock-in Index (BLI) |
| This Paper |
| Brown Complexity Index (BCI) |

| This Paper |
| Brown Lock-in Index (binary) |
| This Paper |
| Product Transition Outlook |
| This Paper |
| (Normalized Proximity) | ||
| Country Transition Outlook |
| This Paper |
Note: Notation:  is the share of each brown product in overall export values.
  is a binary variable taking the value 1 if a country exports the product in question with RCA > 1.
  is the Product Complexity Index normalized to take a value between 0 and 1.
  is the pairwise proximity between brown product b and climate-compatible (green or non-brown) product q; Q is the total number of products of type q;
  is the pairwise proximity between product b and product p; and P is the set of all traded products.
Table 8. Summary statistics for trade and policy variables.
| mean | sd | min | max | |
|---|---|---|---|---|
| Brown Export Volume (1000 USD) |

|

| 11.94 |

|
| % Share of Brown in Export Volume | 19.90 | 26.66 | 0.07 | 99.70 |
| Number of Competitive Brown Products | 11.89 | 12.83 | 1.00 | 76.00 |
| % Share of Brown in Export Diversity | 3.45 | 4.67 | 0.14 | 50.00 |
| Green Export Volume (1000 USD) |

|

| 0.00 |

|
| % Share of Green in Export Volume | 3.18 | 3.52 | 0.00 | 28.98 |
| Number of Competitive Green Products | 24.41 | 28.31 | 0.00 | 163.00 |
| % Share of Green in Export Diversity | 4.64 | 2.49 | 0.00 | 16.67 |
| CO2 emissions (metric tons per capita) | 4.50 | 5.44 | 0.00 | 42.74 |
| GDP per capita (current USD) | 12 597.35 | 18 127.71 | 124.93 | 11 6072.05 |
| Coal rents (% of GDP) | 0.14 | 0.65 | 0.00 | 10.63 |
| Oil rents (% of GDP) | 3.79 | 9.43 | 0.00 | 66.21 |
| Natural gas rents (% of GDP) | 0.66 | 3.25 | 0.00 | 57.32 |
| RTA, Climate Change Adaptation Technologies | 0.68 | 1.27 | 0.00 | 15.62 |
| RTA, Energy-related Mitigation Technologies | 0.50 | 0.82 | 0.03 | 8.81 |
| RTA, Environment-related Technologies | 0.81 | 0.87 | 0.08 | 5.38 |
| RTA, Carbon Capture and Storage | 0.06 | 0.18 | 0.00 | 1.75 |
| RTA, Transport-related Mitigation Technologies | 0.26 | 0.58 | 0.01 | 5.26 |
| Observations | 1051 |
Note: The table displays summary statistics for some of the indices we compute, as well as policy and control variables. Export-based indicators are computed using data from CEPII's BACI database (Gaulier and Zignago 2010). Revealed Technological Advantage (RTA) in different low carbon technologies is derived from OECD Stat. All other variables are collected from the World Bank's World Development Indicators.
Table 9. Countries ranking most highly on the Brown Lock-in Index.
| Country | BLI | Brown exports [1M USD] | Brown Export Share [%] | GDP per capita [USD] | Transition Outlook | Green Transition Outlook |
|---|---|---|---|---|---|---|
| South Sudan | 3.57 | 13.49 | 94.82 | Not Available | −4.42 | −2.71 |
| Iraq | 3.48 | 634.12 | 94.50 | 5115.69 | −0.30 | −0.98 |
| Libya | 3.29 | 193.89 | 90.92 | 5810.85 | −2.45 | −2.37 |
| Angola | 3.27 | 307.13 | 88.99 | 3095.46 | −1.58 | −1.76 |
| Equatorial Guinea | 3.21 | 38.62 | 88.80 | 8897.39 | −1.87 | −2.21 |
| Azerbaijan | 3.19 | 148.20 | 89.41 | 4358.97 | −0.99 | −0.67 |
| Nigeria | 3.18 | 449.05 | 87.69 | 2099.86 | −1.51 | −1.99 |
| Brunei Darussalam | 3.02 | 56.55 | 91.51 | 29 177.48 | −0.73 | −0.12 |
| Chad | 2.98 | 11.30 | 81.44 | 690.87 | −4.42 | −2.71 |
| Venezuela | 2.92 | 178.51 | 84.28 | Not Available | −0.31 | −0.74 |
| Kuwait | 2.92 | 479.84 | 90.00 | 29 599.34 | −0.75 | −0.63 |
| Algeria | 2.91 | 299.23 | 93.75 | 3898.94 | −1.27 | −1.36 |
| Qatar | 2.77 | 571.76 | 86.98 | 58 919.32 | −1.71 | −0.99 |
| Turkmenistan | 2.49 | 71.46 | 87.21 | 6888.55 | −0.17 | −0.98 |
| Saudi Arabia | 2.42 | 1592.41 | 74.14 | 21 453.67 | −1.04 | −0.32 |
| Timor-Leste | 2.25 | 0.63 | 69.09 | 1385.77 | −2.05 | −0.35 |
| Gabon | 2.19 | 32.41 | 64.23 | 7364.51 | −2.51 | −1.12 |
| Oman | 2.16 | 240.97 | 69.68 | 17 047.08 | −1.22 | −0.71 |
| Kazakhstan | 2.09 | 343.43 | 63.78 | 9141.98 | −1.18 | −1.22 |
| Iran | 1.99 | 369.01 | 63.00 | 3981.87 | −0.85 | −0.74 |
| Br. Indian Ocean Terr. | 1.73 | 0.16 | 54.42 | Not Available | −0.90 | 0.33 |
| Congo | 1.53 | 49.64 | 49.38 | 2208.69 | −2.32 | −1.19 |
| Norway | 1.52 | 580.71 | 55.28 | 74 254.91 | −0.90 | −0.42 |
| Russian Federation | 1.47 | 2130.54 | 57.93 | 10 467.39 | −0.78 | −0.52 |
| Yemen | 1.44 | 6.89 | 46.56 | 958.38 | −1.41 | −2.02 |
| Trinidad and Tobago | 1.40 | 46.02 | 53.31 | 16 305.01 | −1.61 | −1.34 |
| Colombia | 1.38 | 203.33 | 54.26 | 6147.32 | −1.12 | −0.70 |
| Bonaire | 1.13 | 0.12 | 66.64 | Not Available | −0.53 | −0.64 |
| Cameroon | 1.12 | 17.64 | 40.52 | 1507.63 | −1.43 | −1.04 |
| Papua New Guinea | 1.11 | 41.80 | 42.63 | 2716.75 | −1.55 | −1.87 |
| Ecuador | 0.88 | 72.13 | 35.01 | 6078.49 | −0.92 | −0.60 |
| United Arab Emirates | 0.84 | 932.20 | 41.47 | 40 322.40 | −0.09 | −0.29 |
| Aruba | 0.62 | 0.83 | 39.63 | 29 352.08 | −0.13 | −0.21 |
| Curaçao | 0.60 | 3.60 | 44.28 | 19 018.16 | −0.37 | −0.69 |
| Saint Vincent and the Grenadines | 0.59 | 0.63 | 29.35 | 7277.43 | 0.52 | −0.32 |
| Mozambique | 0.55 | 24.90 | 37.38 | 469.77 | −0.90 | −1.56 |
| Mongolia | 0.54 | 25.93 | 34.84 | 3993.63 | −0.82 | −1.76 |
| Bolivia (Plurinational State of) | 0.54 | 26.19 | 31.54 | 3332.31 | −2.18 | −1.04 |
| Myanmar | 0.50 | 55.89 | 29.30 | 1255.32 | −0.60 | −0.97 |
| Australia | 0.48 | 774.30 | 30.92 | 53 512.98 | −0.87 | −0.85 |
| Togo | 0.46 | 9.45 | 37.88 | 868.74 | 0.95 | 0.12 |
| Bahrain | 0.35 | 43.99 | 35.98 | 22 879.85 | 0.13 | −0.33 |
| Canada | 0.30 | 1269.66 | 31.52 | 44 725.29 | −0.85 | 0.28 |
| Gibraltar | 0.28 | 1.08 | 47.31 | Not Available | −0.17 | 1.59 |
| Ghana | 0.26 | 34.82 | 19.78 | 2151.85 | −0.93 | −0.46 |
| Dem. People's Rep. of Korea | 0.22 | 3.18 | 29.77 | Not Available | 0.57 | 0.61 |
| Egypt | 0.22 | 76.91 | 22.34 | 3017.92 | −0.34 | −0.44 |
| Greece | 0.16 | 100.15 | 28.84 | 18 590.33 | 0.34 | −0.42 |
| Maldives | 0.13 | 0.57 | 21.76 | 9310.32 | 0.01 | −0.42 |
| Sudan | 0.12 | 7.55 | 16.78 | 783.89 | −2.48 | −2.37 |
Note: The Brown Lock-in Index (BLI) constitutes our baseline measure of lock-in to brown exports. It is computed as  where
where  is the share of each brown product in overall export values, and
  is the Product Complexity Index normalized to take a value between 0 and 1. The table shows the 50 countries with the highest BLI.
Table 10. Countries ranking most highly on the Brown Complexity Index.
| Country | BCI | Brown exports [1M USD] | Brown Export Share [%] | GDP per capita [USD] | Transition Outlook | Green Transition Outlook |
|---|---|---|---|---|---|---|
| USA | 4.93 | 2462.74 | 17.11 | 62 013.69 | −0.52 | 0.46 |
| Japan | 4.27 | 1257.50 | 18.67 | 39 814.17 | −0.24 | 0.67 |
| Germany | 3.95 | 1824.49 | 13.21 | 45 520.66 | 0.02 | 0.97 |
| Belgium | 3.73 | 460.61 | 14.92 | 45 068.76 | −0.41 | 0.33 |
| Netherlands | 3.67 | 718.24 | 14.26 | 50 490.97 | −0.44 | 0.09 |
| France | 3.24 | 468.56 | 8.99 | 39 380.82 | 0.27 | 0.78 |
| United Kingdom | 3.03 | 802.30 | 19.29 | 42 026.79 | −0.05 | 0.88 |
| Rep. of Korea | 2.84 | 871.01 | 15.49 | 31 579.38 | −0.19 | 0.32 |
| Thailand | 2.76 | 321.74 | 13.03 | 6977.58 | 0.07 | 0.41 |
| India | 2.48 | 488.12 | 15.91 | 1947.72 | 0.43 | −0.05 |
| Spain | 2.39 | 534.73 | 17.27 | 28 314.84 | 0.14 | 0.02 |
| Italy | 2.22 | 434.85 | 8.74 | 32 645.50 | 0.92 | 1.03 |
| Austria | 2.02 | 147.49 | 9.11 | 48 550.29 | 0.30 | 1.22 |
| China | 1.91 | 652.10 | 2.60 | 9479.06 | 0.88 | −0.19 |
| Poland | 1.67 | 189.41 | 7.87 | 14 646.76 | 0.74 | 0.63 |
| Finland | 1.62 | 98.55 | 14.24 | 47 483.98 | 0.54 | 1.37 |
| Canada | 1.62 | 1269.66 | 31.52 | 44 725.29 | −0.85 | 0.28 |
| Singapore | 1.61 | 507.49 | 16.89 | 62 028.43 | −0.47 | 0.28 |
| Turkey | 1.44 | 222.47 | 12.58 | 9719.31 | 0.80 | 0.17 |
| Portugal | 1.40 | 76.23 | 11.80 | 22 094.78 | 0.48 | 0.10 |
| Hungary | 1.34 | 165.05 | 14.31 | 15 374.97 | 0.36 | 1.45 |
| Russian Federation | 1.31 | 2130.54 | 57.93 | 10 467.39 | −0.78 | −0.52 |
| Czechia | 1.26 | 220.90 | 11.88 | 21 844.52 | 0.63 | 1.11 |
| Indonesia | 1.25 | 392.90 | 21.41 | 3859.81 | −0.52 | −0.46 |
| Slovenia | 1.21 | 38.85 | 10.97 | 24 536.80 | 0.89 | 1.35 |
| United Arab Emirates | 1.07 | 932.20 | 41.47 | 40 322.40 | −0.09 | −0.29 |
| South Africa | 1.05 | 177.88 | 16.75 | 6346.73 | −0.24 | 0.10 |
| Saudi Arabia | 1.03 | 1592.41 | 74.14 | 21 453.67 | −1.04 | −0.32 |
| Sweden | 1.01 | 214.53 | 14.07 | 52 911.91 | 0.52 | 1.56 |
| Brazil | 0.95 | 314.56 | 14.47 | 8696.90 | −0.58 | 0.01 |
| Iran | 0.92 | 369.01 | 63.00 | 3981.87 | −0.85 | −0.74 |
| Slovakia | 0.91 | 202.41 | 23.43 | 18 389.28 | 0.08 | 1.13 |
| Mexico | 0.84 | 959.84 | 22.13 | 9199.81 | 0.26 | 1.74 |
| Romania | 0.81 | 65.12 | 8.68 | 11 710.00 | 0.30 | 0.95 |
| Lithuania | 0.80 | 43.68 | 14.10 | 18 165.61 | 0.41 | 0.76 |
| Grenada | 0.67 | 0.01 | 3.81 | 10 067.39 | 0.61 | 1.06 |
| Belarus | 0.66 | 71.87 | 24.71 | 6089.46 | −0.07 | 0.48 |
| Israel | 0.62 | 29.40 | 4.99 | 41 657.61 | −0.12 | 0.13 |
| Denmark | 0.61 | 50.99 | 5.14 | 58 941.02 | 0.71 | 0.91 |
| Philippines | 0.52 | 16.98 | 1.99 | 3246.64 | 0.40 | −0.29 |
| Brunei Darussalam | 0.49 | 56.55 | 91.51 | 29 177.48 | −0.73 | −0.12 |
| Oman | 0.48 | 240.97 | 69.68 | 17 047.08 | −1.22 | −0.71 |
| Ukraine | 0.43 | 11.92 | 2.42 | 3061.80 | 0.52 | 0.23 |
| Norway | 0.40 | 580.71 | 55.28 | 74 254.91 | −0.90 | −0.42 |
| Argentina | 0.39 | 78.12 | 13.07 | 11 566.82 | −0.77 | −0.20 |
| Latvia | 0.35 | 9.55 | 6.47 | 16 697.55 | 0.40 | 0.05 |
| Egypt | 0.33 | 76.91 | 22.34 | 3017.92 | −0.34 | −0.44 |
| Guam | 0.31 | 0.02 | 5.78 | 36 407.51 | −0.06 | 0.17 |
| Cyprus | 0.27 | 7.67 | 16.63 | 27 456.57 | −0.02 | −0.07 |
| Serbia | 0.25 | 13.92 | 7.34 | 6889.57 | 0.54 | 0.91 |
Note: The Brown Complexity Index (BCI) forms a direct counterpart to the Green Complexity Index (GCI) and measures the number and complexity of brown products a country is competitive in. It is computed as  . Export capabilities in more technologically sophisticated activities may take longer to develop and bring greater benefits to the economy. However, by opening up a greater number of diversification paths they are likely associated with easier transition pathways. The table shows the 50 countries with the highest BCI.
Table 11. Key relationships.
| Variable 1 | Variable 2 | Correlation |
|---|---|---|
| Brown Complexity Index | Brown Diversity Share | 0.04 |
| Brown Complexity Index | Brown Export Diversity | 0.99 |
| Brown Complexity Index | Brown Export Share (%) | 0.00 |
| Brown Complexity Index | Diversity | 0.78 |
| Brown Complexity Index | Economic Complexity Index | 0.62 |
| Brown Complexity Index | GDP per capita (USD) | 0.39 |
| Brown Complexity Index | Green Complexity Index | 0.80 |
| Brown Diversity Share | Diversity | −0.26 |
| Brown Export Diversity | Diversity | 0.77 |
| Brown Export Share (%) | Diversity | −0.25 |
| Brown Lock-in Index | Brown Diversity Share | 0.72 |
| Brown Lock-in Index | Brown Export Diversity | 0.00 |
| Brown Lock-in Index | Brown Export Share (%) | 0.98 |
| Brown Lock-in Index | Diversity | −0.30 |
| Brown Lock-in Index | Economic Complexity Index | −0.33 |
| Brown Lock-in Index | GDP per capita (USD) | −0.03 |
| Brown Lock-in Index | Green Complexity Index | −0.25 |
| Green Complexity Index | Diversity | 0.88 |
| Green Complexity Index | Green Export Diversity | 0.99 |
| Green Export Diversity | Diversity | 0.90 |
Note: The table shows correlation coefficients between our key indices, as well as the indices and other relevant measures such as export diversity and GDP per capita.
Table 12. Changes in the relative share of carbon capture and storage technologies.
| (1) ΔExport Share | (2) ΔRCA | |
|---|---|---|
| Δ Export Share, Refined (%) | −0.005* | −0.005* |
| (0.003) | (0.003) | |
| Δ Export Share, Natural Gas (%) | −0.004** | −0.004** |
| (0.002) | (0.002) | |
| Δ Export Share, LNG (%) | −0.003 | −0.003* |
| (0.002) | (0.002) | |
| Δ Export Share, Coal (%) | −0.017*** | −0.016*** |
| (0.005) | (0.004) | |
| Δ Export Share, Crude (%) | −0.000 | −0.000 |
| (0.002) | (0.002) | |
| Year FEs | Yes | Yes |
| Observations | 823 | 823 |
| R2 | .005 99 | .004 57 |
*p<0.1; **p<0.05; ***p<0.01.Linear regression. Dependent variables relate to carbon capture and storage.Linear regression. Cluster-robust standard errors in parentheses. Note: The table reports results of a linear regression of changes in the export share and Revealed Comparative Advantage in CCUS products on changes in the shares of selected fossil fuels. Standard errors are clustered at the country level.
where δt are year dummies, and ε is the error term. Standard errors are clustered at the country level.
Appendix D: Supplementary figures
Products on our brown list account for a significantly larger share of global trade than green products. However, our results suggest that trade in brown products declined somewhat in the last period (2016–2020) compared to the penultimate period (2011–2015). Figure 4 indicates that 'brown' trade peaked at close to 40 billion USD (about 22% of global trade) during the 2011–2015 period and declined slightly thereafter. While this may be partly attributable to the global covid-19 pandemic, it is noteworthy that volumes of green trade continued to rise during the same time period.

Figure 4. Global trends in green and brown trade.
Download figure:
Standard image High-resolution imageFigure 5 plots the top 10 exporters in terms of trade values for green and brown products. Strikingly, China rose to the top of this ranking for green products during the early 2000s, but does not appear within the top 10 exporters of brown products—unlike the United States, Germany, Japan, the United Kingdom, Canada, South Korea and Mexico, all of which appear alongside petrostates such as Russia, Saudi Arabia and the UAE.

Figure 5. Top 10 exporters of green and brown products.
Download figure:
Standard image High-resolution imageTable 13 lists the 20 brown products with the highest PCI and their descriptions, while table 14 shows those with the lowest PCI. Brown products which are high in complexity include engines, pumps and various hydrocarbon-derived chemicals, while low-complexity brown products more prominently feature unprocessed hydrocarbons.
Table 13. Top 20 brown products in terms of PCI.
| HS 1992 | Description | PCI | Transition Outlook | Green Transition Outlook |
|---|---|---|---|---|
| 290270 | Cyclic hydrocarbons; cumene | 1.75 | 0.99 | 1.08 |
| 290323 | Unsaturated chlorinated derivatives of acyclic hydrocarbons; tetrachloroethylene (perchloroethylene) | 1.66 | 0.99 | 1.22 |
| 340319 | Lubricating preparations; (other than for the treatment of textile and similar materials), containing less than 70% (by weight) of petroleum oils or oils obtained from bituminous minerals | 1.62 | 1.00 | 1.40 |
| 290314 | Saturated chlorinated derivatives of acyclic hydrocarbons; carbon tetrachloride | 1.59 | 1.00 | 1.07 |
| 391110 | Petroleum resins, coumarone, indene or coumarone-indene resins and polyterpenes; in primary forms | 1.53 | 1.00 | 1.14 |
| 840790 | Engines; rotary internal combustion piston engines, for other than aircraft or marine propulsion | 1.41 | 1.00 | 1.17 |
| 270720 | Oils and products of the distillation of high temperature coal tar; toluole | 1.41 | 0.99 | 1.06 |
| 870323 | Vehicles; spark-ignition internal combustion reciprocating piston engine, cylinder capacity exceeding 1500 cc but not exceeding 3000 cc | 1.41 | 0.99 | 1.50 |
| 290123 | Acyclic hydrocarbons; unsaturated, butene (butylene) and isomers thereof | 1.38 | 0.99 | 1.15 |
| 290313 | Saturated chlorinated derivatives of acyclic hydrocarbons; chloroform (trichloromethane) | 1.37 | 0.99 | 1.17 |
| 290315 | Saturated chlorinated derivatives of acyclic hydrocarbons; 1,2-dichloroethane (ethylene dichloride) | 1.36 | 0.99 | 1.15 |
| 841690 | Furnaces; parts of furnace burners, for liquid fuel, pulverized solid fuel or gas, mechanical stokers, grates, ash dischargers and the like | 1.31 | 1.00 | 1.44 |
| 840820 | Engines; compression-ignition internal combustion piston engines (diesel or semi-diesel engines), of a kind used for the propulsion of vehicles of chapter 87 | 1.27 | 1.00 | 1.39 |
| 290312 | Saturated chlorinated derivatives of acyclic hydrocarbons; dichloromethane (methylene chloride) | 1.27 | 1.00 | 1.17 |
| 840890 | Engines; compression-ignition internal combustion piston engines (diesel or semi-diesel engines), of a kind used for other than marine propulsion or the vehicles of chapter 87 | 1.27 | 1.00 | 1.43 |
| 841620 | Furnaces; furnace burners, for pulverized solid fuel or gas, including combination burners | 1.23 | 1.00 | 1.47 |
| 290260 | Cyclic hydrocarbons; ethylbenzene | 1.22 | 0.99 | 1.26 |
| 270730 | Oils and products of the distillation of high temperature coal tar; xylole | 1.21 | 0.99 | 1.03 |
| 290330 | Fluorinated, brominated or iodinated derivatives of acyclic hydrocarbons | 1.21 | 0.99 | 1.11 |
| 290361 | Halogenated derivatives of aromatic hydrocarbons; chlorobenzene, o-dichlorobenzene and p-dichlorobenzene | 1.17 | 1.00 | 1.07 |
Note: The table lists the 20 products with the highest PCI across the (narrow) brown list.
Table 14. Bottom 20 brown products in terms of PCI.
| HS 1992 | Description | PCI | Transition Outlook | Green Transition Outlook |
|---|---|---|---|---|
| 270900 | Oils; petroleum oils and oils obtained from bituminous minerals, crude | −2.60 | 0.98 | 0.89 |
| 271111 | Petroleum gases and other gaseous hydrocarbons; liquefied, natural gas | −2.29 | 0.99 | 0.82 |
| 271129 | Petroleum gases and other gaseous hydrocarbons; in gaseous state, other than natural gas | −2.14 | 1.00 | 0.90 |
| 271121 | Petroleum gases and other gaseous hydrocarbons; in gaseous state, natural gas | −1.79 | 0.98 | 0.81 |
| 271119 | Petroleum gases and other gaseous hydrocarbons; liquefied, n.e.s. in heading no. 2711 | −1.74 | 0.99 | 0.95 |
| 270119 | Coal; (other than anthracite and bituminous), whether or not pulverised but not agglomerated | −1.62 | 0.99 | 0.83 |
| 270500 | Gases; coal, water, producer and similar gases (excluding petroleum and other gaseous hydrocarbons) | −1.59 | 1.00 | 1.03 |
| 271113 | Petroleum gases and other gaseous hydrocarbons; liquefied, butanes | −1.58 | 0.99 | 1.08 |
| 271112 | Petroleum gases and other gaseous hydrocarbons; liquefied, propane | −1.49 | 0.98 | 0.97 |
| 270740 | Oils and products of the distillation of high temperature coal tar; naphthalene | −1.41 | 1.00 | 1.08 |
| 270112 | Coal; bituminous, whether or not pulverised, but not agglomerated | −1.30 | 0.98 | 0.96 |
| 870432 | Vehicles; spark-ignition internal combustion piston engine, for transport of goods, (of a g.v.w. exceeding 5 tonnes), nes in item no 8704.1 | −1.29 | 1.00 | 1.33 |
| 271311 | Petroleum coke; (not calcined), obtained from bituminous minerals | −1.26 | 0.99 | 0.97 |
| 270111 | Coal; anthracite, whether or not pulverised, but not agglomerated | −1.04 | 1.00 | 0.86 |
| 840710 | Engines; for aircraft, spark-ignition reciprocating or rotary internal combustion piston engines | −0.99 | 1.00 | 1.02 |
| 271210 | Petroleum jelly | −0.88 | 1.00 | 1.10 |
| 271000 | Oils; petroleum oils and oils obtained from bituminous minerals, not crude; preparations n.e.s., containing by weight 70% or more of petroleum oils or oils obtained from bituminous minerals | −0.82 | 1.00 | 1.07 |
| 850212 | Electric generating sets; with compression-ignition internal combustion piston engines (diesel or semi-diesel engines), of an output exceeding 75 kva but not exceeding 375 kva | −0.81 | 1.00 | 1.02 |
| 850213 | Electric generating sets; with compression-ignition internal combustion piston engines (diesel or semi-diesel engines), of an output exceeding 375 kva | −0.79 | 1.00 | 1.11 |
| 843039 | Coal or rock cutters and tunnelling machinery; not self-propelled | −0.66 | 1.00 | 1.36 |
Note: The table lists the 20 products with the lowest PCI across the brown (narrow) list.
Appendix E: Extension: long list of brown products
Table 15. Correlates of brown dependence measures.
| (1) BLI (Full) | (2) BLI (Full) | (3) BLI (Full) | (4) BCI (Full) | (5) BCI (Full) | (6) BCI (Full) | |
|---|---|---|---|---|---|---|
| GDP per capita (current USD) (log) | 0.078* | −0.056 | 0.068 | 0.325*** | 0.219** | 0.216 |
| (0.041) | (0.066) | (0.079) | (0.054) | (0.098) | (0.165) | |
| Coal rents (% of GDP) | 0.006 | 0.047 | ||||
| (0.032) | (0.089) | |||||
| Oil rents (% of GDP) | 0.070*** | −0.026*** | ||||
| (0.006) | (0.005) | |||||
| Natural gas rents (% of GDP) | 0.050** | −0.019 | ||||
| (0.024) | (0.015) | |||||
| CO2 emissions (metric tons per capita, log) | 0.228* | 0.366** | ||||
| (0.127) | (0.158) | |||||
| RTA, Environment-related Technologies | 1.661 | 1.029 | ||||
| (1.114) | (1.660) | |||||
| RTA, Energy-related Mitigation Technologies | −0.500 | −3.077** | ||||
| (1.133) | (1.412) | |||||
| RTA, Carbon Capture and Storage | 3.476*** | −4.730* | ||||
| (0.711) | (2.533) | |||||
| RTA, Climate Change Adaptation Technologies | 0.805 | −1.070* | ||||
| (0.676) | (0.555) | |||||
| RTA, Transport-related Mitigation Technologies | −2.500** | 2.399 | ||||
| (0.992) | (2.627) | |||||
| Year FEs | Yes | Yes | Yes | Yes | Yes | Yes |
| Observations | 933 | 854 | 222 | 933 | 854 | 222 |
| R2 | .0139 | .659 | .186 | .22 | .347 | .191 |
*p<0.1; **p<0.05; ***p<0.01.Linear regression. Cluster-robust standard errors in parentheses.The label (log) refers to the natural logarithm of 1 + the variable in question.Dependent variables relate to brown list (broad). Note: Like table 4, but using the long list of brown products.
Table 16. Predictive power of Green Transition Outlook.
| (1) BLI (Full) | (2) BLI (Full) | (3) BCI (Full) | (4) BCI (Full) | |
|---|---|---|---|---|
| Brown Lock-in Index (full list, t − 1) | 0.915*** | 0.906*** | ||
| (0.025) | (0.031) | |||
| Green Transition Outlook (t − 1) | −0.028 | −0.011 | −0.018* | −0.013 |
| (0.020) | (0.021) | (0.010) | (0.011) | |
| GDP per capita (current USD, log, t − 1) | 0.007 | −0.005 | 0.025*** | 0.025 |
| (0.010) | (0.018) | (0.007) | (0.018) | |
| Coal rents (% of GDP, t − 1) | 0.028** | −0.001 | ||
| (0.014) | (0.009) | |||
| Oil rents (% of GDP, t − 1) | 0.005** | −0.001 | ||
| (0.002) | (0.001) | |||
| Natural gas rents (% of GDP, t − 1) | 0.010*** | −0.001 | ||
| (0.003) | (0.001) | |||
| CO2 emissions (metric tons per capita, log, t − 1) | 0.023 | 0.020 | ||
| (0.029) | (0.028) | |||
| Brown Complexity Index (t − 1) | 0.950*** | 0.938*** | ||
| (0.014) | (0.015) | |||
| Year FEs | Yes | Yes | Yes | Yes |
| Observations | 715 | 661 | 715 | 661 |
| R2 | .86 | .884 | .922 | .926 |
*p<0.1; **p<0.05; ***p<0.01.Linear regression. Cluster-robust standard errors in parenthesis.The label (log) refers to the natural logarithm of 1 + the variable in question.Dependent variables relate to brown list (broad). t − 1 refers to the previous period's value. Note: Like table 5, but using the long list of brown products.
Table 17. Predictive power of overall Transition Outlook.
| (1) BLI (Full) | (2) BLI (Full) | (3) BCI (Full) | (4) BCI (Full) | |
|---|---|---|---|---|
| Brown Lock-in Index (full list, t − 1) | 0.902*** | 0.901*** | ||
| (0.024) | (0.030) | |||
| Overall Transition Outlook (t − 1) | −0.060*** | −0.029* | 0.006 | 0.009 |
| (0.019) | (0.017) | (0.009) | (0.012) | |
| GDP per capita (current USD, log, t − 1) | 0.000 | −0.007 | 0.024*** | 0.024 |
| (0.008) | (0.018) | (0.007) | (0.018) | |
| Coal rents (% of GDP, t − 1) | 0.027** | 0.001 | ||
| (0.013) | (0.010) | |||
| Oil rents (% of GDP, t − 1) | 0.004** | −0.000 | ||
| (0.002) | (0.001) | |||
| Natural gas rents (% of GDP, t − 1) | 0.009*** | −0.000 | ||
| (0.003) | (0.001) | |||
CO2 emissions (metric tons per capita, log,  ) ) | 0.021 | 0.018 | ||
| (0.029) | (0.028) | |||
| Brown Complexity Index (t − 1) | 0.945*** | 0.937*** | ||
| (0.014) | (0.015) | |||
| Year FEs | Yes | Yes | Yes | Yes |
| Observations | 715 | 661 | 715 | 661 |
| R2 | .862 | .884 | .922 | .926 |
*p<0.1; **p<0.05; ***p<0.01.Linear regression. Cluster-robust standard errors in parentheses.The label (log) refers to the natural logarithm of 1 + the variable in question.Dependent variables relate to brown list (broad). t − 1 refers to the previous period's value. Note: Like table 6, but using the long list of brown products.
Appendix F: Extension: alternative BLI using binary RCA
As an extension of our baseline analysis, we compute the Brown Lock-in Index using binary RCA, instead of product shares in country exports. This alternative version of BLI is calculated as

This is a more direct inverse of the GCI: it is computed in exactly the same manner, but using brown instead of green products and attributing greater weight to less, rather than more, complex products. The index is positively associated with overall export diversity and a larger number of diversification paths, making our baseline BLI the preferred measure for brown lock-in.
Our key result here is that when BLI is computed in this manner, it displays a strong positive correlation to BCI—which, as we have shown, correlates positively with GCI, a relationship apparently driven by higher export diversity and the 'weighted count' nature of these indices. Figure 6 plots our baseline and alternative measures of BLI against the BCI, underscoring this finding. The correlation between BCI and the alternative measure of BLI indicates that the weighting by either PCI or inverse PCI plays a secondary role to the diversity aspect (the number of competitive exports within a product group) when a country's rank is computed. Countries with an unusually high share of brown exports in overall export volumes tend to have low export diversity, including within the group of brown products, as well as low export complexity. In contrast, countries which score high on our alternative BLI or BCI measures export a greater number of brown products with RCA > 1, and the ranking of countries is similar regardless of whether we give a higher relative weight to products with high or low complexity, as tables 10 and 18 show. In both cases, the United States score most highly and a number of industrialized countries feature among the top 20 countries. However, some petrostates—such as Russia, the UAE, Saudi Arabia and Iran—score highly on our alternative BLI, but not BCI, suggesting that these countries export a variety of low-complexity brown products, but not high-complexity ones.
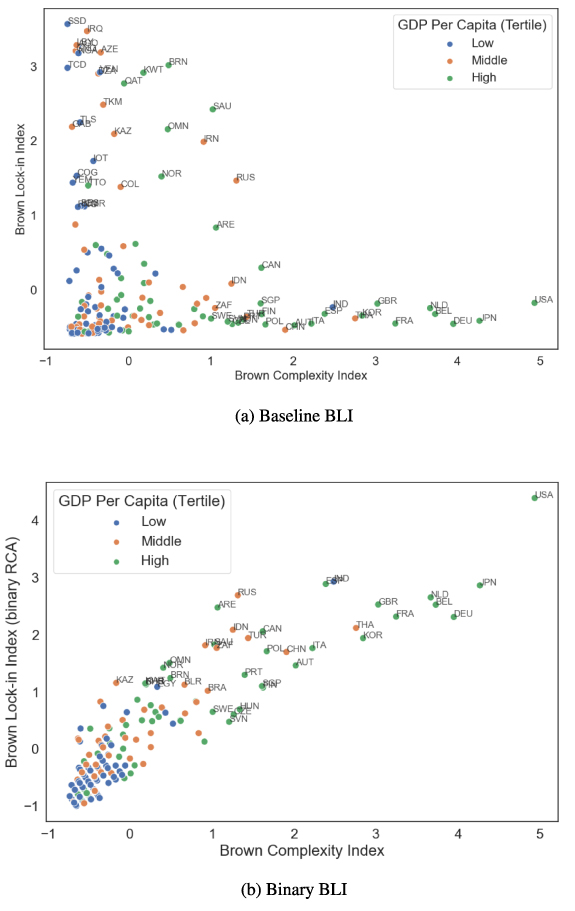
Figure 6. Baseline and alternative measures of BLI, plotted against BCI.
Download figure:
Standard image High-resolution image
Table 18. Alternative BLI top 20.
| Country | GDP per capita [USD] | BLI (binary) | Brown exports [1M USD] | Brown Export Share [%] | Transition Outlook | Green Transition Outlook |
|---|---|---|---|---|---|---|
| USA | 62 013.69 | 4.39 | 2462.74 | 17.11 | −0.52 | 0.46 |
| India | 1947.72 | 2.93 | 488.12 | 15.91 | 0.43 | −0.05 |
| Spain | 28 314.84 | 2.89 | 534.73 | 17.27 | 0.14 | 0.02 |
| Japan | 39 814.17 | 2.86 | 1257.50 | 18.67 | −0.24 | 0.67 |
| Russian Federation | 10 467.39 | 2.69 | 2130.54 | 57.93 | −0.78 | −0.52 |
| Netherlands | 50 490.97 | 2.65 | 718.24 | 14.26 | −0.44 | 0.09 |
| United Kingdom | 42 026.79 | 2.53 | 802.30 | 19.29 | −0.05 | 0.88 |
| Belgium | 45 068.76 | 2.53 | 460.61 | 14.92 | −0.41 | 0.33 |
| United Arab Emirates | 40 322.40 | 2.48 | 932.20 | 41.47 | −0.09 | −0.29 |
| France | 39 380.82 | 2.32 | 468.56 | 8.99 | 0.27 | 0.78 |
| Germany | 45 520.66 | 2.31 | 1824.49 | 13.21 | 0.02 | 0.97 |
| Thailand | 6977.58 | 2.12 | 321.74 | 13.03 | 0.07 | 0.41 |
| Indonesia | 3859.81 | 2.09 | 392.90 | 21.41 | −0.52 | −0.46 |
| Canada | 44 725.29 | 2.06 | 1269.66 | 31.52 | −0.85 | 0.28 |
| Turkey | 9719.31 | 1.94 | 222.47 | 12.58 | 0.80 | 0.17 |
| Rep. of Korea | 31 579.38 | 1.94 | 871.01 | 15.49 | −0.19 | 0.32 |
| Saudi Arabia | 21 453.67 | 1.83 | 1592.41 | 74.14 | −1.04 | −0.32 |
| Iran | 3981.87 | 1.82 | 369.01 | 63.00 | −0.85 | −0.74 |
| South Africa | 6346.73 | 1.77 | 177.88 | 16.75 | −0.24 | 0.10 |
| Italy | 32 645.50 | 1.77 | 434.85 | 8.74 | 0.92 | 1.03 |
Note: The Brown Lock-in Index is here computed as  .
.
Table 19. Correlates of brown dependence measures.
| (1) BLI (binary) | (2) BLI (binary) | (3) BLI (binary) | (4) BCI | (5) BCI | (6) BCI | |
|---|---|---|---|---|---|---|
| GDP per capita (current USD) (log) | 0.297*** | 0.040 | 0.070 | 0.321*** | 0.180* | 0.204 |
| (0.047) | (0.090) | (0.153) | (0.055) | (0.100) | (0.159) | |
| Coal rents (% of GDP) | 0.049 | 0.008 | ||||
| (0.127) | (0.086) | |||||
| Oil rents (% of GDP) | −0.011** | −0.025*** | ||||
| (0.005) | (0.005) | |||||
| Natural gas rents (% of GDP) | −0.016 | −0.017 | ||||
| (0.016) | (0.015) | |||||
| CO2 emissions (metric tons per capita, log) | 0.636***(0.145) | 0.421***(0.159) | ||||
| RTA, Environment-related Technologies | 0.926 | 1.271 | ||||
| (1.792) | (1.809) | |||||
| RTA, Energy-related Mitigation Technologies | −2.166(1.398) | −3.280**(1.498) | ||||
| RTA, Carbon Capture and Storage | −3.453 | −4.977* | ||||
| (2.370) | (2.660) | |||||
| RTA, Climate Change Adaptation Technologies | −0.564 (0.595) | −1.061* (0.556) | ||||
| RTA, Transport-related Mitigation Technologies | 0.261 (2.101) | 2.730 (2.748) | ||||
| Year FEs | Yes | Yes | Yes | Yes | Yes | Yes |
| Observations | 933 | 854 | 222 | 933 | 854 | 222 |
| R2 | .194 | .32 | .0924 | .212 | .324 | .171 |
*p<0.1; **p<0.05; ***p<0.01.Linear regression. Cluster-robust standard errors in parentheses.The label (log) refers to the natural logarithm of 1 + the variable in question.Dependent variables relate to brown list (narrow).
Note: Like table 4, except that the Brown Lock-in Index is here computed as  .
.
Tables 20 and 21 show that our Transition Outlook measures are not predictive of future changes in binary BLI.
Table 20. Predictive power of Green Transition Outlook.
| (1) BLI (binary) | (2) BLI (binary) | (3) BCI | (4) BCI | |
|---|---|---|---|---|
| Brown Lock-in Index (binary RCA, t − 1) | 0.895*** | 0.880*** | ||
| (0.022) | (0.024) | |||
| Green Transition Outlook (t − 1) | −0.016 | −0.001 | −0.024** | −0.021** |
| (0.013) | (0.014) | (0.009) | (0.010) | |
| GDP per capita (current USD, log, t − 1) | 0.039*** | 0.037* | 0.023*** | 0.021 |
| (0.011) | (0.022) | (0.007) | (0.017) | |
| Coal rents (% of GDP, t − 1) | 0.029 | 0.002 | ||
| (0.019) | (0.010) | |||
| Oil rents (% of GDP, t − 1) | 0.001 | −0.001 | ||
| (0.001) | (0.001) | |||
| Natural gas rents (% of GDP, t − 1) | 0.001 | −0.001 | ||
| (0.002) | (0.001) | |||
 emissions (metric tons per capita, log, t − 1) emissions (metric tons per capita, log, t − 1) | 0.023 | 0.020 | ||
| (0.037) | (0.027) | |||
| Brown Complexity Index (t − 1) | 0.956*** | 0.947*** | ||
| (0.015) | (0.016) | |||
| Year FEs | Yes | Yes | Yes | Yes |
| Observations | 715 | 661 | 715 | 661 |
| R2 | .843 | .849 | .926 | .93 |
*p<0.1; **p<0.05; ***p<0.01.Linear regression. Cluster-robust standard errors in parenthesis.The label (log) refers to the natural logarithm of 1 + the variable in question.
t − 1 refers to the previous period's value.
Note: Like table 5, except that the Brown Lock-in Index is here computed as  .
.
Table 21. Predictive power of overall Transition Outlook.
| (1) BLI (binary) | (2) BLI (binary) | (3) BCI | (4) BCI | |
|---|---|---|---|---|
| Brown Lock-in Index (binary RCA, t − 1) | 0.891*** | 0.881*** | ||
| (0.022) | (0.024) | |||
| Overall Transition Outlook (t − 1) | −0.009 | 0.003 | 0.005 | 0.010 |
| (0.013) | (0.017) | (0.009) | (0.012) | |
| GDP per capita (current USD, log, t − 1) | 0.037*** | 0.037* | 0.022*** | 0.020 |
| (0.011) | (0.022) | (0.007) | (0.017) | |
| Coal rents (% of GDP, t − 1) | 0.029 | 0.005 | ||
| (0.019) | (0.011) | |||
| Oil rents (% of GDP, t − 1) | 0.001 | −0.000 | ||
| (0.001) | (0.001) | |||
| Natural gas rents (% of GDP, t − 1) | 0.001 | −0.000 | ||
| (0.002) | (0.001) | |||
 emissions (metric tons per capita, log, t − 1) emissions (metric tons per capita, log, t − 1) | 0.023 | 0.019 | ||
| (0.037) | (0.027) | |||
| Brown Complexity Index (t − 1) | 0.948*** | 0.943*** | ||
| (0.015) | (0.016) | |||
| Year FEs | Yes | Yes | Yes | Yes |
| Observations | 715 | 661 | 715 | 661 |
| R2 | .843 | .849 | .926 | .93 |
*p<0.1; **p<0.05; ***p<0.01.Linear regression. Cluster-robust standard errors in parenthesis.The label (log) refers to the natural logarithm of 1 + the variable in question.
t − 1 refers to the previous period's value.
Note: Like table 6, except that the Brown Lock-in Index is here computed as  .
.
Table 22. Countries ranking most highly on the Brown Lock-in Index.
| Country | BLI | Brown exports [1M USD] | Brown Export Share [%] | GDP per capita [USD] | Transition Outlook | Green Transition Outlook |
|---|---|---|---|---|---|---|
| Iraq | 3.43 | 635.06 | 94.34 | 5115.69 | −0.48 | −0.83 |
| South Sudan | 3.37 | 13.49 | 91.06 | Not Available | −4.67 | −2.71 |
| Libya | 3.26 | 195.45 | 90.71 | 5810.85 | −2.46 | −2.57 |
| Angola | 3.20 | 307.47 | 87.87 | 3095.46 | −1.74 | −1.95 |
| Equatorial Guinea | 3.18 | 38.68 | 87.98 | 8897.39 | −2.15 | −2.38 |
| Azerbaijan | 3.16 | 148.25 | 88.81 | 4358.97 | −1.00 | −0.72 |
| Nigeria | 3.11 | 449.44 | 86.35 | 2099.86 | −1.49 | −2.15 |
| Brunei Darussalam | 2.93 | 60.42 | 91.25 | 29 177.48 | −0.81 | −0.16 |
| Algeria | 2.92 | 301.82 | 93.26 | 3898.94 | −1.47 | −1.45 |
| Chad | 2.89 | 11.30 | 80.07 | 690.87 | −4.67 | −2.71 |
| Kuwait | 2.86 | 481.19 | 88.85 | 29 599.34 | −1.14 | −0.73 |
| Venezuela | 2.82 | 178.86 | 82.68 | Not Available | −0.35 | −0.80 |
| Qatar | 2.81 | 571.86 | 86.56 | 58 919.32 | −1.63 | −0.92 |
| Br. Indian Ocean Terr. | 2.56 | 0.77 | 73.49 | Not Available | −0.87 | 0.13 |
| Turkmenistan | 2.52 | 71.58 | 83.74 | 6888.55 | −0.20 | −1.10 |
| Saudi Arabia | 2.39 | 1595.39 | 74.05 | 21 453.67 | −1.13 | −0.42 |
| Gabon | 2.13 | 32.43 | 63.37 | 7364.51 | −2.15 | −0.97 |
| Oman | 2.12 | 241.70 | 68.81 | 17 047.08 | −1.26 | −0.80 |
| Kazakhstan | 2.07 | 344.28 | 63.60 | 9141.98 | −1.40 | −1.05 |
| Iran | 1.97 | 375.71 | 63.13 | 3981.87 | −0.91 | −0.85 |
| Timor-Leste | 1.87 | 0.77 | 62.43 | 1385.77 | −2.11 | −0.42 |
| Norway | 1.56 | 580.79 | 55.25 | 74 254.91 | −0.99 | −0.53 |
| Bonaire | 1.55 | 0.44 | 78.77 | Not Available | −0.77 | −0.71 |
| Congo | 1.49 | 49.69 | 48.83 | 2208.69 | −1.59 | −0.83 |
| Russian Federation | 1.46 | 2130.54 | 57.91 | 10 467.39 | −0.87 | −0.50 |
| Trinidad and Tobago | 1.43 | 46.66 | 53.38 | 16 305.01 | −1.57 | −1.78 |
| Colombia | 1.37 | 203.38 | 54.13 | 6147.32 | −1.20 | −0.74 |
| Yemen | 1.37 | 7.02 | 45.37 | 958.38 | −1.33 | −2.17 |
| Papua New Guinea | 1.14 | 42.12 | 42.48 | 2716.75 | −1.76 | −1.96 |
| Cameroon | 1.13 | 19.04 | 41.27 | 1507.63 | −1.61 | −1.06 |
| Guyana | 1.09 | 11.75 | 38.82 | 6329.52 | −2.10 | −1.03 |
| Ecuador | 0.85 | 72.18 | 34.89 | 6078.49 | −0.96 | −0.67 |
| United Arab Emirates | 0.82 | 932.20 | 41.46 | 40 322.40 | −0.19 | −0.33 |
| Dem. People's Rep. of Korea | 0.67 | 7.57 | 38.52 | Not Available | 0.45 | 0.17 |
| Curaçao | 0.62 | 4.02 | 44.30 | 19 018.16 | −1.12 | −0.93 |
| Myanmar | 0.61 | 61.47 | 30.68 | 1255.32 | −0.83 | −0.80 |
| Bolivia (Plurinational State of) | 0.59 | 26.19 | 31.26 | 3332.31 | −2.06 | −1.41 |
| Mozambique | 0.55 | 24.98 | 36.21 | 469.77 | −0.78 | −1.31 |
| Mongolia | 0.53 | 25.96 | 34.38 | 3993.63 | −1.08 | −1.78 |
| Australia | 0.50 | 774.31 | 30.89 | 53 512.98 | −0.95 | −0.86 |
| Aruba | 0.47 | 1.15 | 33.84 | 29 352.08 | −0.21 | −0.33 |
| Togo | 0.43 | 9.47 | 37.42 | 868.74 | 0.96 | −0.21 |
| Maldives | 0.42 | 0.93 | 29.46 | 9310.32 | 0.12 | −0.60 |
| Saint Vincent and the Grenadines | 0.39 | 0.64 | 23.99 | 7277.43 | 0.13 | −0.25 |
| American Samoa | 0.32 | 0.24 | 27.39 | 11 824.79 | −0.26 | −0.71 |
| Bahrain | 0.31 | 44.12 | 35.40 | 22 879.85 | 0.08 | −0.51 |
| Canada | 0.28 | 1269.67 | 31.51 | 44 725.29 | −0.92 | 0.34 |
| Ghana | 0.24 | 34.84 | 19.65 | 2151.85 | −0.68 | 0.24 |
| Egypt | 0.22 | 78.75 | 22.67 | 3017.92 | −0.49 | −0.75 |
| Greece | 0.14 | 100.18 | 28.82 | 18 590.33 | 0.14 | −0.52 |
Note: Like table 9, but using an alternative averaging procedure.
Appendix G: Extension: alternative averaging procedure
The BACI database only records strictly non-negative trade flows to save space. For this reason we assume that missing exporter-year-product observations are 0 and include these in the 5-year averages used in our baseline estimates. As a robustness check, we also compile an alternative dataset in which missing exporter-year-product observations are treated as missing. This section reports key results using this procedure and shows that our country rankings and key regression results change only very marginally when doing so.
Table 23. Countries ranking most highly on the Brown Complexity Index.
| Country | BCI | Brown exports [1M USD] | Brown Export Share [%] | GDP per capita [USD] | Transition Outlook | Green Transition Outlook |
|---|---|---|---|---|---|---|
| USA | 4.97 | 2462.74 | 17.11 | 62 013.69 | −0.56 | 0.51 |
| Japan | 4.27 | 1257.50 | 18.67 | 39 814.17 | −0.25 | 0.73 |
| Germany | 3.93 | 1824.49 | 13.20 | 45 520.66 | −0.04 | 1.05 |
| Belgium | 3.78 | 460.61 | 14.90 | 45 068.76 | −0.48 | 0.39 |
| Netherlands | 3.64 | 718.24 | 14.25 | 50 490.97 | −0.51 | 0.09 |
| France | 3.28 | 468.56 | 8.98 | 39 380.82 | 0.19 | 0.83 |
| United Kingdom | 3.04 | 802.30 | 19.28 | 42 026.79 | −0.15 | 0.90 |
| Rep. of Korea | 2.80 | 871.01 | 15.49 | 31 579.38 | −0.24 | 0.34 |
| Thailand | 2.80 | 321.74 | 13.02 | 6977.58 | −0.01 | 0.49 |
| India | 2.39 | 488.12 | 15.91 | 1947.72 | 0.24 | −0.07 |
| Italy | 2.33 | 434.90 | 8.74 | 32 645.50 | 0.83 | 1.18 |
| Spain | 2.29 | 534.73 | 17.26 | 28 314.84 | 0.12 | 0.03 |
| Austria | 2.02 | 147.49 | 9.10 | 48 550.29 | 0.23 | 1.31 |
| China | 1.74 | 652.10 | 2.60 | 9479.06 | 0.77 | −0.06 |
| Poland | 1.66 | 189.41 | 7.87 | 14 646.76 | 0.69 | 0.69 |
| Canada | 1.62 | 1269.67 | 31.51 | 44 725.29 | −0.92 | 0.34 |
| Finland | 1.58 | 98.56 | 14.22 | 47 483.98 | 0.51 | 1.45 |
| Singapore | 1.57 | 507.52 | 16.88 | 62 028.43 | −0.52 | 0.30 |
| Turkey | 1.43 | 222.47 | 12.58 | 9719.31 | 0.73 | 0.19 |
| Portugal | 1.38 | 76.24 | 11.80 | 22 094.78 | 0.40 | 0.11 |
| Hungary | 1.37 | 165.06 | 14.30 | 15 374.97 | 0.31 | 1.58 |
| Czechia | 1.30 | 220.90 | 11.86 | 21 844.52 | 0.57 | 1.28 |
| Slovenia | 1.21 | 38.85 | 10.95 | 24 536.80 | 0.84 | 1.50 |
| Russian Federation | 1.20 | 2130.54 | 57.91 | 10 467.39 | −0.87 | −0.50 |
| Indonesia | 1.18 | 393.05 | 21.39 | 3859.81 | −0.61 | −0.44 |
| Grenada | 1.07 | 0.02 | 4.26 | 10 067.39 | 0.51 | 1.17 |
| Saudi Arabia | 1.05 | 1595.39 | 74.05 | 21 453.67 | −1.13 | −0.42 |
| United Arab Emirates | 1.03 | 932.20 | 41.46 | 40 322.40 | −0.19 | −0.33 |
| South Africa | 0.99 | 177.88 | 16.74 | 6346.73 | −0.36 | 0.09 |
| Sweden | 0.91 | 214.53 | 14.04 | 52 911.91 | 0.56 | 1.58 |
| Slovakia | 0.91 | 202.41 | 23.41 | 18 389.28 | −0.02 | 1.25 |
| Brazil | 0.88 | 314.64 | 14.46 | 8696.90 | −0.61 | −0.04 |
| Mexico | 0.88 | 960.02 | 22.13 | 9199.81 | 0.26 | 1.86 |
| Iran | 0.82 | 375.71 | 63.13 | 3981.87 | −0.91 | −0.85 |
| Romania | 0.78 | 65.18 | 8.68 | 11 710.00 | 0.26 | 1.00 |
| Lithuania | 0.77 | 43.72 | 14.07 | 18 165.61 | 0.34 | 0.80 |
| Oman | 0.63 | 241.70 | 68.81 | 17 047.08 | −1.26 | −0.80 |
| Saint Lucia | 0.60 | 0.37 | 25.76 | 10 629.27 | 0.64 | 0.48 |
| Belarus | 0.59 | 71.98 | 24.62 | 6089.46 | −0.09 | 0.47 |
| Denmark | 0.57 | 50.99 | 5.13 | 58 941.02 | 0.68 | 0.91 |
| Israel | 0.54 | 29.41 | 4.98 | 41 657.61 | −0.18 | 0.00 |
| Guam | 0.54 | 0.03 | 8.54 | 36 407.51 | −0.14 | −0.06 |
| Brunei Darussalam | 0.52 | 60.42 | 91.25 | 29 177.48 | −0.81 | −0.16 |
| Philippines | 0.49 | 17.23 | 1.98 | 3246.64 | 0.20 | −0.26 |
| Ukraine | 0.35 | 12.07 | 2.45 | 3061.80 | 0.43 | 0.26 |
| Argentina | 0.32 | 78.28 | 13.00 | 11 566.82 | −0.78 | −0.27 |
| Norway | 0.31 | 580.79 | 55.25 | 74 254.91 | −0.99 | −0.53 |
| Estonia | 0.31 | 18.53 | 11.22 | 21 629.33 | 0.28 | 0.26 |
| Latvia | 0.28 | 9.62 | 6.49 | 16 697.55 | 0.32 | 0.03 |
| Egypt | 0.25 | 78.75 | 22.67 | 3017.92 | −0.49 | −0.75 |
Note: Like table 10, but using an alternative averaging procedure.
Table 24. Correlates of Country Transition Outlook measures.
| (1) | (2) | (3) | (4) | (5) | (6) | |
|---|---|---|---|---|---|---|
| Overall | Overall | Overall | Green | Green | Green | |
| Brown Lock-in Index | −0.606*** | −0.597*** | ||||
| (0.068) | (0.060) | |||||
| GDP per capita (current USD) (log) | −0.060 | −0.027 | −0.071 | 0.116* | 0.073 | 0.009 |
| (0.050) | (0.060) | (0.059) | (0.063) | (0.069) | (0.056) | |
| Coal rents (% of GDP) | −0.088*** | −0.108*** | −0.105*** | −0.089*** | −0.105** | −0.096* |
| (0.023) | (0.034) | (0.028) | (0.033) | (0.049) | (0.051) | |
| Oil rents (% of GDP) | 0.008 | −0.050*** | −0.044*** | 0.008 | −0.038*** | −0.030*** |
| (0.006) | (0.004) | (0.004) | (0.006) | (0.004) | (0.004) | |
| Natural gas rents (% of GDP) | −0.011 | −0.035* | −0.031* | 0.003 | −0.013 | −0.011 |
| (0.010) | (0.019) | (0.016) | (0.012) | (0.015) | (0.013) | |
| CO2 emissions (metric tons per capita, log) | 0.001 | 0.016 | −0.061 | 0.136 | −0.024 | −0.018 |
| (0.082) | (0.108) | (0.098) | (0.107) | (0.123) | (0.103) | |
| Brown Complexity Index | −0.140*** | 0.280*** | ||||
| (0.037) | (0.050) | |||||
| Green Complexity Index | 0.065 | 0.405*** | ||||
| (0.048) | (0.044) | |||||
| Year FEs | Yes | Yes | Yes | Yes | Yes | Yes |
| Observations | 873 | 873 | 873 | 873 | 873 | 873 |
| R2 | .356 | .276 | .263 | .344 | .313 | .37 |
*p<0.1; **p<0.05; ***p<0.01.Linear regression. Cluster-robust standard errors in parentheses.Dependent variables are country-level transition opportunities from brown to the list stated.The label (log) refers to the natural logarithm of 1 + the variable in question. Note: Like table 3, but using an alternative averaging procedure.
Table 25. Correlates of brown dependence measures.
| (1) BLI | (2) BLI | (3) BLI | (4) BCI | (5) BCI | (6) BCI | |
|---|---|---|---|---|---|---|
| GDP per capita (current USD) (log) | 0.048 | −0.013 | 0.059 | 0.316*** | 0.179* | 0.212 |
| (0.040) | (0.050) | (0.084) | (0.055) | (0.099) | (0.159) | |
| Coal rents (% of GDP) | 0.031 | −0.009 | ||||
| (0.023) | (0.078) | |||||
| Oil rents (% of GDP) | 0.089*** | −0.025*** | ||||
| (0.006) | (0.005) | |||||
| Natural gas rents (% of GDP) | 0.035** | −0.017 | ||||
| (0.015) | (0.016) | |||||
| CO2 emissions (metric tons per capita, log) | 0.072 | 0.420*** | ||||
| (0.099) | (0.158) | |||||
| RTA, Environment-related Technologies | 1.956 | 1.364 | ||||
| (1.204) | (1.836) | |||||
| RTA, Energy-related Mitigation Technologies | −0.439 | −3.384** | ||||
| (1.221) | (1.520) | |||||
| RTA, Carbon Capture and Storage | 3.726*** | −4.899* | ||||
| (0.695) | (2.620) | |||||
| RTA, Climate Change Adaptation Technologies | 0.775 | −1.150** | ||||
| (0.653) | (0.556) | |||||
| RTA, Transport-related Mitigation Technologies | −2.569** | 2.936 | ||||
| (1.079) | (2.792) | |||||
| Year FEs | Yes | Yes | Yes | Yes | Yes | Yes |
| Observations | 961 | 873 | 222 | 961 | 873 | 222 |
| R2 | .00524 | .758 | .203 | .209 | .324 | .173 |
*p<0.1; **p<0.05; ***p<0.01.Linear regression. Cluster-robust standard errors in parentheses.The label (log) refers to the natural logarithm of 1 + the variable in question.Dependent variables relate to brown list (narrow). Note: Like table 4, but using an alternative averaging procedure.
Table 26. Predictive power of Green Transition Outlook.
| (1) BLI | (2) BLI | (3) BCI | (4) BCI | |
|---|---|---|---|---|
| Brown Lock-in Index (t − 1) | 0.951*** | 0.923*** | ||
| (0.017) | (0.035) | |||
| Green Transition Outlook (t − 1) | −0.003 | −0.003 | −0.023** | −0.023** |
| (0.015) | (0.016) | (0.010) | (0.012) | |
| GDP per capita (current USD, log, t − 1) | −0.003 | −0.017 | 0.029*** | 0.028 |
| (0.009) | (0.017) | (0.007) | (0.018) | |
Coal rents (% of GDP, ) ) | 0.025** | 0.001 | ||
| (0.010) | (0.012) | |||
| Oil rents (% of GDP, t − 1) | 0.005 | −0.002* | ||
| (0.003) | (0.001) | |||
| Natural gas rents (% of GDP, t − 1) | 0.002 | −0.003** | ||
| (0.003) | (0.001) | |||
| CO2 emissions (metric tons per capita, log, t − 1) | 0.028 | 0.020 | ||
| (0.027) | (0.028) | |||
| Brown Complexity Index (t − 1) | 0.948*** | 0.939*** | ||
| (0.015) | (0.016) | |||
| Year FEs | Yes | Yes | Yes | Yes |
| Observations | 749 | 687 | 749 | 687 |
| R2 | .92 | .932 | .917 | .922 |
*p<0.1; **p<0.05; ***p<0.01.Linear regression. Cluster-robust standard errors in parenthesis.The label (log) refers to the natural logarithm of 1 + the variable in question. t − 1 refers to the previous period's value. Note: Like table 5 but using an alternative averaging procedure.
Table 27. Predictive power of overall Transition Outlook.
| (1) BLI | (2) BLI | (3) BCI | (4) BCI | |
|---|---|---|---|---|
| Brown Lock-in Index (t − 1) | 0.930*** | 0.907*** | ||
| (0.019) | (0.034) | |||
| Overall Transition Outlook (t − 1) | −0.044*** | −0.032** | 0.001 | 0.004 |
| (0.014) | (0.013) | (0.009) | (0.012) | |
| GDP per capita (current USD, log, t − 1) | −0.006 | −0.019 | 0.028*** | 0.027 |
| (0.007) | (0.016) | (0.008) | (0.018) | |
| Coal rents (% of GDP, t − 1) | 0.023** | 0.003 | ||
| (0.010) | (0.012) | |||
| Oil rents (% of GDP, t − 1) | 0.005 | −0.001 | ||
| (0.003) | (0.001) | |||
| Natural gas rents (% of GDP, t − 1) | 0.002 | −0.003 | ||
| (0.003) | (0.002) | |||
| CO2 emissions (metric tons per capita, log, t − 1) | 0.026 | 0.021 | ||
| (0.027) | (0.029) | |||
| Brown Complexity Index (t − 1) | 0.940*** | 0.933*** | ||
| (0.015) | (0.016) | |||
| Year FEs | Yes | Yes | Yes | Yes |
| Observations | 749 | 687 | 749 | 687 |
| R2 | .921 | .933 | .916 | .922 |
*p<0.1; **p<0.05; ***p<0.01.Linear regression. Cluster-robust standard errors in parenthesis.The label (log) refers to the natural logarithm of 1 + the variable in question. t − 1 refers to the previous period's value. Note: Like table 6, but using an alternative averaging procedure.
Footnotes
- 9
Variables from OECD Stat are available only for varying subsets of countries in our export dataset.
- 10
The two sampled Kolmogorov–Smirnov test statistic is 0.0499 and the p-value is 0.816.
- 11
- 12
Note that this and other regression analyses in this paper are intended to identify correlations. We cannot claim identification of any causal relationships. Instead, our aim is to highlight how the measures we develop relate to one another and, where applicable, whether they are useful in predicting probable future trends.
- 13
An index computed in a similar fashion as Revealed Comparative Advantage, but based on country-level patenting, rather than exports (e.g. Montresor and Quatraro 2017).
- 14
This is consistent with our finding in 3.1 that the proximity of many brown to green products is higher than average, as well as the intuition that countries scoring high on BLI are specialized in a small number of low-complexity brown products located at the periphery of the product space.
- 15
This suggests that countries scoring high in BCI tend to move away from brown and into green activities, while those high in BLI find it easier to transition into undefined areas.
- 16
Both hydrogen and ammonia are labelled based on the type of energy used to produce then, which is green for renewable energy, blue for fossil-based production with carbon-capture and storage, grey for fossil-based production without CCS, and so on.
- 17
Ammonia has pairwise proximity 0.27 to crude oil.
- 18
Methanol has pairwise proximity 0.37 to crude oil, making it crude's closest non-hydrocarbon export.
- 19
Note, however, that absolute export volumes continued to increase.
- 20
These likely include the traditional drivers of agglomeration economies: knowledge spillovers, labour market pooling, and input-output linkages.
- 21
Examples would include hard to decarbonize sectors, such as heavy industry. Steel, for example, is an essential input into many green products, such as wind turbine towers.
- 22
In line with Mealy and Teytelboym (2020), we use the 1992 edition of the Harmonized System to permit us to use the full time series of trade data available from the BACI Database.