

Abstract
By synthetically producing nitrogen fertilizers from ammonia (NH3), the Haber–Bosch process has been feeding humanity for more than one hundred years. However, current NH3 production relies on fossil fuels, and is energy and carbon intensive. This commits humanity to emissions levels not compatible with climate goals and commits agricultural production to fossil fuels dependency. Here, we quantify food and energy implications of transitioning nitrogen fertilizers to net-zero CO2 emissions. We find that 1.07 billion people are fed from food produced from imported nitrogen fertilizers. An additional 710 million people are fed from imported natural gas feedstocks used for fertilizers production, meaning that 1.78 billion people per year are fed from imports of either fertilizers or natural gas. These findings highlight the reliance of global food production on trading and fossil fuels, hence its vulnerability to supply and energy shocks. However, alternative routes to achieve net-zero emissions in NH3 production exist, which are based on carbon capture and storage, electrification, and biomass. These routes comply with climate targets while mitigating the risks associated with food security. Yet, they require more land, energy, and water than business-as-usual production, exacerbating land and water scarcity and the use of limited natural resources. Transitioning fertilizers to net-zero emissions can contribute to climate and food security goals, although water, land, and energy trade-offs should be considered.
Export citation and abstract BibTeX RIS

Original content from this work may be used under the terms of the Creative Commons Attribution 4.0 license. Any further distribution of this work must maintain attribution to the author(s) and the title of the work, journal citation and DOI.
1. Introduction
Global agricultural productivity relies on three key nutrients: nitrogen, phosphorous and potassium [1, 2]. For centuries, nitrogen has been the bottleneck limiting global agricultural productivity [3–5]. While the raw elements to produce phosphorus and potassium fertilizers are mined from natural deposits, the nitrogen required to produce nitrogen fertilizers is sourced from air [6, 7]. Despite its abundance in the Earth's atmosphere, nitrogen is generally not immediately available for human use, being present in the unreactive N2 form [8]. In 1908, the invention of the Haber-Bosch process to industrially produce ammonia (NH3)—a chemically reactive and highly usable form of nitrogen—has removed limitations associated with soil nutrients and dramatically increased agricultural productivity [9]. Since then, an abundant supply of nitrogen fertilizers empowered by the Haber–Bosch process has boosted agricultural productivity enabling the expansion of global population [9, 10].
While synthetic nitrogen fertilizers have a key role in global food production [3, 4], excess reactive nitrogen has caused several environmental impacts, including groundwater contamination, eutrophication of water bodies and associated biodiversity loss, air pollution, greenhouse gas emissions, and stratospheric ozone depletion [5, 11–16]. Today, using carbon-intensive energy sources such as coal or natural gas, synthetic nitrogen fertilizers production via the Haber-Bosch process is responsible for roughly 2% of global energy consumption and directly emits about 450 Mt CO2 per year [6, 17].
Current fossil-based synthetic nitrogen fertilizers production commit humanity to emissions levels not compatible with climate goals [18]. It also commits agricultural productivity to rely on fossil fuels and import dependencies, which can expose global food systems to energy and supply shocks. For example, disruptions caused by the Covid-19 pandemic and the 2022 Russia's war in Ukraine have brought the intertwined nature of global energy and food supply chains into sharp focus [19–21]. Decarbonizing the production of synthetic nitrogen fertilizers can have the twin benefits of reducing both the industry's CO2 emissions and its reliance on fossil fuels imports, therefore reinforcing global food security.
This study quantifies the food-energy security implications of transitioning synthetic nitrogen fertilizers to net-zero CO2 emissions, via a country-specific analysis. First, we estimate the number of people fed from synthetic nitrogen fertilizers worldwide. Second, we identify which countries are net-importers and net-exporters of nitrogen fertilizers, accounting for embedded reliance on fossil fuels import. Third, we quantify the carbon emissions currently associated with NH3 production worldwide; NH3 is the precursor to synthetic nitrogen fertilizers, and its current production via the conventional Haber–Bosch process accounts for ∼90% of the nitrogen fertilizer industry's total energy consumption [6]. Finally, we analyze three alternative routes available to achieve net-zero-CO2-emissions (or simply net-zero) NH3 production, namely carbon capture and storage, electrification, and biomass [22]. Net-zero NH3 production can have unintended environmental consequences on land use, energy, and water consumption, further exacerbating land and water scarcity [23–25]. Therefore, we quantify water and land requirements for all net-zero routes and compare them with business-as-usual production.
2. Methods
We used country-specific data of synthetic nitrogen fertilizers produced and used in agriculture to quantify people fed and trade dependencies with and without fossil fuels imports. Synthetic nitrogen fertilizers data are taken from the United Nation Food and Agriculture Organization (FAO) for year 2019 [26]. This is the most up-to-date information of synthetic nitrogen fertilizers for all countries worldwide. We then quantified country-specific carbon emissions, and land, water, energy required to achieve net-zero emissions in the production of NH3—the precursor to synthetic nitrogen fertilizers.
2.1. Assessment of people fed from synthetic nitrogen fertilizers
For all countries, i, we estimated the number of people fed from synthetic nitrogen fertilizers,  , by considering country-specific agricultural use of nitrogen fertilizers,
  (kg N), daily nitrogen intakes in diets,
  (kg N/person), the fraction of nitrogen lost from farm to fork,
  , and country-specific nitrogen use efficiency,
  (or the fraction of nitrogen lost on the field and that is not used to produced food):
Country-specific nitrogen fertilizers usage are taken from the FAO database for year 2019 [26]. Country-specific daily nitrogen intakes in diets are derived from per capita daily protein intakes as provided by FAO for year 2019 [26] and considering that 18% of protein content is nitrogen [27]. Nitrogen is the building block of amino acids that are required to produce proteins. The FAO database reports country-specific annual statistics of dietary protein consumption with a global median protein intake of 84 g of protein per day per person; a minimum intake of 26 g of protein per day per person in the Democratic Republic of Congo and a maximum intake of 144 g of protein per day per person in Iceland [26].
Our food systems are highly inefficient, with most of the food being lost or wasted [28]. The share of nitrogen lost from farm to fork is assumed to be 42.5%, an average value derived from previous global estimates of 41% and 44% [3, 29]. Such estimates quantified production and losses from farm to fork of digestible protein in the global food system, accounting for: harvesting losses, post-harvest losses, non-food uses, processing and packaging losses, distribution waste, and consumption waste [3, 29]. We acknowledge that a more appropriate analysis would use up-to-date country-specific and crop-specific values of nitrogen lost from farm to fork. However, given the complexity of our food systems, such data are only partially available—see for example the analysis of Gustavsson et al at regional level [30]—and are affected by large uncertainties [31, 32]. This highlights the need for more accurate data of nitrogen wasted in food systems.
Nitrogen use efficiency represents the quantity of applied nitrogen incorporated in crops and is assessed as the ratio between crop nitrogen uptake and applied nitrogen fertilizer [5, 33]. It is a measure of how efficiently nitrogen fertilizers are used in agriculture. The global average nitrogen use efficiency is estimated to be 46%, indicating substantial losses (more than half of the total nitrogen used) of reactive nitrogen to the environment [5]. We use country-specific and publicly available nitrogen use efficiency statistics [33]. Importantly, the ongoing global increase in animal protein intakes is leading to a decline in overall nitrogen use efficiency [5].
2.2. Self-sufficiency analyses
We analyzed country-specific trade balances to quantify synthetic nitrogen fertilizers self-sufficiency and determine net-importers and net-exporters. Specifically, for all countries, i, we quantify synthetic nitrogen fertilizers produced domestically with and without embedded natural gas imports. When not accounting for natural gas imports, we assess the quantity of synthetic nitrogen fertilizers imported or exported,  (kg N), by taking the difference between total domestic production of synthetic nitrogen fertilizer,
  (kg N), and domestic agricultural use of synthetic nitrogen fertilizer,
  (kg N):

 represents the trade deficit or surplus of synthetic nitrogen fertilizers in a specific country. When
  is smaller than zero, a country is a net-importer of synthetic nitrogen fertilizers; when
  is greater than zero, a country is a net-exporter.
When accounting for natural gas imports, hence for the coupling of energy and food systems, we quantify the quantity of synthetic nitrogen fertilizers produced domestically,  , by taking the difference between total production of synthetic nitrogen fertilizer made from domestic natural gas,
  , and agricultural use of synthetic nitrogen fertilizer,
  (kg N):

When  is smaller than zero, a country is a net-importer of synthetic nitrogen fertilizers, at the net of imported natural gas. When
  is greater than zero, a country is a net-exporter. The discrepancy between
  and
and  provides a measure of the exposure of the food system to energy trading and potential shocks in energy supply. The total production of synthetic nitrogen fertilizer made from domestic natural gas,
  , is computed by accounting for the fraction of nitrogen fertilizers produced from imported natural gas:
where  (m3) is the amount (volume) of imported natural gas, and
  (m3) is the overall natural gas consumption in each country (29). To the best of our knowledge, there are not available dataset that specify the purpose of natural gas import in each country. Therefore, we assume that the share of synthetic nitrogen fertilizers produced from imported natural gas is the same as the total share of imported natural gas in each country. Data of total production of synthetic nitrogen fertilizer,
  (kg N), and agricultural use of synthetic nitrogen fertilizer,
  (kg N) are taken from FAO for year 2019 [26]. The number of people fed from imported synthetic nitrogen fertilizers with and without natural gas imports (
 and
and  ) is assessed using equation (1) and considering country-specific daily nitrogen intakes in diets,
  i
(kg N/person), fraction of nitrogen lost from farm to fork,
i
(kg N/person), fraction of nitrogen lost from farm to fork,  , and country-specific nitrogen use efficiency,
  .
.
2.3. Assessment of net-zero ammonia production
Conventional production of ammonia (NH3) is carried out via the Haber–Bosch process. Globally, conventional Haber–Bosch processes use natural gas (70%) and coal (26%) as feedstock, with oil and electricity accounting for less than 4% of global production [6]. The availability of feedstock and process energy is a key determinant of where and how NH3 is produced. Low-cost natural gas in the United States, Middle East, and Russia explains the prominent role of these regions and their natural gas-based plant fleets. China's abundant coal reserves explain its heavy reliance on the fuel, which accounts for around 85% of its production. Here, we assume that all countries use natural gas, except for China (mix of 85% coal and 15% natural gas), United States, South Africa, and Indonesia (all featuring a mix of 20% coal and 80% natural gas) [6].
When based on natural gas, the process uses about 0.49 ton of fossil carbon (t C), or about 0.65 ton of natural gas, to produce one ton of ammonia (t NH3); the coal-based process uses about 0.88 t C (or about 0.62 ton of coal) to produce one t NH3 [6] (supplementary figure 2). By applying stoichiometry, business-as-usual NH3 production with natural gas and coal emits 1.8 t CO2/t NH3 and 3.2 t CO2/t NH3, respectively (supplementary figure 2).
A stream of pure hydrogen needs to be fed into the Haber–Bosch reaction for NH3 synthesis. Therefore, CO2 is removed through primary and secondary steam methane reforming (SMR) and a two-stage water-gas shift (WGS). The concentrated stream of CO2 can be used for urea-based fertilizers production or alternatively is vented to the atmosphere contributing to global warming. Similarly, the diluted CO2 in the exhaust gases from fossil fuels combustion for energy inputs is emitted to the atmosphere. The Haber–Bosch process is composed of two SMR reactors in series. The first SMR reactor is endothermic, with the required heat being provided by external combustion of methane fuel. The second SMR reactor is autothermal, while the WGS reaction is exothermic, making a significant amount of heat available for heat integration. Such heat is typically used for producing high-pressure steam, which is expanded in steam turbines for compression purposes.
When adopting carbon capture and storage, the concentrated CO2 resulting from hydrogen production, and the diluted CO2 in the exhaust gases from fossil fuel combustion are captured, transported to a suitable storage site, and permanently sequestered [34]. Because CO2 transport via pipeline results in negligible CO2 emissions, we do not consider associated CO2 emissions from CO2 transport and storage [35].
For the business-as-usual route, we consider an average electricity consumption of 0.18 MWh t−1 NH3 when the process uses natural gas as feedstock (ranging from 0.08 MWh t−1 NH3 when the process adopts SMR, to 0.28 MWh t−1 NH3 when the process adopts auto-thermal reforming), and an average electricity consumption of 0.91 MWh t−1 NH3 for the coal-based process [6]. Such electricity consumption is additional to the energy inputs provided by fossil fuels and is used to run auxiliary equipment.
When implementing carbon capture and storage to concentrated and diluted CO2 streams, the electricity consumption becomes 0.35 MWh t−1 NH3 (range 0.28–0.41 MWh t−1 NH3) for natural gas-based processes and 1.26 MWh t−1 NH3 for coal-based processes [6]. Overall, the CO2 capture process has a capture efficiency of about 95% [6], with 5% of the emissions still escaping to the environment and being captured back with direct air capture to achieve net-zero CO2 emissions. The capture efficiency of 95% is assumed as the optimal trade-off between higher CO2 purity and higher capture costs [6]. This efficiency value, which is higher than typical values for post-combustion capture of about 90%, is made possible by the combination of the concentrated CO2 resulting from hydrogen production (higher capture efficiency) and the diluted CO2 in the exhaust gases (capture efficiency of about 90%) [6].
Various studies have assessed processes that go beyond fossil fuels in NH3 production by using hydrogen produced from water electrolysis or biomass [36–42]. Both the electrification and the biomass routes still rely on the Haber–Bosch process to produce NH3, which is either electrified or fueled by biomass.
The electrification route relies on the use of renewable energy to produce hydrogen and nitrogen for NH3 synthesis [38, 39, 41]. In this case, electricity provides all the energy requirements, replacing fossil fuels as both feedstock and fuel. Hydrogen is produced via water electrolysis and converted to NH3 through a Haber–Bosch process like the conventional one; nitrogen is produced through an air separation unit [6]. Such a process requires 0.18 t H2 and 0.82 t N2, with an average electricity consumption of 9.3 MWh t−1 NH3 (range 8.6–10 MWh t−1 NH3) [6, 43].
Biomass-based NH3 production is carried out via a gasification process starting from dry wood chips, here assumed to have a 43% carbon content and a lower heating value of about 17 MJ kg−1. The process uses about 2 ton of dry biomass and 0.37 MWh to produce one t NH3 [36, 44]. This amount of biomass is used both as a fuel, to produce the heat required by the first reforming reactor, and as a feedstock. For all net-zero emissions routes, schematics of processes enabling net-zero emissions production of NH3 are shown in supplementary figure 1.
2.4. Assessment of carbon dioxide emissions
The carbon intensity of all routes is computed by considering the carbon intensity of the production processes, as well as the carbon intensity (including the embedded emissions) of the technologies supplying electricity. Electricity can be supplied via: (i) electricity grid, with a carbon intensity varying country-by-country (world average equal to 458 kg of CO2 equivalent per MWh of electricity) [45]; (ii) solar photovoltaic panels, which result in a median value of 87.5 kg CO2eq per MWh of produced electricity (range 23–183 kg CO2eq MWh−1) [46]; (iii) wind turbines, with a median carbon intensity of 11 kg CO2eq MWh−1 (range 8–23 kg CO2eq MWh−1) [46]; (iv) nuclear power plants, with a median carbon intensity of 12 kg CO2eq MWh−1(range 4–110 kg CO2eq MWh−1) [46]. Furthermore, we consider the lifecycle carbon emissions of the natural gas supply chain, which account for the emissions released upon use of natural gas (both as a fuel and as a feedstock), as well as for natural gas leaks along the supply chain; here we assume natural gas leaks equal to 1.5% of the required amount of natural gas needed to produce NH3 under the business-as-usual and carbon capture and storage routes. Indeed, recent research demonstrated that natural gas leaks occur across the entire supply chain, including production, processing, pipeline transportation, and distribution [47–49]. Overall, natural gas leaks rate from 0.2% to 8%, with 1.5% being a reasonable likely value [50].
For all four routes  and all countries
  , the total CO2 emissions,
  , are obtained as:

where  is the amount of produced NH3 in country
  ,
,  is the carbon intensity of the production process of route
  ,
,  is the specific electricity consumption of route
  , and
, and  is the carbon intensity of electricity generation (which depends on the considered generation technology among grid, solar, wind and nuclear). The emissions resulting from NH3 production are non-zero only for the business-as-usual and the carbon capture and storage routes (for the latter, they include the 5% fugitive emissions from the capture process). However, for all net-zero routes the emissions resulting from electricity production must be offset via direct air capture, which also requires energy to operate [51]. The amount of required direct air capture to achieve net-zero emissions,
  , is computed as:

where  is the amount of electricity required to capture one ton of CO2 via direct air capture. This is the sum of electricity consumption and electrified heat consumption of direct air capture. For the calculations, we consider a direct air capture technology based on solid sorbents [51]. We consider an electricity consumption of 0.35 MWh t−1 CO2 (which already includes 0.1 MWh t−1 CO2 for CO2 compression for making it ready for transport and storage) and a heat consumption of 1.75 MWh t−1 CO2 [51]. Heat is required at low temperature (around 100 °C) and can be supplied via heat pump (coefficient of performance of 4), resulting in
  = 0.79 MWh t−1 CO2. The deployment of direct air capture with CO2 storage can result in further environmental tradeoffs [52].
For all routes and for all countries, the total electricity consumption,  , is given by the contribution of NH3 production and the one of carbon capture via direct air capture:

2.5. Assessment of water and land requirements
The land use and water consumption of all routes are computed by considering on-site electricity demand for NH3 production, hydrogen production, direct air capture, and biomass. The calculations are based on the data reported in supplementary table 2.
The total land use and water consumption are computed by multiplying the total electricity production, the amounts of required hydrogen, direct air capture, and biomass, by the corresponding factors in supplementary table 2. Accordingly, for all countries and routes, the land use,  , is given by:

where  is the amount of biomass required per unit of NH3 in route
  (only needed for the biomass route);
  ,
,  , and
, and  , are the land use intensities of electricity generation, direct air capture, and biomass, respectively.
Similarly, for all countries and routes, the total water consumption,  , is given by:

where  is the amount of hydrogen required per unit of NH3 in route
  (only needed for the electrification route);
  ,
,  ,
,  , and
, and  are the water consumption intensities of electricity generation, direct air capture, biomass, and hydrogen production, respectively.
3. Results
3.1. People fed from synthetic nitrogen fertilizers
By considering country-specific nitrogen use efficiencies (i.e. the fraction of nitrogen lost on the field, which is not used to produced food) [33], nitrogen waste and losses in crops from farm to fork [3, 29], and country-specific per capita nitrogen intakes [26], we quantify the number of people that consume synthetic nitrogen fertilizers and estimate the number of people fed. Consistent with previous global estimates around year 2000 [3, 4], our updated analysis for year 2019 shows that synthetic nitrogen fertilizers are used to produce half of the global protein supply, feeding 3.8 billion people worldwide (figure 1).

Figure 1. Number of people fed from synthetic nitrogen fertilizers. Synthetic nitrogen fertilizers data are taken from the United Nations food and agriculture organization (26) for year 2019, the most up-to-date year containing information of domestic usage of synthetic nitrogen fertilizers. Globally, 107 Mt of synthetic nitrogen fertilizers were used in agriculture in 2019 [26].
Download figure:
Standard image High-resolution imageAccording to the FAO, China is the largest consumer of synthetic nitrogen fertilizers (27 Mt nitrogen, Mt N, per year), followed by India (19 Mt N per year), the United States (12 Mt N per year), Brazil (5 Mt N per year), Pakistan (4 Mt N per year), Indonesia (3 Mt N per year), and Canada (3 Mt N per year) [26]. Yet, by considering country-specific nitrogen use efficiencies and nitrogen intakes in diets, we find that India is the country producing proteins that feed the largest number of people with synthetic nitrogen fertilizers, 646 million people, followed by China (530 million people), the United States (480 million people), and Indonesia (225 million people) (figure 1). These results quantify the number of people fed by synthetic nitrogen fertilizers and the reliance of global food production on synthetic nitrogen fertilizers. Because of higher inefficiencies in fertilizers applications and nitrogen intakes in diets, China—the largest consumer of synthetic nitrogen fertilizers—can feed less people than India—the second largest consumer of synthetic nitrogen fertilizers. We also show that the Unites States produces enough protein to feed 480 million people, a number larger than its population. This is because the Unites States are a major exporter of food and a fraction of proteins produced from synthetic nitrogen fertilizers within the country are internationally traded.
3.2. Synthetic nitrogen fertilizers self-sufficiency
International trade is increasingly transporting commodities from one country to another and exacerbating vulnerability to supply shocks [53]. About one fourth of global food is traded among countries [54]. Similarly, synthetic nitrogen fertilizers are produced and traded around the world [6]. In 2019, synthetic nitrogen fertilizer exports equated 38% (47 Mt N per year) of global production [26]. We analyze country-specific trade balances to quantify synthetic nitrogen fertilizers self-sufficiency and determine net-importers and net-exporters. Using country-specific data of fertilizers production and use [26], we calculate the net-imports and net-exports of nitrogen fertilizers.
Our analysis shows that exports of nitrogen fertilizers are concentrated in a few countries (figure 2(A)). Russia is the largest net-exporter of synthetic nitrogen fertilizers (9.2 Mt N per year), followed by China (5.6 Mt N per year), Egypt (3 Mt N per year), Qatar (3 Mt N per year), Saudi Arabia (2.6 Mt N per year), the United States (1.6 Mt N per year), Oman (1.6 Mt N per year), and Canada (1.4 Mt N per year) (figure 2(A)).
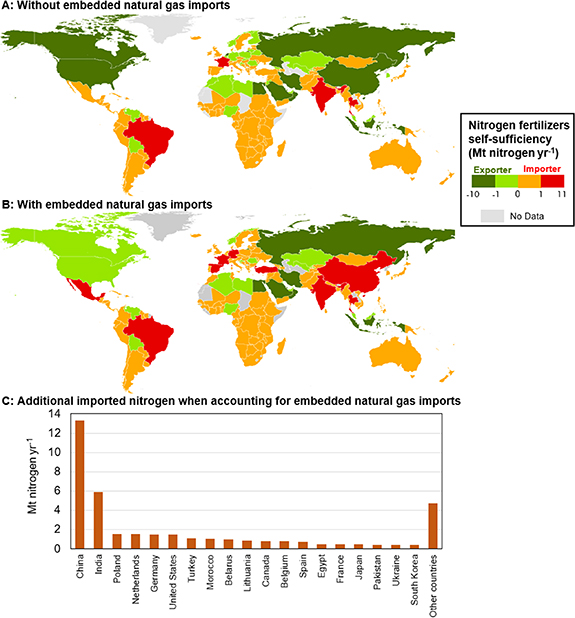
Figure 2. Global nitrogen fertilizers self-sufficiency with and without embedded fossil fuel imports. Panel (A) shows net-importers and net-exporters of synthetic nitrogen fertilizers by simply referring to the fertilizer trading; panel (B) shows net-importers and net-exporters of synthetic nitrogen fertilizers accounting for the share of imported natural gas used in the production of fertilizers; panel (C) shows additional imported nitrogen fertilizers when accounting for natural gas imports embedded in production.
Download figure:
Standard image High-resolution imageHowever, some net-exporters of synthetic nitrogen fertilizers, such as China, the Netherlands, Germany, Belgium, South Korea, Poland, and Japan are large importers of natural gas [55], which make these countries vulnerable to energy shocks—as highlighted by the current energy crisis [56, 57]. To investigate the interplay of food and energy supply, we then investigate the self-sufficiency of all countries worldwide when accounting for the share of synthetic fertilizers produced from imported natural gas. By accounting for natural gas imports [55], we find that the number of countries that can produce synthetic nitrogen fertilizers self-sufficiently decreases (figure 2(B)). China, Germany, the Netherlands, Finland, South Korea, Japan, Belarus, and Poland become net-importers of synthetic nitrogen fertilizers (via the import of natural gas) (figure 2(B)). In contrast, major fossil fuels producers, such as Russia, Qatar, Saudi Arabia, Egypt, Oman, and Iran remain net-exporters of synthetic nitrogen fertilizers (figure 2(B)).
This analysis shows which country can produce enough fertilizers to meet domestic demand. It allows to understand the countries' vulnerability to food, fertilizers, and energy supply shocks, and it highlights the strong connection between the food and energy systems, with a handful of countries controlling either the food or the energy resources required to produce fertilizers.
3.3. Food security risks from traded nitrogen fertilizers
The reliance of synthetic nitrogen fertilizer on international trade represents a threat to global food security and resilient food systems [53]. Food security is achieved 'when all people, at all times, have physical, economic and social access to sufficient, safe, and nutritious food to meet their dietary needs and food preferences for an active healthy life' [58]. In this study, we consider the nutrient security component of food security considering a safe physical access to proteins [59]. We quantify the number of people fed with traded synthetic nitrogen fertilizers when accounting for fertilizers trade with and without embedded natural gas imports (i.e. analysis presented in figure 2(B)).
We find that 1.07 billion people per year are fed from food reliant on fertilizers imports (figure 3). However, when accounting for embedded natural gas imports, or the share of synthetic fertilizers produced from imported natural gas, we find that an additional 710 million people rely on natural gas imports used to produce synthetic nitrogen fertilizers. Globally, 1.78 billion people per year are fed from food reliant on imports of either fertilizers or natural gas (figure 3). India is the country relying the most on nitrogen fertilizers import, with 176 million people relying on direct import of fertilizers, and 379 million people relying on either imported fertilizers or imported natural gas (figure 3). China—a country self-sufficient in terms of nitrogen fertilizers—becomes a net-importer when accounting for natural gas imports, with 151 million people being fed from fertilizers produced from imported natural gas (figure 3). When accounting for imports of either fertilizers or natural gas, nitrogen fertilizers are used to produce food that can feed 185 million people in Brazil, 93 million people in France, 64 million people in Ukraine, and 58 million people in Turkey (figure 3). Without trading of fertilizers or natural gas, food shortages will spread with devastating impacts on millions of people.
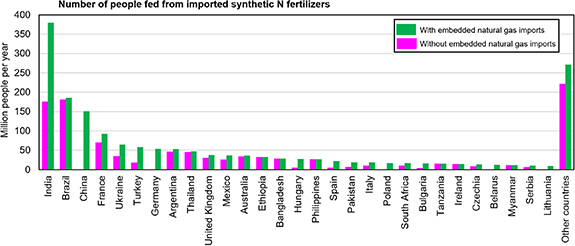
Figure 3. Number of people fed from imported synthetic nitrogen fertilizers. The figure shows top importing countries and the number of people that can be fed from imported synthetic nitrogen fertilizers with and without accounting for embedded natural gas imports used for production of ammonia. Embedded natural gas imports accounts for the share of synthetic fertilizers produced from imported natural gas in each country.
Download figure:
Standard image High-resolution image3.4. Carbon emissions embedded in ammonia production
Ammonia (NH3) synthesis for synthetic nitrogen fertilizers production is energy and carbon intensive. The global production of NH3 is about 183 Mt per year; ∼70% of which goes into synthetic nitrogen fertilizers, whereas the remaining fraction is used for plastics, explosive, and textile production [6]. While global greenhouse gas emissions from NH3 production are estimated to be 450 Mt CO2 per year [6], country-specific carbon emissions from synthetic nitrogen fertilizers production have been overlooked until recently [17]. Using country-specific data of electricity carbon footprint and energy mix for NH3 production, accounting for natural gas leaks along the supply chain, and modeling several processes for net-zero NH3 production, we quantify country-specific CO2 emissions resulting from the business-as-usual production of synthetic nitrogen fertilizers.
Our analysis shows that 310 Mt CO2 per year are emitted globally to produce synthetic nitrogen fertilizers (figure 4). China is responsible for the largest CO2 emissions related to the production of synthetic nitrogen fertilizers (117 Mt CO2 yr−1), followed by India (45 Mt CO2 yr−1), the United States (31 Mt CO2 yr−1), Brazil (11 Mt CO2 yr−1), Pakistan (8 Mt CO2 yr−1), and Indonesia (8 Mt CO2 yr−1) (figure 4).
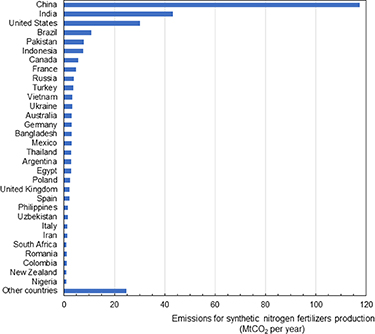
Figure 4. Country-specific emissions resulting from ammonia synthesis for synthetic nitrogen fertilizers production. The figure shows countries emitting more than 1 Mt CO2 per year to produce ammonia for synthetic nitrogen fertilizers use in domestic agriculture.
Download figure:
Standard image High-resolution image3.5. Available routes for net-zero ammonia production
NH3 production accounts for ∼90% of the total energy consumption and CO2 emissions of the nitrogen fertilizer industry [6]. Therefore, achieving net-zero CO2 emissions in NH3 production would represent a major step towards net-zero fertilizers. The conventional Haber–Bosch process is a highly integrated process that can be divided into two main steps: (a) hydrogen production from fossil fuels, and (b) NH3 synthesis from the Haber–Bosch reaction. Hydrogen and nitrogen production are energy-intensive processes that can have different carbon intensities depending on the energy source and feedstock [6]. In the business-as-usual route, fossil fuels are used as feedstock to produce hydrogen and provide the energy required for the synthesis of NH3, hence resulting in CO2 emissions (supplementary figure 1(A)). In most countries, hydrogen is currently manufactured through SMR of natural gas; in China, hydrogen is produced via coal gasification [6]. Although improvements in energy efficiency and carbon intensity are underway and have reduced the emission intensity of NH3 production by 12% over the last fifteen years [6], net-zero NH3 production needs to phase-out from fossil fuels.
Net-zero CO2 emissions in NH3 production can be achieved in multiple ways: through the production of hydrogen from fossil fuels integrated with carbon capture and storage [6]; through the production of hydrogen from electrolysis using low-carbon electricity [60]; and through the production of hydrogen from biomass gasification, such as wood chips from crop and forestry residues [36]. In the carbon capture and storage route (supplementary figure 1(B)), NH3 is still produced from fossil-fuels via the conventional Haber–Bosch process [6]. Carbon dioxide emission generated during NH3 synthesis are captured, transported, and permanently stored in suitable underground geological structures [34]. In the electrification route, hydrogen is produced from water electrolysis via low-carbon electricity, which also power the Haber–Bosch process [60] (supplementary figure 1(C)). In the biomass route, CO2 is captured from air via photosynthesis during biomass growth and then emitted upon synthesis and disposal of the biomass-based product, thus resulting in net-zero CO2 emissions. Biomass contains both the carbon and hydrogen atoms, as well as the energy required for the synthesis of NH3 [44] (supplementary figure 1(D)). For all routes to reach net-zero emissions, residual emissions along the production chain must be offset with negative emissions, for example via direct air carbon capture coupled with CO2 and storage [6].
3.6. Energy-land-water implications
While all net-zero routes described above are technically feasible [6], and some allow to avoid reliance on fossil fuels, a holistic approach is needed to quantify their environmental feasibility and avert unintended environmental consequences. We quantify the land, water, and energy requirements of all net-zero routes and compare them with a business-as-usual route to produce NH3 (See Methods section for a description of all net-zero routes). All net-zero routes are more land, energy, and water intensive than the business-as-usual route (figure 5); this is the cost of achieving net-zero emissions. Overall, the biomass route is the most water- and land-intensive route (mostly due to the high water and land intensity for growing the biomass feedstock), while the electrification route is the most energy-intensive (mostly due to the amount of electricity required to produce hydrogen via water electrolysis) (figure 5).

Figure 5. Energy, land, and water intensity of ammonia production via net-zero routes. Uncertainty ranges are determined by considering different life cycle values of land, water, and energy requirements (supplementary table 2). Reference values are presented with dots and represent the central values in original sources. Note that the y-axes are in logarithmic scale with base 10; 1 kg of nitrogen is equal to 1.22 kg of ammonia.
Download figure:
Standard image High-resolution image
Table 1 reports the reference values of global CO2 emissions, energy requirements, land use and water consumption, reiterating that achieving net-zero emissions is possible, but requires high energy, land, and water resources. For example, decarbonizing NH3 production with the electrification route will require TWh of electricity (or 5% of year 2019 global total electricity consumption), compared to the 48 TWh currently used under a business-as-usual production pathway (table 1). Achieving net-zero emissions via the biomass route requires 26 million hectares of land and 255 km3 of water, about a factor 1000 higher than the resources required by the current production (table 1). Overall, achieving net-zero emissions in NH3 production is technically possible. However, water, land, and energy trade-offs should be thoroughly considered to ensure a sustainable transition to net-zero food systems.
Table 1. Global energy, land, and water required to achieve net-zero emissions in synthetic nitrogen fertilizers production. The table shows reference values of global CO2 emissions, electricity consumption, land use, and water consumption for all net-zero routes and comparison against the business-as-usual production. See supplementary dataset for country-specific energy, land, and water requirements to decarbonize domestic use of synthetic nitrogen fertilizers.
| CO2 emissions (Mt CO2) | Electricity requirements (TWh) | Land use (Mha) | Water consumption (km3) | |
|---|---|---|---|---|
| Business-as-usual | 310 | 48 | 0.03 | 0.04 |
| Carbon capture and storage | 0 | 76 | 0.06 | 0.13 |
| Electrification | 0 | 1219 | 0.9 | 2.03 |
| Biomass | 0 | 49 | 26 | 255 |
4. Discussion
4.1. Food security implications
Feeding the growing and increasingly affluent human population requires doubling global food production by 2050 [61]. To meet this demand, nitrogen fertilizers are required to increase agricultural productivity. Currently, half of the world population is supported by synthetic nitrogen fertilizers, produced via the Haber–Bosch process—a carbon- and energy-intensive process that commit global food systems to rely on fossil fuels. This study sheds light on the global food security implications of current fossil fuel-based synthetic nitrogen fertilizers production, which is exposed to supply and energy shocks. It identifies producers and consumers of synthetic fertilizers and the associated number of people fed, when considering the interplay with energy supply. Furthermore, it presents routes to achieve net-zero emissions in the production of fertilizers, and investigates their potential for improving food security, as well as their impact on land and water scarcity. These results can inform the development and deployment of resilient and sustainable strategies to achieve net-zero food systems.
Our results quantify the reliance of the global food system on synthetic nitrogen fertilizers and natural gas trade. We find that 1.07 billion people per year are fed from food reliant on fertilizers imports (figure 3). However, when accounting for embedded natural gas imports, or the share of synthetic fertilizers produced from imported natural gas, we find that 1.78 billion people per year are fed from food reliant on imports of either fertilizers or natural gas (figure 3). Overall, a handful of countries control the trade of synthetic nitrogen fertilizers, either via their production capacity or energy (mostly natural gas) resources. These countries are Russia, Egypt, Qatar, and Saudi Arabia. Multiple countries, namely China, Germany, the Netherlands, Finland, South Korea, Japan, Belarus, and Poland, are net-importers of synthetic nitrogen fertilizers via natural gas import, despite their fertilizer production capacity (which could make them net-exporters of nitrogen fertilizers if they had more fossil fuels resources) (figure 2). This unveils complex risks and threats to global food security, with more than 20% of the global population being exposed to either supply shocks via fertilizers trading or energy shocks via embedded energy feedstock (mostly natural gas) trading.
Our results show that imports of synthetic nitrogen fertilizers and embedded natural gas produce food that can feed 379 million people in India, 185 million people in Brazil, and 151 million people in China (figure 3). While Brazil and the United States are major food exporters and nitrogen fertilizers are used to produce food that feed people in other countries, in India and China most of the food produced from fertilizers is used to feed domestic population, making domestic food production particularly reliant on trade and energy and supply shocks.
4.2. Energy and environmental implications
Being more energy-intensive (figure 5), net-zero NH3 production will not necessarily decrease vulnerability to energy shocks. For example, net-zero NH3 production based on the electrification route could reduce the vulnerability to shocks on commodity markets, at least for what pertains oil, methane, and coal, but would be still vulnerable to electricity prices.
Transitioning fertilizer production to net-zero CO2 emissions can have the twin benefit of reducing CO2 emissions while enhancing food security. Indeed, the deployment of processes to synthesize nitrogen fertilizers from renewable energy (i.e. electrification and biomass route) can reduce CO2 emissions while averting reliance on imports of fossil fuels. In contrast, whereas carbon capture and storage allows to achieve net-zero emissions, it does not reduce the reliance of the food system on fossil fuels; it still uses an average of 77 Mt of carbon from fossil fuels per year, hence making the global food system vulnerable to energy shocks. In addition, carbon capture and storage would require a widely spread infrastructure to transport [35, 62] and permanently store the CO2 captured at the production site [63]. Whereas recent assessments indicate that a vast storage capacity might be available, i.e. between 7000 and 55 000 Gt CO2 can be stored worldwide [64], CO2 storage still faces issues concerning the actual availability, accessibility, and acceptance of storage sites [65, 66]. An alternative option to geological CO2 storage is carbon dioxide mineralization, which consists in reacting CO2 with metal cations to form stable carbonate materials and achieve permanent CO2 sequestration [67–69]. Importantly, our assessment accounts for natural gas leaks along the supply chain, here assumed to be 1.5% of the required natural gas [50]. However, it is worth noting that natural gas leaks affect carbon emissions, hence land, energy, and water consumption required to achieve net-zero emissions of the carbon capture and storage route only. Arguably, the carbon capture and storage route would find a better use for carbon-rich chemical products, such as methanol and plastics, which, contrary to NH3, contain the carbon molecule in the final product [22].
Contrary to carbon capture and storage, the electrification and biomass routes can achieve net-zero emissions while avoiding using fossil fuels. However, the electrification route would require twenty-five times more energy than the business-as-usual route. The biomass route would require one thousand times more land and water than the business-as-usual route, using 26 million hectares of land and 255 billion cubic meter of water (table 1). To grow this vast increase in biomass, further nitrogen inputs [70], and transport and processing facilities would be required. In addition, both biomass and electricity will be required to achieve net-zero emissions in other sectors and a competition for these limited resources could constrain their use for NH3 production [71]. To avert unintended environmental consequences on natural resources and biodiversity and additional land, water, and fertilizers use, biomass should be sourced sustainably from waste biomass, forestry residues, and crop residues [72, 73].
While net-zero nitrogen production routes could solve energy and food security issues present in business-as-usual NH3 production, these alternative NH3 production routes could create inequalities in NH3 nitrogen fertilizers production with more technically advanced economies continuing to dominate production.
4.3. Solutions to reduce ammonia demand
By emitting 310 Mt CO2 per year (figure 3), business-as-usual NH3 synthesis for synthetic nitrogen fertilizers production commit humanity to emissions levels not compatible with the net-zero targets required to keep global warming below 1.5 °C [74]. An additional 30 Mt CO2 per year are estimated to come from NH3 transport [17]. Although NH3 is not a greenhouse gas, its overuse lead microbes in the soil to convert it into nitrous oxide, a greenhouse gas three hundred times more powerful than carbon dioxide and responsible for stratospheric ozone depletion [75, 76]. It is estimated that nitrogen fertilizers emit 2.3 Mt of nitrous oxide per year, equivalent to 670 Mt CO2 emissions per year [6], bringing global total emissions (direct and indirect emissions) from synthetic nitrogen fertilizers to 1010 Mt CO2 per year when accounting for emissions from NH3 synthesis for nitrogen fertilizers, or 2% of global greenhouse gas emissions.
Economic and population growth are expected to double global food demand by 2050 [61]. Thus, synthetic nitrogen fertilizers are envisaged to continue to be a major and growing component of agricultural productivity in the 21st century [5, 77, 78]. While the net-zero routes analyzed here can abate emissions on the supply-side, demand-side measures can reduce future NH3 demand and significantly ease the task of achieving net-zero emissions while considering environmental trade-offs and socio-political shocks (e.g. related to food and energy supply) [79, 80]. Encouraging diets with low nitrogen footprint or less meat, reducing food losses and waste, and improving nitrogen use efficiencies can reduce future NH3 demand [15]. First, global average nitrogen use efficiency—the share of applied nitrogen incorporated in food production—is estimated to be around 46%, meaning that more than half of synthetic nitrogen is dispersed in the environment and not used to grow crops [5]. Precisions agriculture can increase the efficiency of nitrogen fertilizers application to crops [81]. Second, nitrogen losses from farm to fork are estimated to be between 41% and 44% and are mainly due to harvesting and distribution losses, and food waste [3, 29]. Such losses can be reduced by reducing food waste and improving efficiencies in food supply chains. Third, a dietary transformation to less nitrogen-intensive diets can reduce nitrogen demand. While the recommended daily protein intake for a healthy diet is estimated to be ∼50 g per person per day (or about 9 g of nitrogen per person per day), today the global median intake is 84 g of protein per person per day [26]. Moderating the consumption of animal-based food can reduce nitrogen demand [82, 83]. Importantly, while average protein intake is above the recommended value for healthy diets, one billion people still suffer from protein deficiency worldwide [84], indicating inequalities in our food systems.
Considering losses, inefficiencies, and waste [85], it is estimated that only ∼20% of produced synthetic nitrogen fertilizers feed global population [3, 5, 29, 33]. Therefore, ∼80% of synthetic nitrogen fertilizers produced via the Haber–Bosch process are lost due to inefficiencies in our food systems. We believe that influencing consumer behavior to eat less animal products, improving nitrogen fertilizers use efficiencies, and reducing food waste and losses, is key to achieve net-zero emissions.
Transitioning from a linear to a circular economy that capture and recycle nitrogen from waste can moderate use of resources and energy required to produce synthetic nitrogen fertilizers [6]. Promoting the use of organic fertilizers such as manure or compost can reduce NH3 demand [86]. Animal manure nitrogen outputs are a major source of nitrogen recovery and recycling globally [6]. The digestate produced from anaerobic digestion of livestock manure can be spread over croplands to recover nitrogen [32]. However, organic fertilizers are often more expensive, slower in releasing nutrients, and are not presently capable of supporting the demands of current or future generations [6, 9, 87]. There are also promising scientific developments underway for alternative fertilizers, but many of these approaches need further development. Bioinformatics and plant genomics can both reduce fertilizer usage [88]. Electrochemical synthesis and plasma activated processes are other promising approaches that could be deployed as an alternative to the Haber–Bosch process to produce NH3 [89–95].
5. Conclusions
Synthetic nitrogen fertilizers are envisaged to continue to be a major and growing component of agricultural productivity in the 21st century. Currently, 3.8 billion people are fed from synthetic nitrogen fertilizers. We find that 1.07 billion people are fed from food produced from nitrogen fertilizers imports, and an additional 700 million people are fed from imported fossil fuel feedstocks required for fertilizers production. This highlights the reliance of global food production on trading and fossil fuels, hence its vulnerability to supply and energy shocks. Our country-specific analysis informs about which countries may produce enough fertilizers to meet their domestic demand, which country depends on international trade of fertilizers and fossil fuels to feed their population, and thus which countries are more vulnerable to food, energy, and fertilizers supply shocks. Going beyond the status quo and investigating the interplay between food security and climate targets, we analyze alternative routes that are already available today to abate the carbon footprint of fertilizers via net-zero CO2 emissions in NH3 production. These net-zero routes have the potential to align food system with global climate targets, while increasing food and nutrient security by reducing the reliance of the food system on fossil fuels. However, they will require additional land, water, and energy than business-as-usual production. This highlights the relevance of location-specific analyses, to determine optimal net-zero routes for producing fertilizers based on technical, environmental, and geo-political circumstances.
Acknowledgments
This research was funded by the ClimateWorks Foundation.
P G was partially funded by the Swiss National Science Foundation Exchange Grant No. 214037, for the research stay at Carnegie Institutions for Science, Department of Global Ecology at Stanford.
Data and materials availability
All data that support the findings of this study are included within the article (and any supplementary files).
Conflict of interest
The authors declare no conflict of interest.
Author contributions
L R conceived, designed, and wrote the study with inputs from P G; L R and P G performed the analyses.
Supplementary data (0.1 MB XLSX)
Supplementary data (0.3 MB DOCX)