

Abstract
In the face of global warming, academics have started to consider and analyze the environmental and carbon footprint associated with their professional activity. Among the several sources of greenhouse gas emissions from research activities, air travel—one of the most visible and unequal fractions of this footprint—has received much attention. Of particular interest is the question of how air travel may be related to scientific success or visibility as defined by current academic evaluation norms, notably bibliometric indicators. Existing studies, conducted over a small sample of individuals or within specific disciplines, have demonstrated that the number of citations may be related to air-travel frequency, but have failed to identify a link between air travel and publication rate or h-index. Here, using a comprehensive dataset aggregating the answers from over 6000 respondents to a survey sent to randomly selected scientists and staff across all research disciplines in France, we show that higher individual air travel is associated with a stronger publication rate and h-index. This relationship is robust to the inclusion of the effects of gender, career stage, and disciplines. Our analysis suggests that flying is a means for early-career scientists to obtain scientific visibility, and for senior scientists to maintain this visibility.
Export citation and abstract BibTeX RIS

Original content from this work may be used under the terms of the Creative Commons Attribution 4.0 license. Any further distribution of this work must maintain attribution to the author(s) and the title of the work, journal citation and DOI.
1. Introduction
Academia sits in a particular position with regards to human-induced global warming because of its role in constructing and imparting knowledge on it, including on its consequences on ecosystems and societies. A growing fraction of students and academics are calling for academia to lead by example in cross-sectoral efforts to reduce greenhouse gas(GHG) emissions (e.g. [1–3]). Scientists from various countries and disciplines have begun to investigate their carbon footprint through empirical inquiry, producing a new body of literature dedicated to assessing the carbon footprint of research and identifying its major drivers. These studies mostly concern estimating the carbon footprint of specific activities (e.g. commuting, traveling to conferences, etc [4–9]) or facilities (e.g. telescopes, intensive computing, etc [8, 10, 11]) and, to a lesser extent, investigating the motives and representations of academics as drivers of specific carbon-intensive behaviors [12].
One salient aspect of this emerging literature concerns putative connections between academic success and the air travel-induced carbon footprint of academics [13]. Wynes and collaborators [14] have addressed this question quantitatively by comparing—among other indicators—salaries, total number of citations, and h-index (see [15]) to air travel-induced GHG emissions. By relying on analysis of data from 705 academics at the University of British Columbia, [14] they concluded that there was no relationship between air-travel GHG emissions and academic success. Chalvatzis and Ormosi [16] conducted a detailed study covering over 16 000 speakers in 263 conferences in the field of economics. They found that, on average, the number of citations is related to the number of plane trips undertaken by the author(s) to present these papers at conferences, but that the significance of this relationship depends on the country of residence of the author(s). More specifically, they found no relationship between the total air-travel carbon footprint and citations, except for European academics. Using an online survey, Seuront and collaborators [17] found indications that the number of peer-reviewed publications in the field of marine biology produced either directly or indirectly after attending a scientific meeting increases with the number of meetings. However, they found no significant correlation between the carbon footprint of individuals and the number of papers produced. This is likely due to the very limited size of the sample, with only 75 respondents.
Here, we elaborat on the equation of the relationship between bibliometric indicators and the air-travel frequency of members of the academic community using a large dataset from an online survey in France. The aim is to identify, if it exists, a statistically significant relationship between air travel and the most common measures of scientific visibility, i.e. number of publications and h-index, including all disciplines. The survey was conducted as part of the Labos 1point5 project, which is a nationwide grassroot action, gathering hundreds of scientists from all disciplines in France, to evaluate, understand, and reduce the carbon footprint of research. As part of this project, a series of surveys were first conducted in specific disciplines between 2019 and 2020 followed by a nationwide survey using random sampling, conducted between June and December 2020, which received 6724 answers and which we analyze here.
2. Methods
2.1. Survey
The survey was conducted as part of the Labos 1point5 project and is described in full detail in [18]. Labos 1point5 is a nationwide grassroot action, gathering scientists from all disciplines in France, to evaluate, understand, and reduce the carbon footprint of research. As part of this project, the Labos 1point5 survey was designed to help understand the practices and representations of members of academia in France, in the context of climate change. The survey was conducted from the end of June to the beginning of December 2020. It was sent by email to 30 000 people (regardless of their status or discipline) drawn randomly from the Labintel staff directory created by the Centre National de la Recherche Scientifique (CNRS). Labintel contains over 140 000 contacts from all institutions in France (i.e. universities, national research organizations, Grandes écoles, etc) and all statuses: researchers, professors, technicians, and engineers as well as administrative staff. As a comparison, the total population of personnel involved in higher education and research in France is estimated to be around 170 000, according to official data from the Ministère de l'Enseignement Supérieur, de la Recherche et de l'Innovation on higher education and research personnel. The invitation email 9 was sent as originating from the Labos 1point5 project. It was stated clearly that the data would be analyzed as part of a broad research project, i.e. to conduct academic research. These invitation emails were sent after a nationwide communication campaign by CNRS in support of the Labos 1point5 project, which clearly mentioned this survey. To reduce non-response biases, after the initial survey diffusion in June 2020, people who had received the email were re-solicited in July. In October, people who had started but not completed the survey were solicited again by email.
Six-thousand seven-hundred and twenty-four individuals responded to the survey (i.e. an answering rate of 19.9 ). Among respondents, 4591 (68
 ) provided their number of return flights
10
in 2019 and number of peer-reviewed publications over the 2017–2019 time period, and 1690 (25
) provided their number of return flights
10
in 2019 and number of peer-reviewed publications over the 2017–2019 time period, and 1690 (25 ) provided their number of flights and h-index in 2019. In addition, 3052 (45
 ) provided details of their flights (departure and arrival cities) together with their number of publications, and 959 (14
  ) provided details of their flights together with their h-index. We screened the data for inconsistencies. The three largest h-index values were excluded from the analysis, since they were very unlikely
11
. The number of publications was collected over a three-year period (2017–2019) to provide better sampling, since publication can be somewhat intermittent over time (especially for young scientists). On the other hand, the h-index is already a time-cumulative index. The respondents selected their discipline in a list of nearly 100 disciplines provided by the National Council of Universities, which we aggregated into larger groups (see table S5 for details). Flight details were converted into a travel-induced carbon footprint (in kg of CO2 equivalent), using the method described in [7], which means that we only take into account the direct CO2 emissions (contrails not included).
) provided details of their flights together with their h-index. We screened the data for inconsistencies. The three largest h-index values were excluded from the analysis, since they were very unlikely
11
. The number of publications was collected over a three-year period (2017–2019) to provide better sampling, since publication can be somewhat intermittent over time (especially for young scientists). On the other hand, the h-index is already a time-cumulative index. The respondents selected their discipline in a list of nearly 100 disciplines provided by the National Council of Universities, which we aggregated into larger groups (see table S5 for details). Flight details were converted into a travel-induced carbon footprint (in kg of CO2 equivalent), using the method described in [7], which means that we only take into account the direct CO2 emissions (contrails not included).
2.2. Non-response biases
An important drawback of survey analyses concerns biases in the survey dataset due to non-responses. To evaluate the potential effect of sample attrition, implying biases, we collected information on non-respondents to incorporate this information into our analysis. The information we used originates from two sources: the Labintel directory and the annual report of CNRS. Information from the Labintel directory allows us to compute the response rate to the survey by status and discipline (since the 30 000 emails to which the survey was sent were drawn from this directory). Using the CNRS annual report, we can compute standardized residuals on the survey dataset for the fraction consisting of respondents who are CNRS employees (representing 37% of total respondents; 'CNRS subsample' hereafter). These residuals are defined as:
where o(i) is the observed count for an age or sex category i (e.g. the number of individuals aged between 30–35) among the CNRS employees of the survey dataset and e(i) is the expected value, computed using the information from the annual report of CNRS, which provides the gender and age distribution of its employees. Residual  above 0 indicates that category i is overrepresented in the survey dataset, while
  indicates underrepresentation.
  indicates that the bias is significant. The response rates (status and discipline) and standardized residuals (gender and age) are provided in table S1. Response rates vary by
  with discipline. The lowest response rate corresponds to individuals in humanities (0.20) and chemistry (0.20) and the highest rates to individuals in the fields of earth and universe sciences (astronomy, geophysics, atmospheric and climate sciences, etc) with a rate of 0.31, and ecology and environment (0.28). This suggests that scientists in disciplines related to the environment were more likely to respond to the survey. The response rates by status vary by a larger factor (
 ), with administrative staff and PhD students being the least inclined to respond (0.15 and 0.17, respectively) while permanent researchers and research engineers have a response rate of 0.33 and 0.34, respectively. This shows that there is an important response rate variation as a function of status and a smaller variation with discipline. The potential effects of these varying response rates on the results of the statistical analysis is evaluated in section 2.2. The standardized residuals z indicate that there is no gender bias in the survey dataset (table S1). Men appear to have responded slightly more then women (z = 1.24), but at a non-significant level (
 ). Regarding age, we find that the 25–30 and 30–35 age categories are significantly overrepresented (z = 10.6 and z = 5.64, respectively) in the CNRS subsample. However, these age categories represent only 13% of the respondents in the CNRS subsample. The 60–65 age category is marginally underrepresented (
 ) and represents 10% of the survey dataset. All other age categories, representing 77% of the CNRS subsample, have residuals with
  (table S1), meaning that the survey population is representative of the true population. Overall, this indicates that the age bias in the survey dataset is weak.
2.3. Self-reporting biases
While self-reporting is useful because it allows trips that are not recorded in travel logs to be traced (e.g. when a scientist is invited by another university, it is more difficult to recover the travel logs at their home institute), it can be an additional source of error in further analyses of the data. Declarations of bibliometric indicators, in particular, may suffer from social desirability bias: people are more likely to report a value that suits them better than the actual value [19]. In the case of bibliometrics, this is likely that declared values are overestimated. On the contrary, in reporting the number of flights, people may tend to underreport their trips [20]. The existence of such biases can be assessed from inspection of the histogram of reported values [21]. Figure 1 presents the histograms of the h-indexes, three-year publication rates, and number of flights collected in this survey. Peaks in the histograms at values  are present for h-index and publication rates, and at
  for number of flights, suggesting that some respondents provided a rounded value. Indications that people round up or down can be attested, for instance, by computing a 'heaping index' (see [21, 22]), which compares counts for values ending in the digit 1 or 2 to counts for values ending in the digit 8 or 9 in the histograms. We elaborate on the mathematical heaping index ratio of [21], but to include significance testing based on the amount of data, and for consistency with our bias estimates on age and gender (see the previous section), we compute the standardized heaping index R defined as:
where o(i) is the observed number of counts in bin i. An R value above 0 is indicative of overestimated declared values, while R < 0 is indicative of underestimated declared values. The absolute value of R gives an indication of significance ( meaning a significant value). For
  , we find
  for publications and
  for the h-index. Regarding the number of flights, for
  , we find
  . Hence, the only significant bias we detect is that people with a small number of publications tend to round up to ten. We do not detect a significant bias on the h-index or the declared number of flights. Overall, this indicates that self-reporting biases are not very strong in our dataset.

Figure 1. Upper panels: distributions of h-index, publication rates, and number of flights. Lower panels: histogram of individual CO2 equivalent emissions due to air travel and associated Lorenz curve.
Download figure:
Standard image High-resolution image2.4. Linear regression models
We log-transformed the flight, h-index, and publication rate vectors so as to meet the basic assumption of Gaussian distribution of our model's residuals, and to mitigate the effects of the presence of a few extreme values in the data. We also performed linear regression analysis on non-log-transformed data, and reached the same conclusions. We first assumed a constant effect of air mobility on bibliometric indicators for a given age group, gender, and research fields (see equation in table 1). The results of this linear regression analysis are presented in table 1.
Table 1. Results of linear regression models assessing the association between the (log-transformed) number of return flights and bibliometric indicators (log-transformed publication rate and h-index). Models are of the form 
![$\log(N_\mathrm {Flights}+1)+\beta_2\times [\mathrm {Gender}] +\beta_3\times[\mathrm {Age}] +\beta_4\times[\mathrm {Discipline}]+\epsilon$](https://content.cld.iop.org/journals/1748-9326/17/12/124008/revision4/erlac9b51ieqn23.gif) , where
, where  is a vector containing the bibliometrics proxy (publication rate or h-index),
  is the number of flights,
 ![$[\mathrm {Gender}]$](https://content.cld.iop.org/journals/1748-9326/17/12/124008/revision4/erlac9b51ieqn26.gif) is a binary vector for gender (0 for man, 1 for woman),
is a binary vector for gender (0 for man, 1 for woman), ![$[\mathrm {Age}]$](https://content.cld.iop.org/journals/1748-9326/17/12/124008/revision4/erlac9b51ieqn27.gif) is the age group,
is the age group, ![$[\mathrm {Discipline}]$](https://content.cld.iop.org/journals/1748-9326/17/12/124008/revision4/erlac9b51ieqn28.gif) is the discipline group, and
is the discipline group, and  is the normally distributed error term with mean 0. Coefficient estimates and standard errors are given, together with their statistical significance.
| x (Publication rate) | x (h-index) | |||
|---|---|---|---|---|
| Coefficient | p-value | Coefficient | p-value | |
| β0 (intercept) | 1.83 (0.05) |
 0.001 *** 0.001 *** | 2.52 (0.04) |
 0.001 *** 0.001 *** |
β1 ( ) ) | 0.37 (0.02) |
 0.001 *** 0.001 *** | 0.17 (0.02) |
 0.001 *** 0.001 *** |
| β2 (gender) | −0.14 (0.03) |
 0.001 *** 0.001 *** | −0.03 (0.03) | 0.242 |
| β3 (age) | ||||
| 18–24 yr | −1.53 (0.06) |
 0.001 *** 0.001 *** | −2.35 (0.11) |
 0.001 *** 0.001 *** |
| 25–29 yr | −1.20 (0.04) |
 0.001 *** 0.001 *** | −1.79 (0.06) |
 0.001 *** 0.001 *** |
| 30–34 yr | −0.42 (0.05) |
 0.001 *** 0.001 *** | −0.79 (0.05) |
 0.001 *** 0.001 *** |
| 35–39 yr | −0.09 (0.05) | 0.043 * | −0.30 (0.04) |
 0.001 *** 0.001 *** |
| 40–44 yr | (Ref) | (Ref) | (Ref) | (Ref) |
| 45–49 yr | −0.00 (0.05) | 0.934 | 0.10 (0.04) | 0.009 ** |
| 50–54 yr | −0.05 (0.05) | 0.340 | 0.23 (0.04) |
 0.001 *** 0.001 *** |
| 55–59 yr | −0.07 (0.05) | 0.172 | 0.30 (0.04) |
 0.001 *** 0.001 *** |
 60 yr 60 yr | 0.04 (0.05) | 0.359 | 0.47 (0.04) |
 0.001 *** 0.001 *** |
| β4 (discipline) | ||||
| Law and political science | −0.19 (0.08) | 0.018 * | # | # |
| Business and economics | −0.48 (0.07) |
 0.001 *** 0.001 *** | −0.24 (0.09) | 0.009 ** |
| Literature and languages | −0.02 (0.08) | 0.812 | # | # |
| Sociology, history, and other humanities | −0.18 (0.05) |
 0.001 *** 0.001 *** | −0.13 (0.06) | 0.024 * |
| Mathematics and computer science | −0.18 (0.05) |
 0.001 *** 0.001 *** | 0.09 (0.04) | 0.043 * |
| Physics | 0.31 (0.05) |
 0.001 *** 0.001 *** | 0.40 (0.04) |
 0.001 *** 0.001 *** |
| Chemistry | 0.30 (0.05) |
 0.001 *** 0.001 *** | 0.34 (0.04) |
 0.001 *** 0.001 *** |
| Astronomy and geophysics | 0.32 (0.05) |
 0.001 *** 0.001 *** | 0.45 (0.04) |
 0.001 *** 0.001 *** |
| Mechanics, electronics | (Ref) | (Ref) | (Ref) | (Ref) |
| Biology | 0.06 (0.05) | 0.197 | 0.28 (0.04) |
 0.001 *** 0.001 *** |
| Education, epistemology, and sports | −0.11 (0.13) | 0.367 | # | # |
| Medical sciences and public health | 0.04 (0.06) | 0.498 | 0.29 (0.05) |
 0.001 *** 0.001 *** |
| Other health sciences | 0.10 (0.10) | 0.323 | 0.22 (0.09) | 0.010 * |
*** = p-value  0.001; ** = p-value
  0.01; * = p-value
  0.05. Coefficients for categorical variables are given with respect to the reference category.
To go beyond the assumption of a constant effect of air mobility on bibliometric indicators across all age groups, gender, and research fields, we refined our analysis by including in the model an interaction term between the number of flights and each of these three factors, one after another. We found no significant effect modification by gender, age, or research field, except for a noticeably larger regression coefficient between flying and h-index in the younger age groups (a coefficient of 0.52 for the under 30s vs. 0.15–0.18 for the older age groups). The detailed results of this analysis are presented in table S2.
We also applied linear regression analysis to investigate the association between the log-transformed carbon footprint in CO2eq (instead of number of flights) and first publication rate, second h-index. Although these subsamples are smaller, we also obtained a significant association between the estimated footprint and the publication rate (p < 0.001) and h-index (p < 0.001), in models controlled for gender and age.
One way to take into account the presence of non-response biases in the survey dataset is to include weights in the linear regression analysis [23]. In section 2.2, we show that non-response rates vary significantly with status and, to a lesser extent, with discipline. We therefore compute weight vectors that are the inverse of the response rate in function of the status (table S1) and discipline (tables S1 and S5). We re-apply the regression analysis described above including the status and discipline weight vectors. The results of this analysis are presented in tables S3 and S4, for publications and h-index, respectively. Clearly, the inclusion of weights has a negligible effect both on the coefficients of the linear regression and on the significance of the results. This suggests that the results presented here are robust and that sample attrition is not a major issue.
3. Results
3.1. Distributions of bibliometric indicators and GHG emissions among scientists
In figure 1, we present histograms of the h-index, three-year publication rates, and number of flights of scientists who responded to the survey. The median three-year publication rate is 4 (range: 0–1290, average: 7.4), the median h-index is 18 (range: 0–120, average: 25), and the median number of return flights in 2019 is 0.5 (range: 0–88, average: 1.4). The histograms of the h-index and publication rates are marked by the presence of peaks at each decade (10, 20, 30, 40, etc), which indicate that individuals tend to provide rounded values for these indicators. Interestingly, however, a detailed analysis (see section 2.3) shows that scientists do not seem to round these values up more than down. This likely indicates that there is no effect of 'social desirability' [19] in their declaration, i.e. that they do not preferentially declare a value that suits them better (see section 2.3 for a more complete discussion on social desirability biases).
The histogram of flights also shows peaks at 10, 20, and 30. Similarly, we do not find any trend of under- or overreporting the number of flights (see section 2.3). Overall, a careful inspection of the content of our dataset suggests that self-declarations do not induce structural biases and that scientists tend to report values (for their bibliometric indicators and number of flights) that are rather honest.
In figure 1, we also present the histogram of equivalent CO2 emissions of scientists due to air travel (see section 2.1 for details on the derivation of equivalent CO2 emissions) and associated cumulative density function, or Lorenz curve [24]. The median value for the GHG emissions per capita is 887 kg of CO2eq (range: 0–9994 kg, average: 1262 kg). This average value, which only concerns traveling by plane for professional reasons, is equal to 13% of the average annual footprint of French citizens. The Lorenz curve indicates that emissions are distributed unequally. The 20% most frequent flyers are responsible for over half (53%) of air travel GHG emissions. The 20% of the population that travel the least emit only 3% of the total GHGs related to air travel in our dataset. The Gini coefficient [25] of the distribution of emissions is G = 0.50, lower (less unequal) than what was found for the specific case of the École Polytechnique Fédérale de Lausanne (EPFL) in Switzerland, i.e. G = 0.72 [26]. This difference may be explained, at least partially, by the fact that flying in business class is important at EPFL (30% of total air travel GHG emissions at EPFL are due to flights in business), while for French scientists it is extremely rare, as it is not allowed for travel paid for by most French institutions. Flying business class results in increased per capita GHG emissions since emission factors are larger than that of economy class due to increased floorspace requirements (see supplementary info in [26]). Because these emissions emanate from a limited number of frequent flyers, this results in an increased G.
3.2. Relationship between flying and bibliometric indicators
In figure 2, we present a comparison between the three-year publication rate, h-index, and number of flights. Figure 2 shows that the median three-year publication rate increases gradually with the number of flights, from  publications for 0 flights, to
  for the most frequent flyers with above 20 flights a year; the median h-index rises from 17 to 29. The marginal probability density functions, also presented in this figure, show that the most probable value for people who take 0 flights is one publication every three years and an h-index of 14, while for the most frequent flyers (
 20 flights) the most probable number of publications in three years is ten and the h-index is 23. While this is suggestive of a relationship between these two variables, a more detailed analysis is required. We therefore relied on linear regression models (see section 2.4 for details on the linear regression analysis) to quantitatively investigate the association between the number of flights and first publication rate, second h-index. We included age, gender, and discipline in our models, because these variables are likely to play a confounding role on both bibliometrics and air travel. We found that academic air travel is associated with both publication rate and h-index (table 1). More specifically, when the number of flights increases from 0 to 9, the number of publications is multiplied by 2.34 (95
 confidence interval: 2.14–2.51), and the h-index increases by a factor of 1.48 (95
 CI: 1.28–1.58).

Figure 2. Relationship between the number of return flights and bibliometric indicators. Boxplots of publication rates derived over the 2017–2019 period (upper figure) and declared h-index in 2020 (lower figure) of researchers, as a function of the total number of flights taken during the year 2019. The upper and lower limits of each box correspond to the 25th and 75th percentiles of the distribution. The dots display the values that are located outside these limits. The normalized probability density function (obtained using kernel density estimates) is provided on the left-hand side panel for each number of flights interval.
Download figure:
Standard image High-resolution imageAge has an important effect on publication rate for the youngest scientists (table 1), and is, as expected, a determinant factor of h-index values since it is a time-cumulative index.
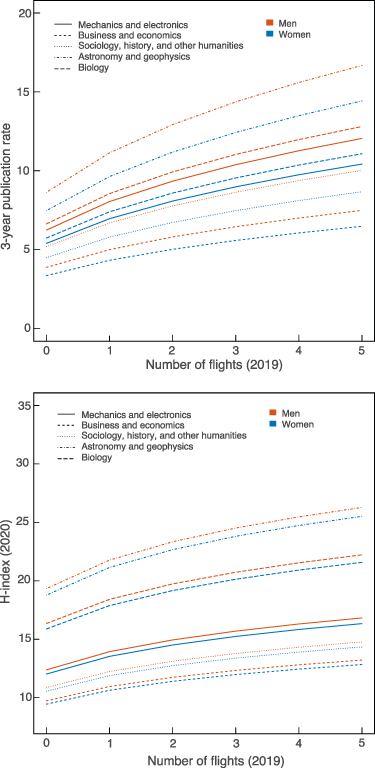
Graphical representations of the models are presented in figure 3 to illustrate the effects of specific variables and their intensity, for a given age category (40–44). This figure shows that gender has a significant effect on the rate of publication (with women publishing less than men). This effect is less pronounced on the h-index. The effects of gender, age, and discipline on bibliometrics have been discussed in earlier studies (e.g. [27–29]), and our results are in agreement with these earlier studies. Figure 3 and table 1 also show that publication rates and h-index also depend on discipline with, for instance, astronomy and geophysics showing a much higher publication rate and h-index compared to biology or sociology. However, the trend is clear for all disciplines that increased flying results in an increase of publication rate and h-index. Overall, the result of our analysis is that the number of flights is a robust and significant determinant of publication rate and h-index, even if other variables such as age, gender, and discipline play a role.
Figure 3. Graphical representation of the model results for the 40–44 year old age group, for both genders and several disciplines. Three-year publication rate (upper) and h-index (lower)  . number of return flights. Here, models are shown after inverse log-transform so that the variables of interest can directly be compared.
Download figure:
Standard image High-resolution image
4. Discussion
Overall, our analysis suggests that researchers who travel more frequently by plane, and emit the largest quantities of air travel-related GHGs, have significantly higher publication rates and a significantly larger h-index.
The results of this analysis challenges the conclusions of [14], which did not identify a significant statistical relationship between the h-index and number of flights or GHG emissions. There are several explanations for this apparent contradiction. First, Wynes et al relied on a sample of high-level academics from a highly ranked university, whereas we rely on a random sampling of an entire research community. This provides a significantly larger sample (two times larger here for the h-index, five times larger for the number of publications), with a likely larger variance for h-index and publication rates, which increases the probability of identifying small but significant statistical relationships (i.e. statistical power). For completeness, we conducted the same test as Wynes and collaborators [14] on our data, i.e. a Spearman correlation analysis, and we found, as opposed to them, that the correlation between the h-index/publication rate and flights is statistically significant ( for publications and
  for h-index, both with p < 0.001). Second, it is in fact possible to reconcile our results with those of Wynes et al considering that [16] found a significant effect of air-travel footprint on citations (and thus h-index) for European academics but not for North American academics. This suggests that the effect of flying over long distances on the h-index is greater for Europeans, which includes French academics. The results presented here and in earlier works can be questioned in the frame of scientific visibility [16]: is it that scientists who travel more obtain more scientific visibility and hence get more citations, collaborations, and papers (exposure effect), or is it instead that scientists who are more visible because of their work get to travel more (reputation effect)? This is a difficult question, which will require additional studies relying on panel data and ethnographic work to decipher the determinants of academic traveling and the broader role of 'network capital' [30] in scientific careers.
However, the data presented in this paper and in the survey results can provide some indications on the stratification of exposure and reputation effects as a function of status: 65% of the air travel of postdocs is related to presenting results at a conference, while it is only 42% for senior researchers. This suggests that early-career scientists are more inclined to travel to conferences in order to increase their scientific visibility. This is also supported by the results presented in table 1, where it can be seen that younger scientists ( 35) are more affected by their age (higher absolute value of coefficients β3) in their publication rates than scientists above 35 who are more established
12
. Although conferences represent a smaller share of the motives of air travel for senior researchers, their average total distance traveled by plane (16 101 km) is over twice that of the average distance traveled by postdocs (7698 km). This suggests that senior researchers tend to benefit from their reputation and status and maintain a culture of academic travel as part of a system where it is largely legitimized by institutions and often viewed as a mark of success [31]. Overall, this is in line with the idea that air travel is helpful to obtain some form of scientific capital (publications, citations, prizes, grants, etc) at an early career stage, and to maintain it at a more advanced career stage [31, 32]. The travel restrictions imposed by the Covid-19 pandemic have forced the academic community to adapt to online events. In the Labos 1point5 survey, 68% of respondents declared that they have a more favorable opinion regarding the use of videoconferencing now than before the first lockdown in France (March 2020). As illustrated by several studies, videoconferencing has a highly positive impact on travel-related GHG emissions [2, 33] but also on diversity, equity, and inclusion [34, 35] in conferences. The reduction of air travel in academia can thus be articulated with a more equitable and more sustainable distribution of scientific visibility, to include early-career researchers, or researchers with family or medical constraints, or working in countries from which it is complicated, for visa or budget reasons, to travel [36].
35) are more affected by their age (higher absolute value of coefficients β3) in their publication rates than scientists above 35 who are more established
12
. Although conferences represent a smaller share of the motives of air travel for senior researchers, their average total distance traveled by plane (16 101 km) is over twice that of the average distance traveled by postdocs (7698 km). This suggests that senior researchers tend to benefit from their reputation and status and maintain a culture of academic travel as part of a system where it is largely legitimized by institutions and often viewed as a mark of success [31]. Overall, this is in line with the idea that air travel is helpful to obtain some form of scientific capital (publications, citations, prizes, grants, etc) at an early career stage, and to maintain it at a more advanced career stage [31, 32]. The travel restrictions imposed by the Covid-19 pandemic have forced the academic community to adapt to online events. In the Labos 1point5 survey, 68% of respondents declared that they have a more favorable opinion regarding the use of videoconferencing now than before the first lockdown in France (March 2020). As illustrated by several studies, videoconferencing has a highly positive impact on travel-related GHG emissions [2, 33] but also on diversity, equity, and inclusion [34, 35] in conferences. The reduction of air travel in academia can thus be articulated with a more equitable and more sustainable distribution of scientific visibility, to include early-career researchers, or researchers with family or medical constraints, or working in countries from which it is complicated, for visa or budget reasons, to travel [36].
Adjustments based on a modification of evaluation metrics (e.g. integrating carbon footprint metrics in quantitative evaluation) or based on their use within academia (e.g. removing international conferences from career evaluations) may appear to be satisfying options. Unfortunately, these do not prevent us from the misuses of metrics [37] and, without consideration for inequalities in access to resources, the use of these new metrics may result in a transfer of the competitive mechanisms driving carbon-intensive resources to other types of resources. Instead, according to us, there is an opportunity to set up a more general discussion on the scientific benefits of any given carbon ton emitted or, here, question the scientific value of our professional travel choices, in a context where traveling is also often experienced as a strain [31]. In fact, this discussion already exists in several labs or research teams, based on an assessment of the lab's carbon footprint [7] followed by exploration of a range of mitigation options. Guidelines (e.g. decision trees [38, 39]), economic incentives (e.g. a carbon tax on financed projects [40, 41]), or travel limitations based on individual or collective quotas [42] are for instance experimented, allowing both to reduce the carbon footprint and share exposure (hence visibility) more equally. Our conviction, fed by three years of experience in the Labos 1point5 project, is that it cannot only be left to individuals to make these decisions, and that much more robust and fair transformations can be achieved with collective decision-making (at the scale of a research project, team, department, conference, or institution).
Acknowledgments
This research is part of the Labos 1point5 groupement de recherche (GDR), which is financially supported by ADEME, CNRS, and INRAE. We thank all the members of the Labos 1point5 project for fruitful discussions and feedback, which helped to design and conduct this analysis. We thank the designers of the Labos 1point5 sociological survey: M Blanchard, M Bouchet-Valat, D Carton, J Greffion, and J Gros. The authors would also like to thank J Siméant-Germanos and E Ollion for their helpful comments. We thank S Wynes for fruitful discussions regarding their analysis.
Data availability statement
The data generated and/or analyzed during the current study can be made available from the corresponding authors on reasonable request.
Conflicts of interest
There are no conflicts of interest to declare.
Footnotes
- 9
This email as well as the follow-up emails are provided in the PDF document of the survey.
- 10
In case they had done one-way flights, respondents could declare 0.5 return flights.
- 11
These values of the h-index are higher than any value reported for Highly Cited Researchers by Web of Science in France: https://recognition.webofscience.com/awards/highly-cited/2020/.
- 12
The average age at which scientists obtain a permanent position in France is between 30 and 35.
Supplementary data (0.4 MB PDF)