

Abstract
Agricultural expansion into tropical and subtropical forests often leads to major social-ecological trade-offs. Yet, despite ever-more detailed information on where deforestation occurs, how agriculture expands into forests remains unclear, which is hampered by a lack of spatially and temporally detailed reconstruction of agricultural expansion. Here, we developed and mapped a novel set of metrics that quantify agricultural frontier processes at unprecedented spatial and temporal detail. Specifically, we first derived consistent annual time series of land-use/cover to, second, describe archetypical patterns of frontier expansion, pertaining to the speed, the diffusion and activity of deforestation, as well as post-deforestation land use. We exemplify this approach for understanding agricultural frontier expansion across the entire South American Chaco (1.1 million km2), a global deforestation hotspot. Our study provides three major insights. First, agricultural expansion has been rampant in the Chaco, with more than 19.3 million ha of woodlands converted between 1985 and 2020, including a surge in deforestation after 2019. Second, land-use trajectories connected to frontier processes have changed in major ways over the 35 year study period we studied, including substantial regional variations. For instance, while ranching expansion drove most of the deforestation in the 1980s and 1990s, cropland expansion dominated during the mid-2000s in Argentina, but not in Paraguay. Similarly, 40% of all areas deforested were initially used for ranching, but later on converted to cropping. Accounting for post-deforestation land-use change is thus needed to properly attribute deforestation and associated environmental impacts, such as carbon emissions or biodiversity loss, to commodities. Finally, we identified major, recurrent frontier types that may be a useful spatial template for land governance to match policies to specific frontier situations. Collectively, our study reveals the diversity of frontier processes and how frontier metrics can capture and structure this diversity to uncover major patterns of human–nature interactions, which can be used to guide spatially-targeted policies.
Export citation and abstract BibTeX RIS

Original content from this work may be used under the terms of the Creative Commons Attribution 4.0 license. Any further distribution of this work must maintain attribution to the author(s) and the title of the work, journal citation and DOI.
1. Introduction
Agricultural expansion into natural areas has helped to meet the growing global demand for food, feed, and fiber (Godfray et al 2010), but has also produced unsustainable land-use outcomes. Agricultural expansion causes widespread deforestation in tropical and subtropical forests, triggering globally-relevant greenhouse gas emissions (Carlson et al 2017), biodiversity losses (Chaplin-Kramer et al 2015), and major livelihood impacts on forest-dependent people (Andersson and Agrawal 2011, Oldekop et al 2020). Much of the agricultural expansion during the past decades has taken place in the tropics (Gibbs et al 2010), where most of the last uncultivated, productive lands are found (Ramankutty et al 2002, Lambin et al 2013). Sustainability planning to prevent or minimize undesirable social-ecological outcomes in regions where agriculture expands is thus needed.
This, first and foremost, requires a robust understanding of where and how frontiers expand. Considerable progress has been made on the prior, that is mapping where deforestation takes place (Hansen et al 2013, Turubanova et al 2018, Vancutsem et al 2021, Zalles et al 2021). Yet, mapping how agricultural frontiers progress is more complex, and requires a thorough understanding of the underlying processes inherent in frontier dynamics. For example, some frontiers advance slowly while others erupt rapidly (Kröger and Nygren 2020), some frontiers grow outward while others leap-frog to remote places (Bowman et al 2012), and some frontiers accelerate while others consolidate and slow down (Bonilla-Moheno and Aide 2020). Likewise, a wide range of land-use-actors drive frontier expansion, such as swidden cultivators (Vieilledent et al 2018), forest smallholders (Tyukavina et al 2018, Phiri et al 2019), or agribusinesses (Klink and Machado 2005). Further, in some regions, frontiers may be considered old or suspended, whereas in other regions new frontiers emerge. Lastly, land-use trajectories after initial deforestation are diverse (Hosonuma et al 2012, De Sy et al 2019, Souza et al 2020, Song et al 2021). Although methods to quantitatively characterize such complexity across large agricultural frontiers are still underdeveloped, there is a need to capture and describe complex frontier dynamics to support context-specific land governance and address sustainability challenges in frontier regions (Pacheco et al 2021). Archetype analyses aimed at identifying major patterns of human–environment interactions (Lambin et al 2003, Geist and Lambin 2004, Eisenack et al 2006, 2019, Oberlack et al 2019, Sietz et al 2019, Rocha et al 2020), such as typical land systems (Vaclavik et al 2013, Levers et al 2018), land-use change trajectories (Levers et al 2018, Meyfroidt et al 2018), or land-use outcomes (Cumming et al 2014, Pacheco-Romero et al 2021), are a potentially powerful way to structure diversity and complexity of land-use dynamics for that purpose.
Mapping archetypical patterns of frontier processes and better identifying what drives them could enable more nuanced land governance. For example, identifying emerging frontiers would allow for proactive land-use and conservation planning (e.g. zoning), whereas reactive interventions (e.g. forest protection) would be needed where frontiers are particularly active (Hansen et al 2020). Likewise, where frontiers consolidate, restoration opportunities might unfold, as land-use actors are more interested in long-term sustainability (Latawiec et al 2015, Lerner et al 2015, Strassburg et al 2017). Disentangling frontier dynamics can furthermore help to identify actor-specific governance interventions. For example, historically, frontiers have mainly been driven by smallholders (Barbier 2012, Pacheco 2012, Godar et al 2014), but since the late 1990s, capital-intensive, influential actors have been driving frontiers to produce commodities for global markets (Rudel 2007, Kröger and Nygren 2020). Such commodity frontiers are typically characterized by agglomeration effects (Garrett et al 2013, Austin et al 2017, Richards 2018) and are sensitive to macroeconomic and trade signals, which can produce abrupt accelerations of frontier dynamics. In addition, land-use actors in commodity frontiers are potentially responsive to market-based interventions (Zu Ermgassen et al 2020), for example through supply-chain governance interventions or certification systems (Baynes et al 2015). Finally, identifying recurring patterns of frontier will allow for assessments of what explains these key dynamics, which directly contributes to building theories in land system science (Meyfroidt et al 2018, Turner et al 2020). Yet, we lack a robust understanding and a set of quantitative indicators that capture how frontiers unfold.
Increasing access to satellite images along with new processing capabilities offer new opportunities for understanding frontier dynamics at unprecedented temporal and spatial resolution (Gorelick et al 2017, Wulder et al 2019, Woodcock et al 2020), yet these opportunities have so far not been explored. Prior work on assessing frontiers has mostly focused on mapping deforestation (Hansen et al 2013, Müller et al 2016, Griffiths et al 2018, Vancutsem et al 2021), what follows deforestation (Zalles et al 2019, 2021, Souza et al 2020, Song et al 2021) or, most recently, who drives deforestation frontiers (Curtis et al 2018, Pacheco et al 2021). The question of how frontier dynamics unfold, beyond identifying hotspots of deforestation (Harris et al 2017, Tyukavina et al 2018, Potapov et al 2019), remains largely unexplored. Specifically, remote-sensing time series should allow to describe speed at which frontiers expand (e.g. slow vs. fast progressing), frontier stage (e.g. emerging, active, consolidated) or the frontier diffusion process (e.g. gradually progressing vs. leap-frogging frontiers). Translating land-cover time series into such process-based system metrics requires overcoming two key challenges. First, it requires deriving consistent time series that do not solely represent collections of individual maps, as error propagation makes analyzing changes between these maps and the derivation of process-based metrics difficult to interpret (Friedl et al 2010, Sulla-Menashe et al 2019, Liu et al 2020). Second, it requires separating human land-use change or management changes (e.g. fallow periods, logging) from other land-cover change such as natural disturbances (e.g. fire) (Gómez et al 2016). Overcoming these challenges and establishing consistent time series that represent land-use change would mean a step-change towards translating process-based metrics for better understanding deforestation frontier dynamics.
A better understanding of frontier dynamics is particularly urgent for the world's subtropical tropical dry forests and savannas (hereafter: dry forests). Frontiers have expanded particularly rapidly in these forests over the last decades, but dry forests have received much less attention than rainforests (Miles et al 2006, Pennington et al 2018). This is surprising, given that dry forests account for nearly 40% of all tropical forests (Murphy and Lugo 1986), harbor high biodiversity (Mayle et al 2007), and account for about 30% of the terrestrial primary productivity (Grace et al 2006). Dry forest loss has been particularly widespread in South America where agricultural expansion since the early 2000s has turned several dry forest regions into a global deforestation hotspots (Hansen et al 2013, Pacheco et al 2021, Buchadas et al 2022). One of these hotspots is the Gran Chaco in South America shared by Argentina, Bolivia, and Paraguay, where agricultural expansion has been rampant (Hansen et al 2013) mostly for beef and cash crop production (Gasparri and Baldi 2013, Fehlenberg et al 2017). Where deforestation has occurred in the Chaco is relatively well-understood (Killeen et al 2007, Gasparri and Grau 2009, Vallejos et al 2015), including post-deforestation land-uses (Boletta et al 2006, Campos-Krauer and Wisely 2011, Volante et al 2012, Caldas et al 2015, Baumann et al 2017), and the importance of actors in shaping these pattern (le Polain de Waroux et al 2018, Levers et al 2021). Yet, how the diversity of actors and social-ecological conditions has produced different types of frontier patterns remains unclear.
Our overarching goal was to develop and test a novel set of frontier metrics that quantitatively describe frontier processes across space and over time. We demonstrate the value of these metrics by deriving archetypical pattern of frontier dynamics driven by agricultural expansion for the Chaco, across the entire history of modern agricultural expansion (1985–2020). Doing so required us to develop the first consistent, spatio-temporally detailed land-cover reconstruction for this global deforestation hotspot. Specifically, we asked the following questions:
- (a)How can frontier processes and dynamics be described using satellite-based time-series of land cover?
- (b)Where and how have agricultural frontiers expanded into the Chaco's forests since 1985?
- (c)What are archetypical frontier dynamics, including post-deforestation land use change?
2. Methods
2.1. Study area
The Chaco is a 1.1 million km2 ecoregion in South America, extending into Argentina, Bolivia, and Paraguay. Mean annual temperature in the Chaco is 22 °C, and annual precipitation shows a pronounced east-west-gradient from 1200 mm in the humid Chaco to 400 mm in the driest regions in the southwest (Bucher 1982). The Chaco is subdivided into the dry Chaco in the west, where xerophyllous forests are dominant and cropping and intensive ranching are dominant, and the wet Chaco in the east where widespread wetlands together with palm savannas and intermixed grasslands for a diverse mosaic of vegetation (Bucher 1982). Historically, land use in the Chaco was dominated by small-scale producers, such as the Eastern European colonies in the Chaco province, or forest smallholders who used a few hectares of land for subsistence cropping to sell on local markets, and the surrounding woodlands to gather firewood and material for rural construction, as well as forest grazing of roaming livestock (Fatecha 1989, Bucher and Huszar 1999). While smallholders continue to be important in parts of the Chaco (Levers et al 2021), the emergence and rapid expansion of large-scale agribusinesses has happened over wide areas since the 1990s. These actors have substantial capital and knowledge on the existence and the amount of expected land rent, allowing them to quickly and efficiently capitalize on opportunities that frontier situations entail (le Polain de Waroux 2019). Together with the liberalization of genetically modified soybean variants in the Chaco during the 1990s (Reenberg and Fenger 2011), the introduction of highly productive pasture grasses (e.g. Gatton panic (Panicum maximum)) (Vazquez 2013), and the changing export policies of Argentina in reaction to the peso devaluation in 2001 (Leguizamon 2014), this has converted the Chaco into a global deforestation hotspot in the 2000s and 2010s (Hansen et al 2013, Baumann et al 2017).
2.2. Overview of methodology
Our analytical framework contains three main steps (figure 1). We provide a summary of our methodology here, and a detailed, step-by-step description in the supporting information (text S1–S3). In step 1, we re-constructed land cover across the entire Chaco, annually and consistently for the period 1985–2020. To do so, we made full use of the Landsat satellite archive (>80 000 images) and derived an annual time series of spectral-temporal metrics (STM) (Oeser et al 2020), which we combined with a comprehensive set of training data in a random forest regression framework to derive annual classification probabilities for the classes: (a) woodlands, (b) other vegetation (i.e. natural grasslands, palm savannas), (c) croplands, (d) pastures, and (e) other land covers (i.e. water, bare land, urban areas). Using these probabilities, we then mapped six land-cover transitions (table S1). We validated each individual map (i.e. 1985–2020) using an independent set of random points, which we evaluated through on-screen interpretation of spectral profiles (e.g. pastures exhibit a different phenological profile throughout the year compared to croplands), mean STM composites of the dry and wet season, and, where available, high-resolution imagery in Google Earth and Bing maps as well as Planet Labs. Based on these points we generated error matrices, calculated overall accuracies as well as class-wise user's and producer's accuracies, and calculated area estimates including confidence intervals of each land-cover class (Olofsson et al 2014). Lastly, we aggregated the 30 × 30 m2 land-cover maps into two datasets at 1.5 × 1.5 km2 resolution: a time series of fractional woodland cover 1985–2020, and a time series of dominant agricultural land cover (i.e. pasture or cropland).

Figure 1. Framework for identifying and characterizing deforestation frontiers. In step 1, we used the Landsat archive to derive consistent land-cover/use time series. Step 2 then derived and mapped six frontier metrics, and sub-categorized each metric (e.g. the metric 'Frontier speed' into 'Slow', 'Medium' and 'Fast'). Finally, step 3 uses the frontier metrics to identify archetypical frontier dynamics and analyzes them.
Download figure:
Standard image High-resolution imageIn step 2, we identified frontier areas (i.e. areas with at least 0.5% woodland loss (Rodrigues et al 2009, Buchadas et al 2022) during three consecutive years and where the final land cover was either cropland or pasture; more information in text S1) and derived six frontier metrics for these areas, which reflect key aspects of frontier processes (table 1): (a) we defined frontier timing, describing woodland change 2016–2020 (i.e. the last five years of the time series) relative to 1985–2015. The rationale for this metric was that the temporal course of the frontier determines the type of intervention. (b) We assessed frontier speed, representing the strongest annual woodland loss, which determines the focus of regional or national policies aiming at conserving remaining woodlands. (c) Frontier naturalness refers to woodlands left relative to the baseline woodlands, which influences the balances of priorities between conservation and restoration. (d) Frontier diffusion distinguished between gradual and leap-frogging frontiers, serving as an indicator for the type of actor being dominant in these areas. (e) Frontier onset, described the starting year of frontier development and allows for a temporal evaluation of the emergence of different frontier types during our study period. (f) Frontier land use, describing land use after woodland loss.
Table 1. Rationale and relevance of the six metrics describing processes in agricultural frontiers.
| Metric | Variable | Types and explanation | Rationale and relevance |
|---|---|---|---|
| Frontier timing | Temporal course of the frontier | 1. Active (frontiers that are active fronts) 2. Suspended (frontiers that were active but then appear inactive) 3. Emerging (frontiers that are newly appearing) | Different types of activity require different interventions:
|
| Frontier land use | Post-deforestation land-use trajectories | 1. Pasture 2. Cropland 3. Transition (frontier that was dominated by pasture first, but shifted to croplands) | Different land uses are operated by di y to incentives and interventions. Supply chain interventions need to target the key commodities in a frontier.
|
| Frontier speed | Rate of fastest woodland loss | 1. Slow 2. Medium 3. Fast | The speed with which frontiers progress determines the focus of regional/national policies aiming at conserving remaining woodlands.
|
| Frontier diffusion | Spatial distance to other frontiers | 1. Progressing (frontiers, that diffuse through spatial contagion) 2. Leapfrogging (new nexus of frontiers that can then diffuse by contagion) | How frontiers diffuse represent the group of actors in these areas and require different types of interventions.
|
| Frontier naturalness | Remaining woodland | 1. High 2. Medium 3. Low | The level of remaining woodland cover can influence the balance of priorities between conservation and restoration.
|
| Frontier onset | Year of start of woodland loss | Year | The year of onset represents the timing of frontier dynamics; normally precedes maximum woodland loss. |
In step 3, we reconstructed how frontiers have unfolded across the region by characterizing the spatio-temporal pattern of our frontier metrics for the time period 1985–2020. First, we assessed frontier dynamics by relating our metric frontier onset (i.e. the year of emergence of a frontier pixel) to the other five frontier metrics in order to find temporal patterns of frontier emergence, and summarized each frontier type for each year of our analysis 1985–2020. We did this for the whole Chaco, the Chaco sections in the three countries, as well as the dry and wet Chaco separately. Second, we identified archetypical frontier dynamics, by (a) identifying typical combinations of frontier metrics across the entire Chaco, and (b) by quantitatively evaluating our metrics in frontier regions identified in previous research (le Polain de Waroux et al 2018). To do so, we used the three most common metric combinations per region and assigned the majority of a category.
3. Results
Forest loss has been rampant in the Chaco with a total of 193 321 km2 (28%) of woodlands lost since 1985. Woodland loss increased steadily until 2009/10, when we found highest annual loss rates (1.7%, equaling 10 167 km2 in 2009 and 9507 km2 in 2010), with loss rates declining thereafter (1.1% on average 2011–2019). Most of the woodland loss in 1985–2020 occurred in Argentina (103 480 km2; average annual loss rate of 0.9%), followed by Paraguay (77 850 km2, 1.3%), and Bolivia (11 989 km2, 0.35%). Alarmingly, our analyses revealed a recent surge in woodland loss, in 2019/20, with the highest woodland loss rate registered since the previous high in 2009/2010 (1.7%). The highest rates of woodland loss occurred in the wet Chaco (3.3%, figures 2 and 3).

Figure 2. Agricultural expansion into Chaco woodlands. The map shows the extent of natural vegetation and agriculture in 2020; the two times series (Landsat images and classification) show frontier evolution in the Argentinean Chaco (pink marker, left) and the Paraguayan Chaco (blue marker, right). The white line marks the border between the dry (west) and wet (east) Chaco.
Download figure:
Standard image High-resolution image
Figure 3. Woodland loss in the Chaco 1985–2020. (A) Annual areas and rates of woodland loss for the entire Chaco, the dry and wet Chaco, and the three Chaco countries. (B) Initial land cover after deforestation and land cover in 2020, the last year we analyzed. Note that the change from 'other vegetation' to 'cropland' could be a single transition or a series of two transitions (i.e. from 'other vegetation' to 'pasture' and then to 'cropland'), but this is separated in this graph.
Download figure:
Standard image High-resolution imageOur classifications had high overall accuracies, on average 86.1% (max: 93.9%, min: 77.1%). Average user's and producer's accuracy of the woodland class were also high and ranged between 90.6% and 96.9%, whereas accuracy for the cropland class (73.6%–61.5%) and pasture class (74.1%–81.5%) where somewhat lower (see supplementary material for more detailed information on class-wise accuracies).
Of the total woodlands loss we identified, the dominant initial proximate cause was pasture expansion (47%) followed by cropland expansion (2.5%), while 50.5% were disturbed but did convert to cropland or pasture right after woodland loss had occurred. These patterns varied slightly across countries, as well as for the dry and wet Chaco. In Argentina, pasture expansion was the dominant proximate cause of deforestation (34.4%), whereas only 3.6% were deforested for being immediately used as cropland. An additional 64 000 km2 of woodlands were disturbed (62%). In Bolivia and Paraguay, pasture expansion was the dominant proximate cause of deforestation (57.1% and 61.4% of all woodland loss, respectively), whereas cropland expansion (2.0% and 0.7%, respectively) only had a minor importance as a proximate cause. An additional 4908 km2 (40.9%) and 29 570 km2 (37.9%) of woodlands were disturbed in Bolivia and Paraguay, respectively. In the dry Chaco, pasture expansion was the most dominant proximate cause of deforestation (51.8%), followed by cropland expansion (2.9%). Contrary, only 28.0% and 0.4% of woodland loss in the wet Chaco was due to pasture or cropland expansion, respectively (figure 3(B)).
Land cover in 2020 often differed compared to the initial post-deforestation land cover. Across the Chaco, nearly 37% of all woodlands that were not converted into agriculture immediately, (i.e. were classified as disturbed forest) were later converted to pastures (29 635 km2) or cropland (6707 km2), and 17% of all areas initially converted into pastures became cropland later on (15 279 km2). This trend was strongest in Paraguay, where 43.2% of all deforested areas became agriculture by 2020, from which 98.2% became pasture (42.5%), and 1.8% cropland, followed by Bolivia (35.35% of all deforestation, 94.8% of these became pasture and 5.2% cropland) and Argentina (34.1% of all deforestation, of which 70.1% for pasture and 29.9% for cropland). In Argentina, 40.1% of all areas where post-deforestation land use was pastures later became cropland (14 244 km2), whereas in Paraguay (1.3%) and Bolivia (6.0%) this trend was weaker (figure 3).
Our six frontier metrics provided further insight into the dynamics of agricultural expansion in the Chaco, revealing typical frontiers patterns (figures 4 and 5). Most frontier areas were identified as old frontiers, classified as either suspended (48.0%) or active (51.2%), whereas we classified only a minor proportion of the Chaco as emerging frontiers (0.7%, primarily in Paraguay). As highlighted above, only a minor proportion of the frontier areas were classified as cropland frontiers (2.2%, direct conversion from woodlands to croplands), whereas most frontiers were due to pasture expansion, either directly (80.3%) or with a time lag (e.g. 17.5%, with a time lag of >3 years; figure 4). Most frontiers in the Chaco were characterized as slow (63.2%), with fast (28.2%) and medium frontiers (8.6%) less common. As can be expected, progressing frontiers formed the overwhelming type of frontier expansion (98.8%) compared to leapfrogging frontiers (1.2%; primarily in Argentina and Paraguay). Lastly, remaining woodlands in frontiers were either low (45.6%) or medium (32.8%), whereas in only 21.6% woodlands were high.

Figure 4. Frontier dynamics in the Chaco according to our six frontier metrics (table 1). We note that the x-axis for 'frontier timing' represents the metric category in 2020, at the end of our time series (i.e. suspended, active, emerging) in 2020.
Download figure:
Standard image High-resolution image
Figure 5. Spatial representation of our six frontier metrics, following our theoretical reasoning from table 1.
Download figure:
Standard image High-resolution imageThe temporal evolution of our frontier metrics varied substantially between the three countries. For example, while Argentina experienced its peak of new frontier areas in 2002, in Paraguay this peak occurred much later (2008) and earlier in Bolivia (1995). In all three countries the peak of new frontier areas was also associated with the largest amount of fast progressing frontiers. Interestingly, with regards to frontier land use Argentina features distinct periods of frontier emergence that is not visible in Bolivia or Paraguay: while pasture was the dominant frontier land use around 2002 (i.e. during the peak of new frontier emergence), we found that transition frontiers occurred earlier (i.e. ∼1995–1998) whereas cropland frontiers emerged only during a short period of time (∼2005–2007, figure 4).
Integrating our frontier metrics across the Chaco showed that the Chaco is dominated by a set of archetypical frontier types. Out of 162 possible combinations of metric levels, 59.8% all frontier areas fell into ten distinct combinations (hereafter: frontier types, figure 5). Across the entire Chaco, these ten most prevalent frontier types were all characterized as progressing frontiers, though with differences regarding frontier timing (39.8% are active vs. 19.9% suspended) and frontier naturalness (13.5% high, 17.8% medium, 27.9% low). The most common frontier type comprised 17.8% of the study area and was an active pasture frontier that is slowly progressing with medium naturalness. At the country-level we also found distinct differences. For example, while in Bolivia and Paraguay the ten most common frontier types were all pasture frontiers, this was not the case in Argentina, where four out of the ten most common frontier types were transition frontiers. Likewise, naturalness in Argentina was generally medium, whereas it was generally high and low in Bolivia and Paraguay, respectively. Contrary, all three countries had a large proportion of active frontiers (Argentina: 55.6% of the total area, Bolivia: 71.8%, Paraguay: 48.9%) that were generally progressing slowly (Argentina 76.3%, Bolivia 82.4%, Paraguay 60.4%; figure 6). With regards to the dry and wet Chaco, we found that while the wet Chaco exclusively was dominated by active pasture frontiers, we found in the dry Chaco a mix of pasture and transition frontiers.
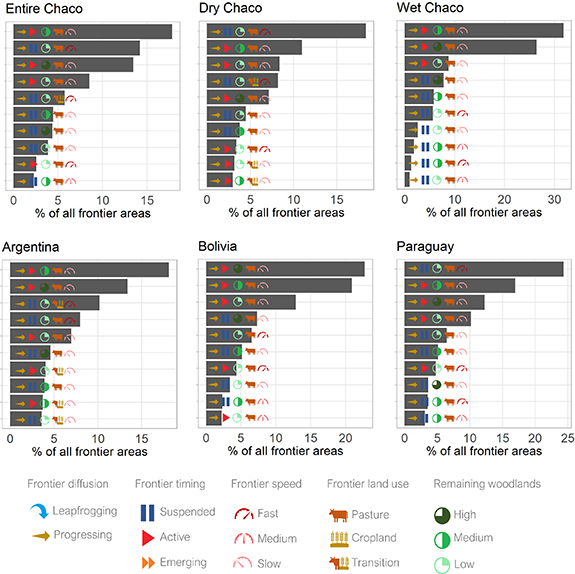
Figure 6. The ten most common combinations of the frontier metric levels (i.e. frontier types), and their relative share on all frontier areas. Results are presented for the entire Chaco and separated by the three countries as well as for the dry and wet Chaco. For a complete list of frontier types and their area share please refer to table S1 in the supplementary material.
Download figure:
Standard image High-resolution imageAssociating our metrics with qualitatively outlined frontier regions (le Polain de Waroux et al 2018) suggested four clear groups of frontier types. Group I (blue color, figure 6) was characterized as suspended frontiers, with low naturalness and where frontier land use was either transition or cropland (i.e. Anta I, Córdoba, San Luís, Bandera, and Chaco-Santiago I). Group II (yellow) was similar to group I, except that the frontier land use was pasture (i.e. Tartagal, Chaco-Pantanal, and Central Chaco). Group III (green) were active frontiers with either high or medium frontier naturalness (i.e. Andean Foothills, Anta II, Chaco-Santiago I, Corrientes, Formosa). Lastly, group IV (red) encompassed all frontier regions, where naturalness was already low, but which were identified as active, independently from the frontier land use (i.e. Santa Cruz, Tucumán, Semiarid Chaco, figure 6).
4. Discussion
Better understanding how agriculture expands into tropical and subtropical forests is important for addressing the major sustainability challenges associated with frontier expansion. This is particularly urgent for the world's tropical dry forests, many of which are hotspots of deforestation, carbon emissions, and biodiversity loss. Here, we developed a novel set of frontier metrics, and demonstrated how these can be used to identify typical frontier dynamics. We demonstrate this approach for the entire South American Chaco, highlighting three key insights. First, reconstructing frontier dynamics since 1985 revealed rampant agricultural expansion, with 193 321 km2 of Chaco woodlands being converted. Importantly, for the first time we document a recent surge in woodland loss (after 2019). Second, translating our land-cover time series into frontier metrics uncovered distinct frontier processes. For example, whereas ranching expansion drove woodland loss in Paraguay and Bolivia, cropland expansion remained the primary driver of woodland loss since the mid-2000s in Argentina. Similarly, we uncover typical land-cover trajectories following woodland loss, such as initial conversion for pasture and a later shift to cropping, or a considerable fallow period before agriculture is established. Fourth, the multidimensionality of our metrics allowed us to identify groups of frontiers with similar characteristics and development stages that are likely characterized by similar underlying processes and sustainability outcomes. Our metrics hence provide a deeper understanding of frontier processes while allowing to better target land governance policies to sustainable manage frontier regions.
Land-cover change in the Chaco had previously been mapped (Hansen et al 2013, Vallejos et al 2015, Guyra 2018, Song et al 2021, Zalles et al 2021), but never with the spatial, temporal and thematic detail that we provide here. Specifically, our mapping goes beyond prior efforts in at least four ways. First, our analysis reconstructs land-cover change back to 1985 at annual resolution, covering the entire history of modern agricultural expansion in this deforestation hotspot. Importantly, we developed an approach that ensures consistent, logical trajectories, avoiding pseudo-change. Second, our analysis, for the first time, separates agricultural expansion from forest disturbances, which constituted a substantial share of the woodland loss in the Chaco (34%, figure 3). Third, because our assessment was validated, we were able to derive the first robust area estimates of frontier dynamics in the Chaco. Fourth, our approach is novel in disentangling post-deforestation land-use changes, including multiple, subsequent land-cover transitions. This revealed, for example, that deforested areas in Argentina are often eventually used for cropping, although initial deforestation occurs for ranching. It is important to highlight that our land-cover reconstruction is solely based on satellite imagery, allowing for subsequent analyses (e.g. statistical analyzing of drivers of change). Likewise, our approach is easily transferable, can be scaled up to even larger regions, and can be updated as satellite image archives grow. This, we humbly suggest, constitutes a step-change in our ability to monitor land-cover change and forms the basis for a deeper process-understanding of frontiers.
The patterns and trends of agricultural expansion we derived here are highly plausible. For example, our results suggest that frontiers expanded particularly rapidly in the 2000s in Argentina but slowed down after 2010. The agricultural expansion boom in the 2000s was the result of several factors, most importantly the currency devaluation in 2001, which strongly increased profits from soy exports (Gasparri and Baldi 2013) and the introduction of genetically modified soybean in the Chaco (Reenberg and Fenger 2011, le Polain de Waroux 2019). Indeed, most of the cropland frontiers emerged during that time (figure 4). Later, increasing taxation, economic instability, an outflow of capital (le Polain de Waroux et al 2019), increasing land-use restrictions through Argentina's zoning law (Marinaro et al 2020), and the increasingly more marginal conditions for sites on which remaining forests are found (Houspanossian et al 2016) lowered cropland expansion rates after 2010. In contrast, capital that accumulated in the soybean boom (in the Chaco or elsewhere, such as Brazil), combined with evolving know-how and infrastructure to optimize cattle ranching in the Chaco (le Polain de Waroux 2019) explains surging woodland conversion we found in the Paraguayan Chaco after 2010. As a final example, the recent, more than two-fold surge in deforestation after 2019 (figure 3(A)) that we here document for the first time converges well with reports of increasing forest conversion, during the lockdown situation—in the Chaco and other deforestation frontiers globally (Fair 2020, Price 2020).
A major surprise in our findings was that most converted woodlands did not transition to agriculture right away, and many never. Four complementary explanations for this finding are plausible. First, natural disturbances, such as from fires or river-bed migrations are common in the Chaco (Adamoli et al 1990, Bravo et al 2001, de Marzo et al 2021). However, disturbance attribution is not always straightforward. For example, fires occur naturally, are used as a management tool to control woody encroachment, or are associated with the deforestation process (Boletta et al 2006). Second, woodland conversion may not be driven by the goal to immediately produce agricultural commodities, but might happen to secure land, to prepare land for resale, or simply in fear of tightening regulations (Seghezzo et al 2011). Third, given that removing woodland and preparing land for agriculture requires capital (e.g. sowing with productive pasture grasses), there may be a time lag between deforestation and agricultural use, which we found for 34% of all woodlands converted to agriculture (figure 3(B)). Finally, silvopastoral systems, where parts of the tree canopy remain, are becoming more common in Argentina (Baldassini et al 2018, Fernández et al 2020), and these areas would fall outside of our pasture class. All of these factors point towards the importance of adopting approaches that deliver information at high spatial, temporal, and, importantly, thematic resolutions to quantify agricultural expansion in the tropics and to understand the causes and mechanisms of deforestation. This, in turn, is critical for properly attributing environmental trade-offs properly to commodities, which is a key research frontier for achieving supply chain sustainability (Gardner et al 2019, Pendrill et al 2019, Zu Ermgassen et al 2020).
Translating our land-cover time series into a consistent set of frontier metrics, allowed us to move beyond land cover to characterizing land-use change processes. In our case, this enabled us to identify distinct frontier types, characterized by similar land-use and woodland loss dynamics in space and time. Such archetypical, high-level patterns and outcomes of human–environment interactions can help to structure complexity in land-use change (Vaclavik et al 2013, Levers et al 2018, Pacheco-Romero et al 2021), foster a more mechanistic understanding of land-use change (Magliocca et al 2018), and contribute to developing theories of the middle range (Meyfroidt et al 2018). Importantly though, identifying archetypes, such as recurring frontier types, allows for the more context-specific, regionally-targeted land governance increasingly asked for (Kuemmerle et al 2016, Thomson et al 2019, Christie et al 2020, Pacheco et al 2021). For example, cropland or transition frontiers with low remaining naturalness (i.e. group I (blue), figure 7) are regions where restoration efforts in degraded lands are most suitable. Likewise, pasture frontiers that are suspended (i.e. group II (yellow)) may increasingly experience pasture to cropland conversions in the future, and hence actor-focused interventions, such as building incentives towards more sustainable production systems (e.g. silvopastures), may be most effective. Contrary, active and fast frontiers with high or medium naturalness (e.g. group III (green)) should become hotspots of policies with the goal to avoid tipping points in woody cover, for example through the identification of biodiversity-rich areas and their subsequent protection through new protected areas or zonation (e.g. Ley de Proteccion Ambiental de Bosques 2007) to restrict further agricultural expansion.

Figure 7. Characterization of different frontier regions based on the metrics. The background layer indicates woodland loss. For information on how the metric categories were assigned please refer to text SI-3 in the supplementary information. The different colors around each frontier represent groups of frontiers. Group I (blue) is characterized by suspended frontiers, with low naturalness and where frontier land use was either transition or cropland. Group II (yellow) is similar to group I, except that the frontier land use is pasture. Group III (green) are active frontiers with either medium or high frontier naturalness. Group IV (red group) are characterized by low frontier naturalness that are still active.
Download figure:
Standard image High-resolution image
Our analyses provide the most detailed reconstruction of woodland and agricultural dynamics for the Chaco, including novel insights into how agricultural frontiers have expanded. A few limitations still need to be mentioned. First, we only mapped agricultural expansion and intensification, but not agricultural abandonment. Abandonment is not (yet) a widespread process in the Chaco and vegetation recovery on abandoned fields takes time (Basualdo et al 2019). Still, adding de-intensification and abandonment processes would be a useful expansion of our approach in future work. Second, we describe frontier expansion related to intensified, large-scale agriculture but did not explicitly address forest smallholders practicing subsistence agriculture inside forests. While these actors are important in the Chaco, dynamics in forest smallholders mainly are due to agribusiness expansion (Levers et al 2021), and so are indirectly captured here. Third, our classification contains remaining uncertainty. For example, some class confusions occur between natural vegetation after woodland loss and pastures, which might represent silvopastures. Likewise, some accuracies for the cropland and pasture classes were relatively low (∼70%, figure SI-3) for some years, likely due to missing observations. Yet, changes not captured in that year (e.g. cropland expansion) were likely captured in subsequent years, so that the overall trajectory of land-cover changes should remain unaffected.
Agricultural expansion into tropical and subtropical forests contributes heavily to many global sustainability challenges. Steering these frontiers towards more sustainable outcomes requires a better understanding of the dynamics of frontier processes. Here, we developed and demonstrated a novel approach to generate such understanding on the basis of frontier metrics derived from freely available, high-resolution satellite imagery. For the Chaco, our frontier metrics characterize and structure the complexity of frontier dynamics, for example revealing slow vs. rampant frontiers, where frontiers are emerging, or when frontiers were particularly active. This allows for exploring the underlying drivers of these frontier processes, including testing hypotheses about causal mechanisms. For example, the emergence of cropland frontiers could be associated with the introduction of genetically modified soybeans, and through our metrics one could explore the causal links between the two. Further, our study revealed that about 34% of the deforestation in the Chaco that might be wrongfully attributed to commodity agriculture, and another 17% that might be attributed to the wrong commodity depending on which baseline is chosen, providing important insights for attributing environmental trade-offs properly to commodities. Our transferable, repeatable, scalable, and extendable approach allows for comparative research across regions to find rules governing frontiers in many situations, as well as to identify generalizable patterns and processes that shape frontiers in different regions. In the Chaco and elsewhere this can enable cross-regional learning and the more regionally targeted, context-specific policy-interventions that are often asked for. More broadly, our study highlights the opportunities of the big data era of remote sensing for creating a step change in our understanding of land-use change and for uncovering patterns of human–environment interactions at the ecoregional and national scale.
Acknowledgments
We gratefully acknowledge support by the German Research Foundation (DFG, Project KUJ 2458/5-1), the German Federal Ministry of Education and Science (BMBF, Project PASANOA, 031B0034A), and the Belgian Science Policy Office Research Program for Earth Observation (belspo-STEREO-III, Project REFORCHA, SR/00/338). This work was supported by the European Research Council (ERC) under the European Union's Horizon 2020 research and innovation program (Grant Agreement No. 101001239 SYSTEMSHIFT). This research contributes to the Global Land Program (glp.earth). We are grateful for the very helpful, constructive and encouraging comments made by two reviewers and the handling editor.
Data availability statement
The data that support the findings of this study are available upon reasonable request from the authors.
baumann-etal_2022_Supplementary-Information (1.9 MB PDF) The supplementary information contains a detailed methodological description as well as additional graphs and figures that did not make it into the manuscript.