


Abstract
Farmers' perception of climate change is crucial in adaptation intention and process. However, farmers' perceptions may not be timely, accurate and systematically consistent with the direction and significance of observational records. Although some research compared farmers' perceptions and climate data, little attention has been paid to comprehensibly analyse both data sources discrepancies based on empirical studies results. By combining bibliometrics and a systematic review approach, we identify which approaches are used to compare perceived and observed data, how both patterns have been mutually evolved, which factors determine their (in)consistency, and if their accordance and robustness affect farmers' adaptive capacity. We analyse a portfolio of 147 papers collected from the Scopus library catalogue since 2000. The bibliometric analysis was coupled with an exploratory analysis of 98 papers selected from the original portfolio. The literature is extensive, fast-growing, and spans several disciplines. We identify four consolidated research lines: (a) perceived risk and farmers' adaptive capacity nexus, (b) crop vulnerability due to temperature increase and erratic rainfall patterns, (c) forecasting use and influence in farmers' decisions, and (d) climate change awareness conditioning farmers' profiles. Nonetheless, we observe some research gaps: (a) a conceptual mismatch in 'normal pattern' or 'drought' meaning, (b) poor or limited data from meteorological stations, (c) overlook or oversimplification of local knowledge in describing perception, (d) farmers' memory weaknesses to keep track of climate alterations, and (e) a geographical dissonance in favour of Global South regions. Our science-metric study also reveals some research questions to be consolidated: Can the perception of extreme events increase climate change awareness? Can greater awareness reduce discrepancy with observed data? How do heuristics and socio-psychological filters influence farmers' awareness and interpretation of climate data? We suggest putting major efforts into reinforcing these research lines as part of a novel domain-dependent trend to reduce the discrepancy.
Export citation and abstract BibTeX RIS

Original content from this work may be used under the terms of the Creative Commons Attribution 4.0 license. Any further distribution of this work must maintain attribution to the author(s) and the title of the work, journal citation and DOI.
1. Introduction
Climate change is arguably the most severe and complex challenge facing today's society (Feulner 2017), a cross-cutting issue affecting many sectors and connected to other global challenges, such as the twin challenge of promoting sustainable water use and ensuring food security (Jagermeyr 2020). Agricultural systems, the most vulnerable economic sector to climate and natural conditions, are adversely influenced by climate change through increased water stress, change in run-off patterns, seasonality fluctuation, and temperature variations (Konapala et al 2020, Tabari 2020). To deal with these threats, farmers continuously make changes in their practices, including crop diversification and introduction of resistant varieties, adjusting planting dates, increasing organic fertilizers (Aggarwal et al 2019), ensuring soil and water conservation techniques (Bagheri and Teymouri 2022), reducing cultivated area, promoting contour farming (Diallo et al 2020, Khanal et al 2021, Li et al 2021), subscribing risk transfer mechanisms, such as insurance coverage (Surminski and Oramas-Dorta 2014) or incorporating climate services to assist decision-making (Tall et al 2018).
Farmers' ability to respond to extreme events and climate variability builds on their vulnerability (Khan et al 2021), which depends not only on their exposure to climate change but also on their adaptive capacity and resilience (Afkhami et al 2022). Previous research has examined climate change's perceived impacts and identified factors influencing farmers' adaptive response, including socio-economic, technological, institutional, cultural, and psychological predictors (Le Dang et al 2019). As farmers are part of the community, most of their opinions and attitudes regarding climate change awareness and weather perception can match the publics' experiences and judgements. For example, by identifying short-term weather patterns such as high temperatures, rainfall variability, and an increase in exposure to extreme weather events (Ray et al 2017, Howe et al 2019a, Reddy et al 2022), the psychological distance between climate change and construal level theory to understand how individuals see climate change and which is their predisposition to accept risks (Brugger 2020), how perceived extreme events might shape public engagement (Ettinger et al 2021) or those factors determining weather patterns as either normal or abnormal according to past experiences and future expectations (Moore et al 2018).
Some studies also identified the mismatch between perceived impacts and risk management strategies (Duong et al 2019) in specific contexts and regions, like Africa (Gbegbelegbe et al 2018, Muchuru and Nhamo 2019) and Asia (Shaffril et al 2018). High adaptive capacity imparts resilience to farmers, being more likely to maintain the desired state or communicate about a favourable transformation when the current state is untenable or undesirable (Lockwood et al 2015). Existing literature argue that farmers' responses to climate change impacts require technologically appropriate interventions with instrumental measures (informative, innovative or economic) (Wright et al 2014, Cruz et al 2021) but, most importantly, a better understanding of their perceptions and attitudes, including decision behaviour, as climate change becomes a matter that human beings need to comprehend and react to (Arbuckle et al 2013, Azadi et al 2019, Tiet et al 2022). For example, recent studies reveal how climate change awareness influences adaptive capacity by considering farmers' general agreement on some observed changes in weather patterns, such as the increase in temperature and changes in rainfall patterns (Ado et al 2019, Talanow et al 2021, Voss 2022, Yarong and Minpeng 2021). Other studies tested how farmers who consider that climate change is occurring and is human-induced were more likely to perceive temperature increases, severe drought, heatwaves, and changes in rainfall (Niles and Mueller 2016).
Social and behavioural sciences have discussed and debated associative processing methods and the nature, extent, significance, and influence of personal extreme weather experience over the past decade to understand how it affects adaptive capacity (Marlon et al 2018, Ogunbode et al 2019, Brugger et al 2021, and reference therein). Local perceptions provide important baseline information for understanding individual exposure to climate risks, which are essential for effective policy formulation and implementation (Guodaar et al 2021). Perception is derived from and reinforced by farmers' daily sensory observations of experienced physical conditions and their local memory. However, considering local climate change, the weather's natural day-to-day variability can make it difficult for farmers to detect long-term trends (Habtemariam et al 2016), leading to divergent perceptions of climate change. Furthermore, observations are spaced over time, and individual and collective memory of past events can be faulty or uncertain (Song et al 2021), distinguishing between knowing facts (semantic) versus reliving events or experiences (episodic) (Plate 2017). Considered within this broader context, the conventional approach to climate change tends to be semantic (e.g. what is a 1 in a 1000 year event?). In contrast, narrative and storyline approaches tend to be episodic (e.g. have we seen this before? And if so, what might the next event be like?) (Shepherd et al 2012). Consequently, perceived changes may not always reflect reality, and climate events or trends may be misinterpreted or wrongly remembered for various reasons. In this line, Krishna-Bahadur et al (2020) argue that a reliance on subjective perception data alone could limit the reliability of information obtained due to local subjectivities and heuristic biases, hence, the need to integrate such data with objective scientific evidence.
Timely and accurate perception is an important determinant of farmers' intentions and adaptation actions. According to Abid et al (2019), accurate perceptions mean that farmers' perceptions are consistent with the observed historical trends, while underestimated perceptions are those discordant with the climate data records. However, farmers' perceptions may not be systematically consistent with the direction and significance of observational data (Sutcliffe et al 2016). Reasons explaining these discrepancies can be related to limitations of specific data sources and methods: an irrelevant choice of the study period, a set of imprecise survey questions about climate change perception, the use of a single inappropriate meteorological dataset and/or irrelevant definitions of meteorological indicators can contribute to introduce biases (de Longueville et al 2020). Marchildon et al (2016) hypothesized that differences between perception and the climate records could be traced down to three main reasons related to farmers' behaviour. Firstly, human beings focus on the ultimate impact of extreme weather events (e.g. droughts, floods, excessive moisture) rather than on the event itself, and this motivates a gap in time between any extreme or prolonged weather event and the impacts this may have on the farmers' activity (e.g. crop production). Secondly, individuals work and live in small-scale environments subject to highly localized climate factors, while climate data records are often calculated on a more extensive spatial basis, unable to reflect local conditions accurately (Boissiere et al 2013). Finally, the temporal period for which observed data are averaged can differ from the references in individuals' memories (Hamilton and Stampone 2013). According to Eitzinger et al (2018), mismatch between observations and memories is partly due to two key facts. First, most farmers do not differentiate between weather and climate and cannot distinguish climate variability from climate change. Second, they still perceive climate change's likelihood of affecting them and their activities directly as low. Likewise, some authors argued that when deciding on adaptation, farmers tend to relate possible actions to probable consequences linearly without considering delayed and unexpected feedback loops, nonlinearities, and abrupt changes (Alley et al 2003, Weber 2006).
While poor perceptions may lead to maladaptation and increase farmers' vulnerability to climate change, disregarding farmers' knowledge could limit the adaptation responses to climate change impacts (Habte et al 2021). An increasing body of research provides additional analysis from empirical results contrasting farmers' perceptions and meteorological records, such as rainfall and temperature records (Cobbinah and Anane 2016, Yamba et al 2019). Most of them suggest that comparing scientific evidence with farmers' perceptions and incorporating their knowledge into climate change adaptation strategy design is fundamental to farmers' adaptive capacity (Mkonda et al 2018). However, little research has been paid to collecting and contrasting data from empirical studies to comprehensibly check which lessons can be learned from the analysis of (in)consistency between farmers' perceptions and climate data records. To the best of our knowledge, just one review from Foguesatto et al (2020) takes a similar approach but limited to 18 studies located in Africa and Asia, duly reviewed according to their convergence/divergence between meteorological records and farmers' perception and focused on expected utility maximization (e.g. farmers' well-being) and availability heuristic (e.g. farmers' memories).
Our study aims to fill this literature gap by considering a much larger set of studies and pursuing a more comprehensive set of objectives, namely analysing which driving factors are used to compare perceived and observed data, investigating how both patterns have been mutually evolved, assessing which factors determine their (in)consistency, and if their accordance and robustness affect farmers' adaptive capacity. A threefold research question is addressed: (a) What is the current publication trend at the global scale comparing farmers' perceptions and climate data in terms of emerging research learnings and gaps? (b) What is the intellectual structure of farmers' perceptions compared to key messages from climate data? And (c) how do farmers' (in)accuracy in identifying climate change impacts influence climate change awareness, perceived impacts, and adaptive capacity? Our hypothesis is that information answering these questions is scattered. For instance, it is not apparent which knowledge gaps on farmers' perceptions and narratives exist (e.g. whether empirical studies cover the full spectrum of farmers' behaviour at socio-economic, environmental, cultural or psychological level). Likewise, which climate data have been used to cover natural risks and extreme events, and most importantly, which range of extreme events have been considered from farmers' perception construct. Furthermore, how climate change impacts are hidden in the underlying meteorological data (e.g. if using monthly or annual data limits the detection of potential changes in daily patterns, or if normal and optimal values are considered in terms of amount, timing, duration, intensity, and region-specific distribution). Moreover, it is unclear whether the geographical cover of empirical studies is exhaustive and whether the results can be translated into other geographical contexts. Reflecting on these gaps, the question to be asked is not which of the two sources (farmers' experience or instrumental records) is more accurate but how both could be exploited and combined to improve farmers' resilience and adaptive capacity when addressing both agricultural constraints and climate risks at the local level (Lee et al 2014).
2. Methods and design section
We conducted systematic mapping based on bibliometric analysis and literature review to screen for papers studying cases where climate change farmers' perceptions and climate observed data are contrasted. Bibliometrics is an analytical and mapping method to quantitatively assess the linkages and impact of scientific publications for tracking progress and tracing knowledge of a research field (Chakraborty et al 2021). Systematic literature review (SLR), based on exploratory content analysis, provides a concept-driven approach that allows us to take stock of the field, the strength of evidence for frameworks, and what avenues are open for future research (Clark et al 2021). Their combination ensures the structural and methodical nature of a systematic review (Badi and Murtagh 2019) and accomplishes the four-step method suggested by Koberg and Longoni (2019), in which material selection, descriptive analysis, category identification, and material evaluation must be achieved. What is common to both tools is their ability to simplify the dynamic and complex linkages between different papers and their associated information and to entail visualization of their knowledge structure using data reduction techniques (Moral-Munoz et al 2019).
2.1. Research question(s)
The main challenge facing literature comes from combining a 'subjective' or 'imperfect' issue (farmers' perception and behaviour) with an 'objective' or 'perfect' issue (meteorological and climate data) (Hornsey et al 2016). What is of interest here is if both issues can be measured and contrasted and how the literature has been able or not to address this challenge. Most of the literature starts asking if data based on farmer experiences of temperature and rainfall variability differ from meteorological station data, and if so, why. Our goal is to deepen farmers' notions and narratives of 'normal' and 'abnormal' weather or climate by contrasting examples where discrepancy between perceived climate change and meteorological data could explain different farmers' behaviour regarding the intention to adapt and (mal)adaptation. We focus on three main research questions. The first will be addressed from bibliometrics, while the other two will be responded to from a literature review:
- RQ1: What key topics and dynamic trends can be identified globally by comparing farmers' perceptions and climate data in terms of consolidated and emerging research learnings and potential gaps? Which research framework considers the authors profile, main sources, affiliated countries and institutions, methods, keywords, and leading themes?
- RQ2: What is the intellectual structure of farmers' perception in contrast to key messages from meteorological data? Do climate data records support farmers' perceptions? Which strengths and weaknesses of perceived and observed data can be identified? How can both pieces of information be measured and contrasted?
- RQ3: How farmers' (in)accuracy in perceiving climate change can influence their adaptive capacity? Is there a typical pattern according to farmers' profiles? What are the rationales behind these patterns?
2.2. Protocol
To ensure high reproducibility in the reviewing process, the methodology for this work was guided by the checklist of Preferred Reporting Items for Systematic Reviews and Meta-Analyses (PRISMA), which suggests the sequential workflow for reporting an SLR (Page et al 2021). The protocol was applied to provide comprehensive assimilation and synthesis of the current evidence base for field-based studies of farmers' perception versus climate data. It explains how the literature corpus has been selected, the criteria used to extract the data, the conducted analysis, and the interpretation of the results (Viguié et al 2021). This protocol sets out to reduce the possibility of bias while providing better transparency and replicability (Croijmans et al 2021). Each step is elucidated below, and a summary of the protocol is presented in figure 1. First, we chose search terms related to the research questions based on inclusion and exclusion criteria determined by the query string. We conducted an article search and vetted titles and abstracts on inclusion criteria. Finally, we judged papers from titles and abstracts review as eligible for the bibliometrics analysis. However, further examination of the papers' full text is needed for the exploratory content analysis, and potential papers must report case studies correlating farmers' perceptions and climate data.

Figure 1. PRISMA flowchart of the SLR and BA protocol for data retrieval and analysis process.
Download figure:
Standard image High-resolution image2.3. Query strings
We retrieved data from the Scopus library catalogue as a large and multidisciplinary search system (Gusenbauer and Haddaway 2020, Das and Goswami 2021) with a broader bibliometric scope and most current data than Web of Science (Chadegani et al 2013). The search query contains four conceptual pillars (including related terms) to analyse if farmers' perception of climate change corroborates with empirical evidences of climatology: (a) farmer, (b) meteorological/climate/climatic, (c) perception, and (d) adaptation. We chose to search for the inclusion of the terms in both title, abstract, and keywords. The review process followed a screening and inclusion criteria in which results are filtered by period (from 2000 to 2021, as 11 of the 12 warmest years over the last four decades have occurred since 2000 according to the Copernicus European State of the Climate reports), language (English), type of publication (limited to articles and reviews, while excluding grey literature and other sources of local and practitioner knowledge), and core collection (no subject area restriction). The conceptual pillars served as the basis for a general Boolean search query: TITLE-ABS-KEY (farmer) AND (meteorological data OR climatic data) AND (perception OR perceived) AND (adapt*) AND (LIMIT-TO (DOCTYPE, 'ar') OR LIMIT-TO (DOCTYPE, 're')) AND (PUBYEAR AFT 1999) AND EXCLUDE (PUBYEAR,2022)) AND (LIMIT-TO (LANGUAGE, 'English')).
2.4. Study selection
The search was conducted in September 2021 and executed by the first author from Italy through the library service of Politecnico di Milano. The search retrieved a total of 695 results. Not all papers were relevant, and the first filter process excluded any studies that did not include three of the four conceptual pillars in their title. After this initial screening, we undertook an additional screening process to abstracts to ensure papers contained specific and sufficient background on farmers' perceptions and meteorological data comparison and support. In this step, we excluded those papers with no reference to meteorological or climate data, those limited to technical data, or those focused on theoretical and model-based analysis. Thus, data extraction included two initial screening questions: (a) Is the abstract providing relevant information and discussion about climate change impacts and observed data? (b) Are there explicit experiences and case studies focused on how perceived and observed data consensus affect intention to adapt or the type of adaptation measures applied?
Candidate papers that partially or totally met these criteria were assessed for bibliometrics and included in the full text screening step. Conversely, papers in which screening questions are limited to paper's problem definition or hypothesis formulation or papers that synthesized farmers' perceptions of climate change impacts without explicitly emphasizing tangible responses and comparing meteorological data were excluded from the full text analysis selection process. At this point, geographical representativity (to provide an overview of similarities and particularities among regions) and empirical studies, including survey samples (to check farmers' perception narratives consistency with climate data), were considered. Contrary to what was understood from the title and abstract screening, upon reading the full text, it became clear that the content of some studies did not fit the criteria of our review. Consequently, these studies were disregarded in the further work.
2.5. Data management and analysis
We imported all bibliographic data and publication meta-data directly from the Scopus database. The selected literature was analysed using quantitative (univariate statistics) and qualitative (content analysis) methods. The results are presented and discussed in two ways. Bibliometrics of search outcomes builds the first part to inform about the extent and evolution of available knowledge, specific characteristics of the research field, and the interactions between research gaps and outcomes. In the second part, an exploratory content analysis from selected studies is presented and discussed to give a qualitative impression of the most relevant topics and the dimension of scientific dissensus.
For the bibliometrics, data has been analysed by combining two main procedures: performance analysis and science mapping. According to Rosato et al (2021), performance analysis provides data about the volume and impact of research using a wide range of indicators and techniques (e.g. word frequency, citation, and counting publications by a unit of analysis). Science mapping, meanwhile, provides first and second-generation relational indicators to create a spatial representation of how different elements relate to one another. We used the R-tool bibliometrix with the VOSviewer software (version 1.6.17) (Aria and Cuccurullo 2017) to complete the scientometric assessment. VOSviewer is a tool developed in Java and used to create, visualize, and explore maps based on network data and taking a distance-based approach to visualizing a network of clusters in which nodes represent different elements duly organized according to their orders of magnitude (from higher to lower values) (van Eck and Waltman 2020). Following recent studies, such as Secinaro et al (2020) or Wu et al (2021), the contents of bibliometric analysis are divided into the following three sections: (a) basic dataset analysis: including an analysis of papers production, most relevant authors and organizations, core sources, and countries; (b) research hotspot analysis: local and global citations, keywords co-occurrence analysis and word dynamics, thematic structure, and (c) research frontier analysis: co-authorship, co-occurrence, and co-citation clustering.
We carefully read and categorized the selected literature corpus for the exploratory content analysis to identify core themes and top-level concepts previously identified through bibliometrics and discussed according to case study contributions (Pizzi et al 2020). Each paper was coded, tagged, and later grouped into clusters, with papers allowed to be part of more than one cluster. Concerning the coding and tagging procedure, relevant parts of the text were selected and labelled with keywords representing their content, contributing to the taxonomy, and reducing biases from a rigidly pre-set system (Caputo et al 2016). The taxonomy consisted of five categories able to address RQ2 and RQ3: (a) measurable tools and data, (b) farmers' perceived impacts and covered extreme events, (c) climate data records regarding temperature and precipitation patterns, (d) accuracy between perceived and observed data, and (e) farmers' adaptation measures.
3. Results—bibliometrics
The following three sections present the bibliometrics analysis in detail. First, we synthesize the main dataset information (section 3.1). Then, we analyse the trends of publications considering authorship and sources (section 3.2) to highlight the most relevant authors, collaboration network, and core journals through co-occurrence and network analysis. Finally, in section 3.3, we identify and harmonize keywords' structure and topic clusters through burst detection while revealing the main themes from the conceptual structure of farmers' perception and observed data comparison.
3.1. Main dataset information
The collection comprises 147 papers retrieved from the Scopus database. Of them, 92% of papers were published after 2013, and 2021 was the most productive year, also considering that our analysis was incomplete since we stopped the selection on 30 June. Figure 2 shows how the number of papers dealing with our subject is sharply increasing over time, with 78 papers published in the last three years, compared to 69 in the nineteen years between 2000 and 2018, with fewer than three papers in each year in the first decade of the analysis. Sharp increases can be observed in 2017 and 2019, just after the years of the Conferences of the Parties, in which the Paris Agreement was signed, and a rulebook was fixed.
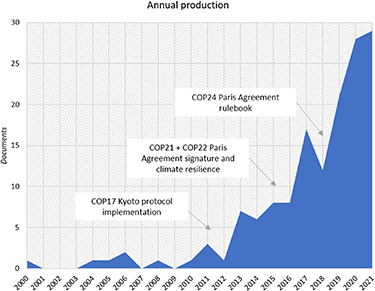
Figure 2. Authors' output by annual production.
Download figure:
Standard image High-resolution imagePapers are co-authored by more than 500 authors and published in about 70 journals. The sample includes few single-authored papers but a high co-author ratio (an average of three to four co-authors per paper) (table 1). Furthermore, it can be noted how keywords frequently used in a paper's references list (named keywords+) almost double the authors' keywords included in the papers. The overview also reveals the dominance of co-authored papers cited after three years of publication.
Table 1. Main dataset characteristics.
| Main information | Description | Value |
|---|---|---|
| Papers | Total number of papers | 147 |
| Sources | Frequency distribution of sources (journals, books, etc) | 73 |
| Timespan | Years of publication | 2000–2021 |
| Authors' keywords | Total number of keywords | 372 |
| Keywords Plus | Total number of keywords contained in the title of a paper's references list | 705 |
| Authors | Total number of authors | 547 |
| Authors' appearances | Authors' frequency distribution | 589 |
| Authors' countries | Total number of countries beyond that of the corresponding author | 54 |
| Authors' affiliations | Total number of institutions according to the authors' membership | 289 |
| Authors of multi-authored papers | Number of authors in multi-authored papers | 540 |
| Papers per author | Average number of co-authored papers | 0.27 |
| Co-authors per paper | Average number of authors who sign a paper | 3.72 |
| Collaboration index | Co-authors per paper only considering the multi-authored papers set | 3.86 |
| Average years from publication | Average number of years for a paper to be cited | 3.45 |
| Average citations per paper | Average number of citations received by a paper | 18.12 |
3.2. Authorship and sources
The collection was published by 547 authors from 54 countries, the most relevant being the United States (47), Ethiopia (39), and China (34) (figure 3). However, this top 3 ranking partially changes when limiting the analysis to the corresponding author's country: China runs first (leading 14 papers), followed by Australia and the United States (13 papers each). United Kingdom, Germany, and South Africa complete the list of authors' countries appearing in more than 20 papers. Likewise, the highest co-authors' collaboration is exemplified in three main clusters, where the one co-led by the United States (Joshi et al 2019) and Australia (Jamal et al 2021) is the most relevant in terms of geographical interdependence, and, together with the cluster led by China and Germany (Abid et al 2019, Sorgho et al 2020), make most than one-third of the collection since 2018. China has the maximum number of single country papers. In contrast, Australia's multiple country publication ratio is higher—exemplified through significant collaborations with Bangladesh or Indian institutions to address case studies in Global South regions (Hasan and Kumar 2020, Nidumolu et al 2021).
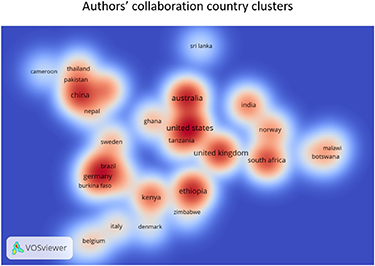
Figure 3. Collaboration clusters according to co-authors' country.
Download figure:
Standard image High-resolution imagePapers reported comparison among farmers' perceptions and climate data across all global regions, with the greatest number of papers providing case study analysis in Africa (52% of papers) and Asia (37%) (figure 4). Few publications were focused on North and South America (6%), even less on Oceania or Europe (<1%). Africa and Asia's reports are dominated by literature from southern and eastern Africa (Ethiopia, Kenya, and Tanzania) and South Asia (Bangladesh, Nepal), with limited case studies from the northern, central, and western regions. Consequently, farmers' perceptions and climate data comparison are concentrated in case studies from Global South regions.
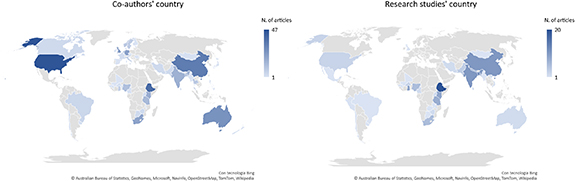
Figure 4. Scientific production from co-authors' country and countries where research has been carried out.
Download figure:
Standard image High-resolution imageAccording to Lotka's Law on author productivity, most authors (512, 94%) have written just one paper, while the rest have written from two to four papers. Author influence was considered in absolute terms instead of in a fractionalized form. This means that an author is given full credit for publishing a paper irrespective of the number of co-authors who sign the paper. The most productive authors are Ayal (Center for Food Security Studies, Addis Ababa University, Ethiopia) and Kumar (School of Environmental and Rural Science, University of New England, Australia) with four papers each, followed by Cuni-Sanchez (Department of Environment and Geography, University of York, United Kingdom), Hasan (Department of Agricultural Extension and Rural Development, Patuakhali Science and Technology University, Bangladesh), and Radeny (International Livestock Research Institute, Kenya) with three papers. The majority of the top 10 most relevant authors concentrated their activity between 2017 and 2021, coinciding with when 73% of the papers were published. Two institutions, the Addis Ababa University (15 papers) and the University of Nebraska at Lincoln (12 papers), lead the 289 institutions' ranking on the number of published papers, although the vast majority of authors' institutions (78%) published just one paper. It is newsworthy that authors from a dozen institutions—mainly European (e.g. Amsterdam, Goteborg, Reading, Ghent)—published four or more papers focused on Africa and Asia case studies.
Details on the co-author' disciplines background were extracted from the affiliation data source to check the level of transdisciplinary research when addressing the topic (figure 5). After merging original disciplines from departments and institutions' names and considering similarities among research backgrounds, eight main categories have been defined. It has been observed that authors carried out 75 papers (51%) from three major fields: Environmental Sciences, Agricultural Economy and Policy, and Climate Change and Earth Science. The first one includes sub-topics such as sustainable and socio-economic development studies analysed by authors from Ethiopia (Mihiretu et al 2020), China (Mu et al 2020), South Africa (Rapholo and Makia 2020), and Bangladesh (Rabbi et al 2021). The second one considers sub-topics such as agricultural extension, livestock, rural sociology, or sustainable agricultural systems, and it was studied by contributors from the United States (Olutumise et al 2021), India (Ghosh-Jerath et al 2021) and Kenya (Mubiru et al 2018). The last one comprises meteorological services and agri-informatics, and the topic was dominated by authors from Bangladesh (Kumar et al 2020), China (Yu et al 2014), South Africa (Akanbi et al 2021), Nigeria (Gbangou et al 2018), Germany (Akter and Ahmed 2021), and Norway (Vedeld et al 2020). It is to be noted that some research areas have been included in two different categories. For example, although 'geography' was considered a full and isolated category, 'physical geography' tends to be included or combined with 'environmental sciences' or 'climate change and earth science' categories. Likewise, 'computer science' and 'engineering' are related to 'crop science and agroecology' but also to 'environmental science' categories.
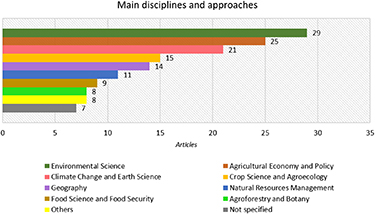
Figure 5. Co-authors' main disciplines and scientific approaches.
Download figure:
Standard image High-resolution imageRegarding the citation analysis, we can distinguish between local and global citations. A local citation analysis represents how many times other papers within the network have cited a paper, while a global citation shows the overall Scopus citation of the paper. Table 2 illustrates the top 10 papers collecting local and global citations. Considering global citations, the whole collection was cited 2664 times, 126 papers (86%) were cited at least once, while 16 papers (13 of them published after 2013) received at least 50 citations. The top 3 most cited papers are those led by Meze-Hausken, working in an Ethiopian case study (Meze-Hausken 2004, 189 citations, 10.5 citations/year), West, focused on Burkina Faso (West et al 2008, 123 citations, 8.8 citations/year), and Alam, studying the Bangladesh context (Alam et al 2017, 119 citations, 23.8 citations/year). Likewise, the collection accumulated 259 local citations distributed in 61 papers (42%), half published after 2016. The paper by Meze-Hausken (2004) runs first after receiving most local citations (matching with its first place in global citations), followed by Simelton et al (2013) and Ayanlade (2017), both focused on African case studies.
Table 2. Top 10 documents receiving local (LC) and global (GC) citations.
| First author | Year | LCs | GCs | LCs/GCs ratio |
|---|---|---|---|---|
| Meze-Hausken E | 2004 | 24 | 189 | 12.70 |
| Simelton E | 2013 | 20 | 96 | 20.83 |
| Ayanlade E | 2017 | 15 | 69 | 21.74 |
| Osbahr H | 2011 | 14 | 83 | 16.87 |
| Rao K P C | 2011 | 13 | 94 | 13.83 |
| Alam G M M | 2017 | 11 | 119 | 9.24 |
| Ovuka M | 2000 | 11 | 59 | 18.64 |
| Ayal D Y | 2017 | 9 | 36 | 25.00 |
| Habtemariam L T | 2016 | 8 | 33 | 24.24 |
| West C T | 2008 | 8 | 123 | 6.50 |
A difference in authors' order considering local citations and global citations can be identified and indicate that farmers' perceptions and climate data comparison has also gotten the attention of other disciplines and regions beyond the collection. Additionally, the ratio of the local and global citations for the whole collection is 9.72. However, eight of ten most cited papers exceed that ratio, while 65 papers (44%) were not cited at the local level but the global level, explaining some internal inconsistency regarding mutual recognition between the collection. Except for the works by Meze-Hausken (2004), West et al (2008) and Ovuka and Lindqvist (2000), most of those highly cited papers got published in the last ten years window, i.e. 2011 and beyond. Figure 6(a) shows the evolution of local and global citations per year according to the number of papers published. The parallelism between an increase in citation and publication ratios can be identified between 2013 and 2017, but after that, the number of papers increased although global citations decreased. The high number of citations collected in papers published in 2017 can be explained by the reduced options of recent papers to cite more contemporary papers, as the papers which were published after 2017 had not got enough opportunity to get the citations. Interestingly, this tendency can be shown in figure 6(b). We found that the mean of total citations per document decreases in the second ten years window as expected due to the increase in the number of papers published. However, the mean of total citations per year tends to stabilize at three to seven citations per year for the whole collection.
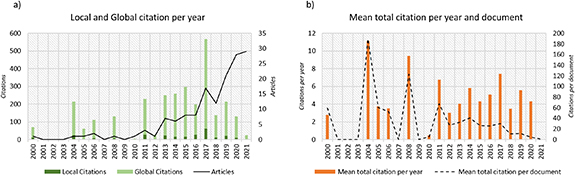
Figure 6. Time evolution of local and global citations per year (a) and mean total citations per year and document (b).
Download figure:
Standard image High-resolution imageAccording to Bradford's Law, the collection has been published in 73 different sources, seven identified as core journals (table 3). Our analysis reveals that 36% of the papers have been published in the core journals, two of which published ten papers or more (Climatic Change and Climate and Development). Journals are mainly indexed in Meteorology and Atmospheric Sciences, and Environmental Sciences categories. Thus, the main contributions to the field have been published in climate journals by covering different points of climate change, combining physical (e.g. weather variability) but, above all, social issues (e.g. human dimensions, society interactions, socio-economic development, policy-making). Otherwise, a transdisciplinary approach is considered in a couple of journals mainly focused on how climate change interacts with sustainable socio-economic development. The most cited sources also published more papers (Climatic Change and Climate and Development), plating a central role within the scientific debate.
Table 3. Core journals according to Bradford's law.
| Sources | Active since | Topic | Papers | Local citations |
|---|---|---|---|---|
| Climatic Change | 1977 | Climate change and variability | 13 | 103 |
| Climate and Development | 2009 | Climate change human dimensions | 10 | 89 |
| Climate Research | 1990 | Climate and society interactions | 7 | 35 |
| Sustainability | 2009 | Sustainable development | 7 | 39 |
| Climate Risk Management | 2014 | Climate variability and policy-decisions | 6 | 28 |
| Environment, Development and Sustainability | 1999 | Environmental impacts of socioeconomic development | 5 | 25 |
| International Journal of Climate Change Strategies and Management | 2009 | Policy-making on climate change | 5 | 10 |
Source dynamics highlighted an increasing interest in comparing farmers' perceptions and meteorological/climatic data, although no common publication pattern was observed among core journals (figure 7). Most journals published their first paper in 2013 or afterwards, experiencing further growth after 2018 (e.g. Climate and Development, Sustainability). Likewise, the two oldest journals—Climatic Change and Climate Research, both included in top 3 core journals—published papers before 2005, while others published their first paper after 2019 (e.g. Environment, Development, and Sustainability). Publication increase after 2016–2017 can be related to the call for special issues conducted by all journals except Environment, Development and Sustainability. Their topics include climate change impacts and responses to increase adaptive capacity (especially in arid/semi-arid and hotspot regions), calls to move the mitigation and adaptation agenda forward, and emerging technologies and win-win solutions from scaling up climate services.
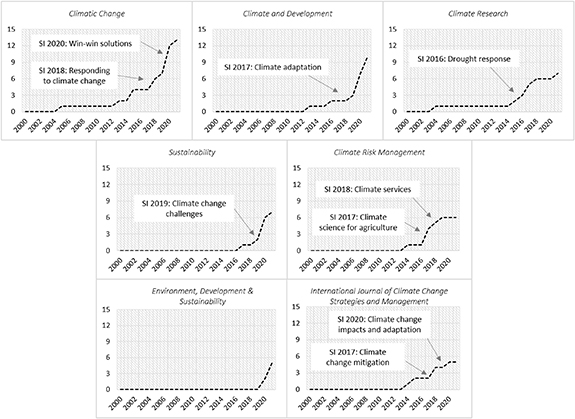
Figure 7. Core source dynamics according to the number of papers published and related special issues.
Download figure:
Standard image High-resolution image3.3. Keywords and themes
Despite common traits between topics, multidisciplinary study fields such as climate change require deep literature analysis to develop new integrated insights. Thus, we performed a keyword analysis to evaluate the specifics of the debate on discrepancy between farmers' perceptions and observed climate data. The first step in keyword analysis requires attention to the title as the most-read part of a paper. Most researchers scanning a list of papers are unlikely to click beyond the title to access the abstract or the full text. Likewise, the title is the mechanism to transmit the message and relevance of the study, and titles must be concise, accurate, and balanced in their presentation of the required aims and expected results. Figure 8 shows the trending topic of the top 5 most used one keyword and two keywords according to the papers' title. As expected, comparing both dimensions highlights less frequency in using two keywords, although three match the top 5 one keyword sample. Furthermore, adaptation measures and meteorological data are only assumed in titles when two-keywords patterns are considered. It is interesting to note how the highest difference between the first and the last appearance of one keyword is for the 'farmer(s)' term (eight years), followed by the term 'variability', while the two keywords patterns show less temporal distance among all the topics (two to four years) except for the 'farmers(s) perception(s)' issue. Most of the two keywords topics appeared for the first time in 2017, accumulating the highest citations. This could explain the motivation to replicate similar titles in more recent papers (post-2018) and, consequently, contribute to reducing the gap between keywords' first and last appearance.
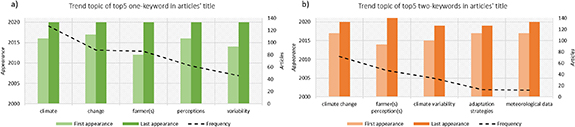
Figure 8. Top 5 trend topics considering the most used one keyword (a) and two keywords (b) in papers' title.
Download figure:
Standard image High-resolution imageIn this line, we have analysed the content of the abstracts using the keywords+ function to harmonize the keywords authors used within their papers while considering those keywords from titles included in their references list. The analysis reveals that 705 keywords were used within the papers, generating 1745 co-occurrences. However, only 225 appear at least two times on the list. Since the distance between two nodes is inversely proportional to the similarity of the keywords, the nodes with a higher co-occurrence rate remain close to each other. Using VOSViewer for visualization, figure 9(a) represents the keywords co-occurrence map in a density mode and considers five as the minimum number of co-occurrences. Two topics, 'climate change' and 'perception' accumulate more than 10% of the total co-occurrences. To complete the top 5 of the highest link strength between keywords, we identified three topics related to farmers' activity and behaviour: 'agriculture', 'adaptive management', and 'rainfall'.
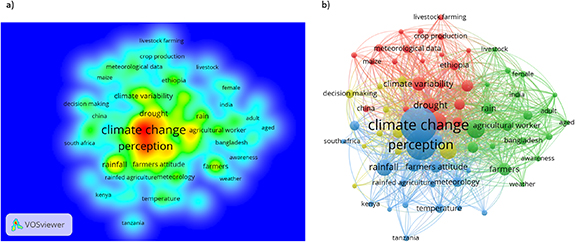
Figure 9. Keywords co-occurrence analysis of author keywords with a threshold of five occurrences in (a) density mode and (b) thematic clusters.
Download figure:
Standard image High-resolution imageConversely, terms like 'meteorological data' or 'weather' are less relevant and located in a secondary scope. As figure 9(b) demonstrates, these five topics are the driving factors explaining the network analysis. The interlinking lines between these keywords represent the strength and relevance of the nodes. The outcome was expected because these keywords are quite common when considering farmers' behaviour regarding climate change impacts. However, there are other significant combinations, including 'crop production-meteorological data' or 'meteorology-farmers' attitude' that point out how researchers are interested in contrasting perceived and observed data by deepening climate change farmers' awareness, farmers' profiles regarding gender or age as driving factors of climate change adaptation, or climate variability affecting specific crops (e.g. maize).
Furthermore, network analysis revealed the existence of four major thematic clusters, combining different keywords that, once grouped into the same thematic cluster (identified by colours), means the keywords are more likely related to the same topic. The red cluster focuses on adaptive capacity and perceived impacts; the green cluster includes farmers' sociodemographic profile and awareness regarding climate change impacts; the blue cluster analyses farmers' vulnerability in terms of crops production affected by rainfall and temperature variability; and the yellow cluster details how decision-making processes can be conditioned by weather forecasting information.
The co-occurrence network can be complemented with factorial analysis to map the conceptual structure of a research framework, identifying how close or distant specific research areas previously identified in figure 9(b) are. The parameters applied in the factorial analysis included dimensionality reduction techniques, such as multiple correspondence analysis, with keywords in the core of the analysis, and applying automatics clustering and a maximum number of terms of 100 keywords. Figure 10 describes variability among the correlated keywords with the potentially lower number of unobserved keywords (factors), aiming to identify independent latent keywords. In other words, we wanted to reduce the number of keywords in the data records to highlight those closer when comparing farmers' perceptions and observed data.

Figure 10. Factorial analysis of keywords+.
Download figure:
Standard image High-resolution imageIn our analysis, two differentiated groups are observed. The red cluster groups together a large number of keywords ranging from those related to observed data in the climate system (e.g. climate change, weather forecasting, meteorological data, climate variability, precipitation, extreme event, drought) with agricultural issues impacted by climate change and influenced by farmers' experience (e.g. crop production, farming system, soil moisture, adaptation strategies, decision-making). The cluster also highlights the relevance of both issues at a geographical scale, especially for Global South regions (e.g. Bangladesh, Burkina Faso, India, Ghana, Nigeria). Despite its complexity, the larger size of this cluster indicates that 47% of the co-occurrences are based on these keywords to scientifically influence the comparison of (in)consistency between perceived and observed climate change impacts. On the contrary, the blue cluster is based on terms related to farmers' profiles (socioeconomic drivers such as gender, age, education) that could influence farmers' behaviour regarding climate change adaptive capacity.
4. Results—literature review
Content analysis was comprised of five sections. The first one (section 4.1) identifies the qualitative tools used to deepen farmers' perceptions and the nature of data used as meteorological records. Afterwards, sections 4.2 and 4.3 summarize the main outputs from farmers' perceptions and climate data records considering temperature and precipitation patterns and related extreme events. Finally, accuracy between perceived and observed data is analysed in section 4.4, while adaptation measures promoted by farmers are considered in section 4.5.
4.1. How perceived and observed data are collected?
The collection uses three qualitative tools to deepen farmers' perceptions: surveys, semi-structured interviews, and focus group discussions. The survey is the most used tool (89%), while about half of the studies use semi-structured interviews (49%) or focus groups discussion (52%) to deepen farmers' perceptions. As tools are not mutually exclusive, two-thirds of the papers combine more than one tool to gather information and cross-check the information collected during the survey (Hasan and Kumar 2019, Bhandari et al 2021). Consequently, some papers adopt a concurrent multistage sample design to include different sample participants such as farmers, stakeholders, and key informants (e.g. development agents, experts, community members) to increase participatory appraisals (e.g. Baul and McDonald 2015, Ayal and Leal-Filho 2017). However, survey sampling with mixed open- and close-ended questions and heuristics provides few details of the qualitative background on farmers and farming characteristics. Less than half of the sample (45%) consider information on social issues (e.g. age, gender, education), while just over a third (37%) provides farming information (e.g. farm size, crops, farming experience). Nevertheless, a dominating farmer's profile can be identified: a man (mainly from Ethiopia), aged about 45 years on average, illiterate or with primary studies, smallholder (<2 ha) cropping maize, wheat, or rice, and with nearly 20 years of farming experience.
Climate data is mainly focused on temperature and precipitation time series collected from national meteorological services and/or meteorological/synoptic stations near the case study(ies) location(s). Inter-annual time series and intra-annual daily, monthly, and seasonal temperature and rainfall patterns, including minimum and maximum monthly temperature, are commonly used. Despite its importance in terms of relative humidity, fog is not recorded by most meteorological stations (Batumike et al 2022), and daily fog data is only considered in a few studies (e.g. Cuni-Sanchez et al 2019). Precipitation data is used as total precipitation (mm) in a given time (month, season or year), while temperature (°C) data is used as mean averages (Le Dang et al 2014, de Longueville et al 2020). This adoption tends to be made as farm production is more sensitive to total precipitation than its mean, while means of temperature are often used to describe climate change patterns. Regarding the time horizon for the analysis, 85% of the sample collects data from 30 years or more, while some papers report a time horizon shorter than 15 years (Moroda et al 2018, Awazi et al 2020, Melvani et al 2020). Authors such as Imran et al (2020) justifies this moderate time horizon because it facilitates comparisons by farmers who experienced weather events and their impacts directly during the same horizon. This is positive to establish a virtual benchmark for perceiving climate. Likewise, some papers discern between temperature and precipitation periods, being the last more extended (e.g. Mulenga et al 2017, Tarfa et al 2019, Dakurah 2021).
4.2. Which climate risks are perceived by farmers?
One in five papers directly ask about the perception and awareness of changing climate (Hitayezu et al 2017, Hein et al 2019, Hundera et al 2019, Mbwambo et al 2021). Most farmers have noticed some abnormal changes in their local climatic patterns or anomalies over the last decades (Brüssow et al 2019) or the past few years (Cullen and Anderson 2017, Dadzie 2021). Even though some papers recognize that farmers did not understand the term 'climate change' or 'global warming', they can comprehend the changing weather patterns in the last decades (Panda 2016). Thus, some papers provide evidence that the farmers can identify subtle climate changes and distinguish between increased natural climatic variability with past scenarios (Akter and Ahmed 2021) or consider climatic changes more than isolated climatic anomalies (Ameyaw et al 2018). However, authors such as Chen and Whalen (2016) suggest that farmers may have difficulty synthesizing and isolating the effect of climate change on their livelihood. The reason why is because agricultural production results from many interacting factors (i.e. soil fertility, input availability, land use, agricultural policy), and it could be challenging to disentangle climate change and climate variability as both have local impacts (Darabant et al 2020). Consequently, deeper analysis was split into three dimensions according to temperature, precipitation, and extreme events patterns and additionally explored by nine main statements (table 4).
Table 4. Dimensions and statements according to farmers' perceptions.
| Dimension | Statement | Sample | Examples |
|---|---|---|---|
| Temperature | Increased temperature | 93% | Hou et al (2012), Baul and McDonald (2015), Gichangi et al (2015), Alam et al (2017), Alemayehu and Bewket (2017), Bekele et al (2018), Limuwa et al (2018), Moroda et al (2018), Hasan and Kumar (2020), Kom et al (2020), Behailu et al (2021) a |
| Increased number of warm days/longer summers/dry spells | 14% | Baul et al (2013), de Longueville et al (2020) b | |
| Increased length of the dry season | 11% | Ameyaw et al (2018) b | |
| Precipitation | Decreased precipitation | 76% | Hou et al (2012), Baul and McDonald (2015), Ojoyi and Mwenge-Kahinda (2015), Wako et al (2017), Bekele et al (2018), Limuwa et al (2018), Moroda et al (2018), Awazi et al (2020), Kom et al (2020), Behailu et al (2021), Bhandari et al (2021), Habte et al (2021) a |
| Erratic precipitation/high variability | 50% | Baul et al (2013), Baul and McDonald (2015), Gichangi et al (2015), Hasan and Kumar (2019), Joshi et al (2019), Mihiretu et al (2020), Mijiddorj et al (2020), Behailu et al (2021), Guodaar et al (2021), Mavhura et al (2021), Nyangau et al (2021) a | |
| Delayed or untimely rainfall/rainy season has shifted | 44% | Dhanya and Ramachandran (2016), Kom et al (2020), Akanbi et al (2021), Bhandari et al (2021), Guodaar et al (2021), Mavhura et al (2021) a | |
| Decreased length of the wet season | 19% | Baul et al (2013), Ameyaw et al (2018), Kom et al (2020) c | |
| Extreme events | Increased droughts frequency and severity | 52% | Ashraf and Routray (2013), Gichangi et al (2015), Dhanya and Ramachandran (2016), Alam et al (2017), Wako et al (2017), Bedeke et al (2018), Bekele et al (2018), Limuwa et al (2018), Mubiru et al (2018), Akanbi et al (2021), Behailu et al (2021), Guodaar et al (2021), Mavhura et al (2021) a |
| Increased floods frequency and severity | 26% | Alam et al (2017), Joshi et al (2019), Yamba et al (2019), Mijiddorj et al (2020), Guodaar et al (2021) c |
Note: Examples have been selected according to the highest agreement levels among farmers' perceptions. a Respondents' perception above 90%. b Respondents' perception above 80%. c Respondents' perception above 70%.
The increased temperature was perceived by more than 90% of the sample, especially related to the mean summer temperature. However, some papers distinguish how winters were getting warmer (Hou et al 2012, Baul and McDonald 2015, de Longueville et al 2020, Mijiddorj et al 2020, Guodaar et al 2021), an increase in minimum temperatures for most months and seasons (Cuni-Sanchez et al 2019) or rising temperatures even in months that are supposed to be cold (Dadzie 2021). Farmers also identified an increased number of warm days (including longer summers and dry spells) (Gbangou et al 2018, Brüssow et al 2019, Rapholo and Makia 2020) and an increased length of the dry season, even considering an escalation in the number of consecutive dry days (Roy et al 2021), heat increase during the regular dry season between June and August (Osbahr et al 2011) and more common dry years (West et al 2008). Interestingly, some authors suggest how farmers are finding it difficult to differentiate between a change in the signal (increasing temperature) and noise (temperature variation) (Elgin-Stuczynski and Batterbury 2014).
Although some papers argue how monsoon rainfall has become more intense during the last decades (Panda 2016) or how rainfall patterns significantly increased at the regional scale (Rabbi et al 2021), decreased precipitation is voiced by farmers in three out of four studies. Most of them focus on the annual mean rainfall values (Alam et al 2017) and seasonal rainfall standards, such as summer rainfall (Traore et al 2015, Sutcliffe et al 2016, Habte et al 2021). However, changes in precipitation levels are considered more controversial, and some papers discuss how farmers' perceptions could distinguish between the nature of rainfall trends at annual and seasonal levels (Ayal and Leal-Filho 2017). Farmers who observed drier field conditions and crop stress may conclude that a decrease in precipitation caused these conditions, even if changes in rainfall patterns were not directly observed. Consequently, farmers tend to view changes in precipitation through the lens of crop water needs and crop response (Chen and Whalen 2016, Dadzie 2021), thinking about rainfall as a process rather than a quantity (de Longueville et al 2020). This fits well with a utilitarian perspective for which farmers' perception of declining rainfall tends to reflect its livelihood impacts in terms of a decline in agricultural production and food security, which are also caused by factors other than climate change, such as the limited use of farm technologies and innovation (Etana et al 2020).
However, for authors such as Baul and McDonald (2015), there is no permanent trend perceived in rainfall patterns because they are erratic or unpredictable. About half of the sample agrees with this statement by consistently referring to changes in the onset and offset (cessation) of rainy seasons (Shameem et al 2015, Kabote et al 2017, Mulenga et al 2017). Likewise, rainfall outside of rainy seasons is perceived to be more frequent (Le Dang et al 2014), while decreasing rainfall is registered during the wet season (Simelton et al 2013, Sutcliffe et al 2016), affecting the expected crop cultivation period (Chaulagain and Rimal 2019). This delayed or untimely rainfall, expressed as rainfall variability, reverts into an increasing pattern of extreme events. These events are maximized when increased temperatures and decreased rainfall patterns coexist in a specific season (e.g. summer), as occurred in 62% of the sample. Consequently, droughts and floods are mainly perceived as top risks for crop production during the summer (Nnadi et al 2019).
In general, farmers perceive drought risk above flood risk in terms of increased frequency and severity, obtaining significant internal consistency among the samples (90% vs 70%, respectively). According to Darabant et al (2020), farmers perceive extreme events, such as droughts or floods, as more important than mean temperature and precipitation due to their major impact on crop production. The impact on the livelihood counts, rather than the cause, in defining drought and flood risk from the farmers' viewpoint (Meze-Hausken 2004). Thus, some farmers identify secondary climate patterns impacting their crop production, such as shortening fog duration (Etana et al 2020, Batumike et al 2022) or the decreased average number of rainy days and wet spells (Ngoe et al 2019, Rapholo and Makia 2020), while the increased frequency of strong winds (Hou et al 2012, Mijiddorj et al 2020) and increased frequency of dust storms and hail storms (Yu et al 2014, Mulenga et al 2017, Joshi et al 2019, Kaganzi et al 2021) are considered as secondary extreme events.
4.3. What about climate data covering extreme events?
Meteorological data focus on two dimensions (temperature and precipitation patterns) and five secondary statements. A general tendency to increase temperature and decrease rainfall has been confirmed, being the leading indicators of climate change (Paudel et al 2021). However, while the analysis of temperature records tends to show maximum temperatures increasing, a decline in rainfall amount is not so apparent or severe (Weldegebriel and Prowse 2016). About three out of four papers (76%) confirm an increase in temperature patterns, with particular focus on the summer period, while only 7% of the sample considers the increased number of warm days, longer summer seasons or dry spells. Some papers also include rising winter temperatures, counting a threefold increase in average minimum daily temperature compared to the maximum (Chen and Whalen 2016). Likewise, climate data recognizes a faster growth in the minimum temperature during winter than in summer (Baul et al 2013, Ayal et al 2021), or how the winter temperature can reflect a sharp increase in temperature across different cropping zones (Imran et al 2020). Conversely, climate anomalies for maximum and minimum annual temperatures cannot be defined as a trend, suggesting a non-stable warming pattern to compare farmers' perceptions (Limuwa et al 2018).
Four out of ten (44%) of the sample agree about a common pattern of decreasing rainfall amount (Yamba et al 2019, Zhang et al 2019), including a reduction in the average number of rainy days (Limuwa et al 2018), while studies in which climate data corroborates an increase of rainy days (Hundera et al 2019) or winter precipitation (Chaulagain and Rimal 2019) during summer are less abundant. However, some studies (41%) characterize rainfall patterns as erratic, unpredictable, with highly dispersed rains, or onset and cessation rains (Meze-Hausken 2004, Kabote et al 2017, Mkonda and He 2017), especially when considering geographical contexts affected by the monsoon season (Joshi et al 2019, Melvani et al 2020). In addition, a decreased length of the wet season is observed in some papers (9%), especially regarding the number of consecutive wet days (Muthuwatta et al 2017). This high inter-annual precipitation variability is considered for its potential impact on agricultural production since the amount and distribution of precipitation in a given season/year determines the success or failure of crop production (Ashraf and Routray 2013).
Temperature and precipitation patterns are mainly analysed as basic useful information sources through annual and seasonal data. However, some papers also include monthly data to emphasize which months can confirm climate is changing (Imran et al 2020). On this wise, relevant fluctuation in the average monthly rainfall is identified, but this monthly average tends to be higher in the rainy season than in the dry season (Awazi et al 2020). Furthermore, precipitation trends determine remarkable fluctuations between nearby meteorological stations (Abid et al 2019, Akanbi et al 2021). In this direction, most papers outlined how climate data is conditioned by limited, insufficient or underperforming availability of weather stations and missing records (Etana et al 2020, Makame and Shackleton 2020), becoming necessary to input and compare missing observations with the records of nearby meteorological stations of similar latitude (Mulenga et al 2017, Mavhura et al 2021). In some papers, identifying spatial micro-climate differences could be challenging as weather stations are limited in number and unevenly distributed (Etana et al 2020).
Interestingly, some papers include the trend line of past climate events (Dhanya and Ramachandran 2016). However, few studies checked how instrumental records could be used for characterizing extreme events behaviour. An interesting example is a Ghanaian research carried out by Ameyaw et al (2018), in which climate data was used to identify an increase in dryness periods, indicating that the area witnessed its worst drought during the referred period of the study (1970–2017). Likewise, climate data confirms the frequent occurrence of strong winds and sand-dust storms in Northern China, according to the research carried out by Hou et al (2012), while an increase in the frequency of intense rains (floods) is identified by Mijiddorj et al (2020) in its Mongolian research.
4.4. Which level of accuracy between perceived and observed data?
Farmers' perceptions of changing climate are mostly consistent with the historical climate trends considering three statements: increased temperature, decreased precipitation, and high variability (erratic, delayed or untimely) in rainfall patterns. However, accuracy is not homogenous: the highest level derives from increased temperature (79%), while decreased and erratic precipitation are recognized by about one-third of the sample (36% and 34%, respectively). The highest accuracy in terms of increased temperature can be aligned with the fact that this statement possesses far less inter-annual variability and needs fewer parameters to assess its change than precipitation patterns (Hou et al 2012, Dakurah 2021). Therefore, farmers can perceive temperature trends more accurately than rainfall trends (Guodaar et al 2021). Although perceived data obtains the highest recognition from the sample than observed data, their comparison highlighted how: (a) increased temperature is the impact which is both most perceived and most observed; (b) decreased precipitation displays the most significant discrepancies between perceived and observed data (32% of disagreement between both samples), and (c) high variability in rainfall patterns accumulates the slightest difference between perceived and observed data (9%). However, the convergence and divergence between each statement are strongly influenced by the agro-ecological contexts in which farmers undertake their farming activities (Etana et al 2020).
According to Behailu et al (2021), the discrepancy between farmers' perceptions and meteorological records is mainly observed in the summer and annual rainfall trends. In some cases, observed data confirms a significant increase in mean annual temperature but no significant change in annual rainfall, although farmers perceive both patterns. Some authors hypothesize that this leads farmers to irrigate more due to their perception that the changing temperature and precipitation regime is increasing crop water stress (Chen and Whalen 2016), being influenced by the performance of their main crops (Rao et al 2011). The same pattern is followed when the high temperature coincides with the lowest level of precipitation, suggesting that the farmers' strong perception of temperature increase might have been related to increased evapotranspiration rates (Limuwa et al 2018). Other papers report a change in the total annual precipitation volume not confirmed by climatic observations, while observed data ensured progressively increased annual days without precipitation and a longer dry season with more substantial precipitation than usual (Brüssow et al 2019).
Conversely, some papers confirm how farmers perceive abnormal rainfall concerning timing and distribution instead of confirming a decrease in precipitation (Dakurah 2021). The reason is twofold: rainfall variability has worse consequences for production plans (Alam et al 2017), and high levels of rainfall fluctuation make the start and the end of the farming season hardly manageable, even hampering farmers' local knowledge (Awazi et al 2020) or applying traditional forecast systems where microclimate makes meteorological data less reliable (Etana et al 2020). Furthermore, differences in accuracy between decreased and variable precipitation can be motivated by divergence in occurrence. While decreased precipitation is considered a medium-long term and forward-looking phenomenon, precipitation variability is related to short term and one-time phenomena (Ayal and Leal-Filho 2017). In this sense, farmers often overestimate the frequency of unfavourable weather events and might confuse changes in rainfall with changes in the sensitivity of the cropping system (Traore et al 2015). For example, in drought years, farmers with less irrigated cropland could not obtain adequate water resources, leading them to be more likely to perceive a decrease in precipitation (Wang et al 2020).
Few papers provide accuracy analysis for each statement, combining an increased temperature, a decreased precipitation, and high variability in rainfall patterns (Ayal and Leal-Filho 2017, Kom et al 2020, Akanbi et al 2021), while three papers are unable to prove accuracy in any of the statements between perceived and observed data (Awazi et al 2020, Linke et al 2020, Mijjidorg et al 2020). About one-third of the papers circumscribes accuracy only in terms of increased temperature, while 13% confirms accuracy in decreased precipitation. Only the Kenyan study by Cuni-Sanchez et al (2019) was focused explicitly on erratic rainfall accuracy. Some papers concur an increased temperature and reduced precipitation, while one in five accurately identifies increased temperature combined with erratic precipitation behaviour. Finally, only four papers prove accuracy as a combination of decreased and highly variable precipitation (Ovuka and Lindqvist 2000, West et al 2008, Gbangou et al 2018, Yamba et al 2019).
4.5. Which adaptation measures are implemented by farmers?
Most papers confirm that farmers are aware that the sustainability of their current livelihood and traditional cropping system is under threat due to changing temperature and precipitation patterns (Shah et al 2021), asking for a change in farm practices to design effective adaptation measures (Cullen and Anderson 2017). As a common trend, farmers tend to invest (limited) resources into climate change adaptation measures depending on whether they perceive risk and how they think it will affect their livelihood (Chen and Whalen 2016). Furthermore, receiving weather forecasting information contributes to promoting adaptation (Akter and Ahmed 2021), while farmers' experience determines the heuristics of adaptation. Some papers briefly analyse this point. For example, Ceci et al (2021) prove that farmers attending at least primary school appear to be more inclined to implement adaptation strategies and participate in different development and natural resource management initiatives. On the contrary, linking climate variability to non-rational issues (e.g. God's punishment) could reduce the likelihood of action, as farmers see this as out of control (Ashraf and Routray 2013, Makame and Shackleton 2020). Additionally, lack of access to supplementary water resources, credit facilities, or extension services is the most important barrier to climate change adaptation (Teshome et al 2021).
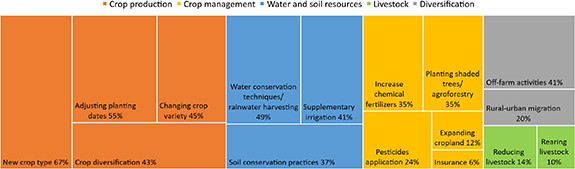
About half of the papers (46%) provide enough background on farmers' adaptation measures to cope with climate change impacts. Farmers mainly implement 16 adaptation measures, grouped into five categories: crop production, crop management, water and soil resources, livestock, and diversification (figure 11). Introducing new drought-resistant crops (67%) is the leading measure, followed by adjusting planting dates (55%) and applying water conservation techniques and rainwater harvesting (49%). Not surprisingly, farmers who perceive an increasing temperature trend are more likely to apply supplementary irrigation and use drought-resistant crop varieties (Hou et al 2015). Likewise, erratic rainfall and recurrent droughts motivate farmers to shift from water-intensive crops (e.g. maize, rice, cotton) and pulse crops (e.g. beans, peas) to vegetables, fruits, and other cash crops productions (Ayal et al 2018, 2021). Adjusting planting dates is applied to cope with the adverse effect of extremes events, such as seasonal floods and droughts and storm surges (Akter and Ahmed 2021). Independent variables such as age, gender, crop type, and farm management significantly influence the use of changing planting dates as an adaptive response (Akanbi et al 2021). If changing planting dates is not enough to ensure adaptation, farmers promote crop diversification to enrich an integrated crop-livestock farming system which is more risk-averse than a specialized or monoculture system (Zampaligre et al 2014).
Figure 11. Main adaptation measures implemented by farmers.
Download figure:
Standard image High-resolution image
Increasing use of organic and mineral fertilizers is promoted as input for crop management due to its nature as climate-smart integrated soil fertility management practice, allowing greater productivity and agronomic efficiency (Ceci et al 2021). Some farmers also recognize agroforestry and tree planting as innovative and effective water conservation techniques that could also maintain crops' ecological integrity while saving supplementary irrigation (Ojoyi and Mwenge-Kahinda 2015). However, some papers recognize the lack of training and funds to promote agroforestry practices and soil conservation techniques (Batumike et al 2022). Alternatively, farmers expand cropland after reporting a decrease or failure in crop production motivated by dry spells or increased pest prevalence after flood events (Batumike et al 2022). On some occasions, expanding cropland can reduce large livestock (Baul and McDonald 2015), even bringing to livestock selling (Cuni-Sanchez et al 2019). Insurances are also considered, although some papers mention the complicated process for the farmers to understand their benefits when extreme events occur (Panda 2016). The last option is to apply livelihood diversification strategies, such as investment in off-farm activities or seasonal migration (Bedeke et al 2018, Yamba et al 2019). Diversification outside agriculture may occur either as a deliberate household strategy (by design) or as an involuntary response to a crisis (by default). The former usually involved non-farm activities in manufacturing or service sectors, whilst the latter often included piecework on other farmers' land or harvesting natural resources (Weldegebriel and Prowse 2016).
Interestingly, some papers analyse how accuracy between farmers' perceptions and climate data affects farmers' adaptation intention. Overall, accurate perceptions correspond to stronger adaptation intentions, while underestimated or low perceptions result in weaker adaptation intentions (Abid et al 2019). For example, farmers who perceive rainfall changes adapt to climate change more readily than those who perceive temperature changes (Ochieng et al 2017). Other papers analyse how a combination of risks can determine which specific adaptation measures are applied, as illustrated in the Nepalese study by Budhathoki and Zander (2020), in which farmers who perceived rising temperatures and more erratic rainfall applied three adaptation strategies: better water management practices, use of pesticides, and growing early maturing varieties.
5. Discussion
We identify some consolidated research areas after discussing primary insights from bibliometrics and exploratory content analysis combination. Likewise, multiple research gaps and associated narratives ask for new research opportunities.
5.1. Consolidated and to consolidate research areas
The bibliometric analysis highlights some consolidated research areas while offering further research topics with potential for consolidation. Among the consolidated research, we distinguish the hybrid nature of the sample combining physical (climate variability) and social (perceived impacts) issues. From the core dataset and the co-occurrence map, we identify general concepts such as 'climate change', 'perception', and 'adaptive management' being topics at the genesis of the domain, while other keywords such as 'weather' or 'meteorological data' remain in the background. Most of these topics are circumscribed in the thematic analysis to distinguish four main consolidated research areas: perceived risk and its effects on farmers' adaptive capacity, crop vulnerability according to temperature increase and erratic rainfall patterns, forecasting use and influence in farmers' decisions, and climate change awareness considering different farmers' profiles. The co-occurrence network confirms these research areas as those with greater coverage concerning the number of keywords' occurrences. However, the exploratory analysis does not recognise the same relevance in each area (e.g. only one in five papers directly asks about farmers' climate change awareness). As seen in figure 9, keywords related to extreme events such as 'drought', 'rain'/'rainfall' or 'climate variability' have been more investigated than subjects characterising farmers (e.g. age, gender) or farming (e.g. livestock, crop production). The factorial analysis delves into this point by identifying a dual behaviour of the consolidated research. On the one hand, the blue cluster exemplifies the isolated nature of that research focused on farmers' profiles, while the red (and most relevant) cluster can compile more exhaustive research combining a triple-loop approach: (a) observed data (extreme events and weather patterns), (b) impacts on crop production (especially regarding temperature and precipitation variability), and (c) adaptation measures (strategies at the local or the regional scale). The exploratory analysis corroborates the relevance of the red cluster as less than half of the sample deepens on farmers' profiles when analysing extreme events effects. Likewise, bibliometrics and exploratory analysis highlight consolidated research in terms of drought and flood risk analysis, which are more commonly addressed than temperature and precipitation variability due to their direct and significant impact on crop production and farmers' livelihood.
However, some research topics remain open to be consolidated in future research. For example, the density mode co-occurrence map demonstrates a low co-occurrence rate between 'climate change + perception' and 'awareness'. Nonetheless, the literature has demonstrated how farmers' awareness of climatic variations combined with an accurate perception is imperative to scale their ability to mitigate the effects on farming activities and as the preliminary step to increase adaptive capacity (Mustafa et al 2019, Akano et al 2022). This opens the door to new research questions. For example: How much does the perception of extreme events influence climate change awareness? Can greater awareness reduce discrepancy with observed data? Even more striking is the lack of literature explicitly studying why decreased precipitation displays the most significant discrepancies between perceived and observed data, as confirmed by the exploratory analysis. Conducting studies that interconnect climate change awareness and perception of precipitation patterns as complementary research fields will likely create extensive opportunities to elucidate the discrepancy between perceived and observed data.
Likewise, it is somewhat surprising that the literature tracking progress on main adaptation measures tends to ignore heuristics influencing adaptation action, despite heuristics becoming part of the way things are done and absorbed into tacit knowledge and pathways, passed on through training and experience (Nalau et al 2021). As individuals, farmers are not 'blank slates' receiving information and evaluating climate change experience: their attitudinal and behavioural response results from how that experience is interpreted and appraised (Hamilton-Webb et al 2019) according to different socio-psychological filters, such as religion, emotions, memories, worldview, ideology, political orientation, activism, communication and information networks, social interdependence, or spatial geography (Howe et al 2019a, Dietz 2020, Ruiz et al 2020, Brosch 2021, Mackay et al 2021, Mallappa and Shivamurthy 2021). Our science-metric study reveals that most of these factors—including climate change scepticism or uncertainty (Howe et al 2019b, Poortinga et al 2019) remain timely or geographically underexplored in current literature. Consequently, we suggest to put major efforts to reinforce heuristics and socio-psychological perspective when perceived and observed data are compared as part of a novel domain-dependent trend to deepen farmers' profiles, as it is the less dominant research cluster according to bibliometrics results.
5.2. Main research gaps
Although the existing research results are very rich, the research data are relatively extensive, and the research methods are also diversified, we identify five main research gaps made as arguments for whether or not the perceived and observed climate data are dissonant.
5.2.1. Conceptual gap: meaning deviation
The conception of weather and climate patterns is not homogeneous. For example, the study carried out by Meze-Hausken (2004) identifies a mismatch between how farmers define 'normal' weather patterns and how it affects their comparison with climate data. In this regard, some farmers define 'normal' rainfall as sufficient rainfall in amount and distribution over time and space to meet the needs of specific livelihoods, that is, satisfactory crop and pasture growth to enable economic security (Ovuka and Lindqvist 2000, Ochieng et al 2017, Makuvaru et al 2018). This means that when judging changes in rainfall, farmers' time frame tends to be the period when rain is expected for planting (Etana et al 2020). Consequently, 'abnormal' is applied as long as farmers do not fit their agriculture calendar or they do not obtain the expected crops productivity (Limuwa et al 2018). Furthermore, farmers can perceive 'normal' those rainfall patterns in which precipitation was exceptionally good, which entails a deviation from the ideal (not the most dominant) pattern. This deviation may conflict with meteorological data, considering large and total events, physical parameters, and climate conditions (Hundera et al 2019). To address this gap, some authors propose to consider 'normal' as well as 'optimal' rainfall not only in terms of quantity but concerning timing (seasonal occurrence, delays in start of rainy season, occurrence of crop demand), duration, amount, intensity, and region-specific distribution (Meze-Hausken 2004). However, this information is not usually detailed by available data from meteorological stations.
'Drought' meaning is also discussed, especially to distinguish between agricultural and meteorological droughts, although most studies have not figured out this issue when asking farmers about drought risk (Sutcliffe et al 2016). Broadly, farmers link 'drought' years to past seasons involving partial or total crop failures due to high variability in precipitation patterns and season temperature imbalance (Brüssow et al 2019). This high variability can motivate misperception and inconsistency between perceived and observed data. Consequently, authors such as Meze-Hausken (2004) argue the need to delve into the type of drought affecting irrigated territories, differentiating between meteorological, agricultural, or hydrological drought. This approach seems particularly useful in contexts in which different drought types coexist. Along this line, some studies discuss how different drought types affect irrigation patterns and how farmers' vulnerability differs even facing similar drought characteristics in terms of intensity, duration, or spatial distribution (Osbahr et al 2011).
5.2.2. Information gap: meteorological and heuristics bias
Farmers' perceptions are built by their observations of climatic conditions and the climate information they receive from different sources. Some studies argue that limited access or inaccessibility to information might be partly responsible for wrong perceptions (Rapholo and Makia 2020) and farmers' adaptation intentions (Abid et al 2019). On some occasions, limited or lack of information are related to poor quality data from meteorological stations. Studies use either station-based or downscaled data to generate climate trend analysis. However, most studies recognize limitations in the station-based data, including missing values and measurement errors (Esayas et al 2019, Budhathoki and Zander 2020). Likewise, some studies inform about the lack of meteorological stations near the case study and how this affects accuracy (Zampaligre et al 2014, Kabote et al 2017), so farmers should essentially pick and choose helpful information to compare with their own experience (Muita et al 2016). This point is crucial because farmers' perceptions are more likely to be similar to climate data from the nearest meteorological stations, which requires being more cautious while interpreting farmers' perceptions at a larger geographical level (Panda 2016).
Consequently, some studies include a brief analysis of how farmers collect information. For example, what is the media stories' role, and how do climate change headlines affect farmers' behaviour? (de Longueville et al 2020), what about farmers' association to reduce individual misinformation? (Akanbi et al 2021), or how access to climate information and early warning systems can help improve farmers' decision-making? (Esayas et al 2019). Furthermore, authors such as Dakurah (2021) recommend analysing climatic data beyond inter-seasonal climatic events to include intra-seasonal climatic events as the latter is more critical to farmers: within every season, farmers are worried about when is it going to start to rain, how long will the season be, or if dry spells will characterize the season. Despite widespread climate change literacy, farmers prefer to use personal observations over meteorological forecasts (Kaganzi et al 2021), so there is a need to ensure conclusive communication procedures of forecasts to bring them closer to farmers' local knowledge.
5.2.3. Cognition gap: perception description and local knowledge
As a cognitive process, perception analysis requires primary data from participants, both individually through interviews and surveys and at the community level through focus groups. Diversity in approaches can be used to address farmers' perception analysis, understand what constitutes a climate risk, and determine their effects on farmers' beliefs and behaviour. Some studies identify the lack of attention to 'perception' description as the reason for discrepancy between perceived and observed data (Simelton et al 2013). In most cases, studies discuss their conceptual heterogeneity, arguing that the diversity of definitions cause farmers' misunderstanding and inaccuracy when interpreting climate patterns. This was partially explained by the fact that 'to perceive' (and its derivative, 'perception') has two subtly different meanings in English: (a) become aware of (something) using one of the senses, especially that of sight and; (b) interpret or regard (someone or something) in a particular way. In this regard, the reviewed collection essentially understands the perception of climate-related risks as 'climate risk awareness', including a limited description of what means 'perception' or a broader concept ('risk perception') and which drivers influencing the most from a social dimension (Schneiderbauer et al 2021).
Interestingly, some studies try to address this issue from local knowledge and experience, which can play an important role in improving the value of complex parameters, including seasonal climate forecasts, which means potentially increasing farmers' resilience to face variability in rainfall or droughts (Mulenga et al 2017, Streefkerk et al 2022). However, various studies overlook or oversimplify the understanding of 'perception' from local knowledge, especially in indigenous communities, due to difficulties translating local cultures and worldviews into scientific parameters.
5.2.4. Time frame gap: recent and unnoticed events
Most studies determine that farmers' perceptions are shaped by short-term variability of climate parameters and the frequency of extreme events rather than slow long-term changes in average conditions (Darabant et al 2020). That is, farmers generally tend to remember extreme weather events occurring in the recent past better than gradual climate trends (Brüssow et al 2019). Similarly, it is commonly believed that farmers' memory is unlikely to keep track of climate alteration events reliably over a long-time frame (Ceci et al 2021). So, farmers are likely to have forgotten how the climate was, and their perceptions are somewhat shaped by recent events (Budhathoki and Zander 2020). Some sampled studies delve into this issue. For example, Hou et al (2012) conclude that farmers remember details no more than three years back in time, while Meze-Hausken (2004) determine how farmers' memory tends to highlight those extreme events (i.e. drought) causing direct and irreversible impacts (e.g. farmers forced to migrate due to starvation). Other studies (Bedeke et al 2018) go one step forward, asking how to ensure that when farmers respond to the 10–20 years framework, they are not thinking in the short term. Certainly not a trivial issue if we consider that some studies use concurrence between perceived and observed data time frames to analyse intermediate years accuracy (Mulenga et al 2017).
5.2.5. Geographical gap: Global South dominance
Climate change adaptation is a global phenomenon, but adaptation possibilities are highly case-specific. It is not surprising that a significant fraction of the papers is carried out at the local scale. However, it is striking to see from the bibliometrics analysis that large fractions of the world are not studied in the literature. Our bibliometric results show an unbalanced geographical distribution of case studies, focusing on the Global South and low-income countries (mainly from southern and eastern Africa and South Asia), leaving high-income regions unrepresented (such as the United States or European region). While the applied methodology could influence this, it could be as a result of research priorities of different countries, availability of funds, etc, even revealing the limits of the available literature, as identified in similar research on climate change impacts and energy production nexus carried out by Viguié et al (2021). Considering that many countries are yet to fully delve into this topic, we should wonder whether the current literature, as a whole, presents a systematic bias leading to an under-estimation of climate change perceived and observed data.
There is a substantial lack of connection between research areas to be consolidated and the nature of the research gaps identified in the current literature. Future research should pay more attention to their interaction to prevent these gaps from perpetuating. On this basis, we mention three aspects to promote closer synergy in future research directions. Firstly, define climate patterns (e.g. 'normal' and 'abnormal' meaning) before contrasting perceived extreme events and climate change awareness nexus. As a result, the conceptual gap will be addressed while promoting farmers' local knowledge will face the information gap. Secondly, to promote heuristics and socio-psychological analysis in which 'perception' meaning can be clearly defined and subsequently discussed considering farmers' capacity to discern between perceived impacts in the short- and long-term. Consequently, both the cognitive and the time frame gaps will be achieved. Finally, upcoming research should promote these research directions from a Global North perspective to reduce the geographical gap and facilitate spatial contrast more exhaustively.
6. Conclusions and future research
Research contrasting climate change perceived and observed data is diverse and fast-growing, illustrated by an inherently interdisciplinary approach and addressed by multifocal analysis. Bibliometrics highlighted four consolidated research lines: (a) perceived risk and its effects on farmers' adaptive capacity, (b) crop vulnerability according to temperature increase and erratic rainfall patterns, (c) forecasting use and influence in farmers' decisions, and (d) climate change awareness considering different farmers' profiles. However, it can be deduced from the systematic review that perceived data could not replace observed data (and vice versa) in advancing research because each source presents numerous limitations. Still, at least five main research gaps coexist and remain partially inconclusive: (a) a conceptual mismatch affecting key issues such as 'normal pattern' or 'drought' meaning, (b) poor or limited data from meteorological stations, (c) overlook or oversimplification of local knowledge in describing perception, (d) farmers' memory weaknesses to keep track of climate alterations, and (e) a geographical dissonance in favour of Global South regions. They thereby question whether our current research trends provide enough understanding of accuracy between climate change perception and climate data. This opens the door to new research questions, such as how climate change awareness influence observed data accuracy (especially in terms of precipitation patterns) or how studies can incorporate heuristics when focusing on farmers' profiles analysis. Bibliometrics and exploratory analysis confirm that farmers' perception is complex and not necessarily captured by one measurable variable, or conversely, farmers' perception focuses on one aspect while the assessment should be more integrative. Famers' perception depends on climate variability and experience in extreme events captured in their day-to-day activity, but climate science is vast and complicated, covering a wide range of topics. Furthermore, farmers do not usually retain quantitative measures of climate parameters (e.g. the amount of rainfall received during various seasons). However, they have a good grasp of general climatic conditions, especially concerning those variables that significantly impact crop performance (rainfall variability and extreme temperatures). Consequently, if addressed regularly, farmers' perceptions studies could provide a qualitative database to become a proxy that supports or validates instrumental climate data time series, especially when the latter is unavailable, of low quality, too short and/or only collected on recent periods. Most importantly, the combination of perceived and observed data sources could generate recommendations for the design and test of adaptation policies better tailored to climatic conditions and crops production requirements but also provide mechanisms to distinguish between farmers' exposure, impacts, and sensitivity to climate change, which is the base to increase their adaptative capacity.
Data availability statement
No new data were created or analysed in this study.
Funding
This paper has been developed under the funding received from the European Union's Horizon 2020 research and innovation program Marie Sklodowska-Curie Individual Fellowship, Grant Agreement No. 832464 to the first author.