

Abstract
Tropospheric ozone (O3) is harmful to plant productivity and negatively impacts crop yields. O3 concentrations are projected to decrease globally in the optimistic Representative Concentration Pathway of 2.6 W m–2 (RCP2.6) but increase globally following the high-emission scenario under the RCP8.5, with substantial implications for global food security. The damaging effect of O3 on future crop yield is affected by CO2 fertilization and climate change, and their interactions for RCP scenarios have yet to be quantified. In this study, we used the Joint UK Land Environment Simulator modified to include crops (JULES-crop) to quantify the impacts, and relative importance of present-day and future O3, CO2 concentration and meteorology on crop production at the regional scale until 2100 following RCP2.6 and RCP8.5 scenarios. We focus on eight major crop-producing regions that cover the production of wheat, soybean, maize, and rice. Our results show that CO2 alone has the largest effect on regional yields, followed by climate and O3. However, the CO2 fertilization effect is offset by the negative impact of tropospheric O3 in regions with high O3 concentrations, such as South Asia and China. Simulated crop yields in 2050 were compared with Food and Agriculture Organisation (FAO) statistics to investigate the differences between a socioeconomic and a biophysical process-based approach. Results showed that FAO estimates are closer to our JULES-crop RCP8.5 scenario. This study demonstrates that air pollution could be the biggest threat to future food production and highlights an urgent policy need to mitigate the threat of climate change and O3 pollution on food security.
Export citation and abstract BibTeX RIS

Original content from this work may be used under the terms of the Creative Commons Attribution 4.0 license. Any further distribution of this work must maintain attribution to the author(s) and the title of the work, journal citation and DOI.
1. Introduction
Ground-level ozone (O3) is one of the leading air pollutants that substantially threatens human health and plant productivity (Tai et al 2014, Sadiq et al 2017, Leung et al 2020a). It is mainly produced photochemically from anthropogenic precursor gases, including carbon monoxide (CO), volatile organic compounds and nitrogen oxides (NOx ), which are mainly emitted from fossil fuel combustion. The phytotoxicity of O3 has been shown to damage photosynthesis, reduce gas exchange, induce early leaf senescence, and inhibit growth in both natural vegetation and crops (Feng et al 2011, Sadiq et al 2017, Tai and Val Martin 2017, Hayes et al 2020, Seltzer et al 2020, Leung et al 2020b, Li et al 2022b). As plants play a vital role in regulating the ambient environment, ozone-induced damage in plants may further accelerate environmental degradation, with severe consequences for human and ecosystem health.
1.1. Ozone in a warming climate
Tropospheric O3 concentrations are controlled by emissions and climate (Jacob and Winner 2009). First, global warming and climate change in response to increased greenhouse gas concentrations can enhance stratosphere-troposphere exchange of O3 (Zeng et al 2008, Jacob and Winner 2009, Fiore et al 2012). Second, increased temperature also favors O3 chemical production and peroxyacyl nitrate (PAN) decomposition, which can lead to higher tropospheric O3 in certain regions (e.g. Zeng et al 2008, Jacob and Winner 2009). PAN is a secondary pollutant found in photochemical smog. It dissociates slowly in the atmosphere into NO2 and peroxyacetyl radicals. If PAN is formed in or convectively lifted to the troposphere, it remains stable for long enough to be transported far away from urban sources. This process is vital for tropospheric O3 production as it can indirectly transport NOx to regions where it can more efficiently produce O3. Third, enhanced convection from increased temperature transports O3 precursors and lead to an increase in O3 production. Lastly, lightning frequency increases with increased temperature and results in a 22% increase of lightning-produced NOx (Zeng et al 2008). However, a warming climate could lead to higher water vapour in the atmosphere and a decreased in background O3 concentration. In conclusion, the background O3 and climate penalty-driven pollution have opposite sensitivities to climate change (Jacob and Winner 2009, Schauberger et al 2019).
1.2. Ozone impacts on agriculture
In the United States alone, crop losses due to tropospheric O3 cost more than 5 billion USD annually (Ainsworth et al 2012, Betzelberger et al 2012). It is estimated that the cost in developing countries is much higher, where agricultural techniques are less advanced, and the productivity of staple crops are susceptible to the effects of climate change via more frequent occurrences of droughts, floods, pests and disease outbreaks (The Royal Society 2008). A recent study by Li et al (2022a) showed that O3 damage causes 7%–19% relative yield losses in China from 2010 to 2017 for rice, wheat and soybean (Li et al 2022a). The estimated global average yield loss due to O3 damage in 2000 is 5.4%–15.6% for soybean, 7.3%–12.3% for wheat, 2.8%–3.7% for rice, 2.4%–4.1% for maize (Van Dingenen et al 2009).
Several studies have investigated the global impact of O3 on agricultural crop yields with future air quality scenarios (Van Dingenen et al 2009, Avnery et al 2011, Tai and Val Martin 2017) to the year 2030 or 2050. Van Dingenen et al (2009) provided the first estimate of global crop yield losses due to O3 in the future, using the optimistic 'current legislation scenario' that assumes current air quality legislation is being fully implemented in 2030. Avnery et al (2011) commented that such scenario is overly optimistic as legislation enforcement often lags behind the announcement. Avnery et al (2011) examined the impact of O3 exposure on future crop yields using the Intergovernmental Panel on Climate Change Special Report on Emissions Scenarios (IPCC SRES) year-2030 scenarios and found that O3 causes 12.1% and 16.4% soybean yield loss in 2030 for the Representative Concentration Pathway (RCP)2.6 and RCP8.5 scenarios, respectively, which the RCP2.6 and RCP8.5 scenarios cover the minima and maxima of the O3 projections However, neither Avnery et al (2011) nor Van Dingenen et al (2009) account for the effects of rising CO2 concentration and climate change in future scenarios, which could not fully project future crop yield changes. A recent study by Tai et al (2021) summarized three approaches of modeling O3 impact on crop yields: concentration-based metrics, flux-based metrics, and mechanistic modeling. They found that only mechanistic modeling (i.e. JULES-crop) could address the co-effects of CO2 fertilization. JULES-crop model is thus selected to further perform factorial simulations with the combination of RCP2.6 climate and RCP8.5 CO2, climate and O3 scenarios to investigate the sensitivity of crops to these driving factors.
This study investigates future crop yield response climate change, O3 and CO2 and their interactions using JULES-crop over the period 2005–2100. Many existing studies (Fiore et al 2012, Schauberger et al 2019, Hayes et al 2020, Sampedro et al 2020) simulate crop response to climate projections spanning only a few years each due to computational limitations, while this study simulate long transient timeseries. This approach could help distinguish an actual anthropogenic-forced climate signal from internally generated climate variability (Nolte et al 2018). With rising CO2 expected in the RCP8.5 scenario, the exposure-yield relationship derived from concentration-based metrics would be less applicable due to the effect of CO2 fertilization (Tai et al 2021). JULES-crop, in this case, could provide insights on how CO2 interacts with O3 damage on yield.
2. Methodology
JULES-crop is a model that parameterize and simulate crop production (Osborne et al 2015). Osborne et al (2015) showed that JULES-crop could simulate yield variation successfully using historical climate data. More detail about JULES-crop is in supplementary materials (available online at stacks.iop.org/ERL/17/074007/mmedia). Furthermore, the effect of O3 on crop is parameterized using Sitch et al (2007) and has been previously extensively evaluated for Soybean at a Free-air enrichment experiment by Leung et al (2020b). To test if JULES-crop could be used to realistically simulate future yield loss, we compared the results with the estimates from the Food and Agriculture Organisation (FAO) Working Paper 2050 projections. Rather than being a process-based approach like JULES-crop, which represents vegetation processes and is driven by climate forcing, FAO makes yield projections based on socio-economical data. The data includes arable land availability, yield growth potentials and ceilings for present-day crops, water availability, and irrigation potential. In principle, all these characteristics may be affected by climate change (Alexandratos and Bruinsma 2012). Since FAO uses a bottom-up approach to region-specific data, it has higher resolution and regional relevance, which could be more helpful in informing local policymakers and regional planning. The regions we selected are four of the highest yield production countries/regions for the four crops. There are eight in total: USA, China, Brazil, Argentina, EU, India, Bangladesh, Indonesia (table 1).
Table 1. Annual crop productions of the four major crop producing regions for each crop in million tonnes as of 2020 (FAO 2022).
| Maize (million tonnes) | Wheat (million tonnes) | Soybean (million tonnes) | Rice (million tonnes) | ||||
|---|---|---|---|---|---|---|---|
| USA | 360.25 | China | 134.25 | Brazil | 121.79 | China | 213.61 |
| China | 260.87 | EU | 126.66 | USA | 112.55 | India | 178.31 |
| Brazil | 103.96 | India | 107.59 | Argentina | 48.79 | Bangladesh | 54.91 |
| Argentina | 58.39 | USA | 49.69 | China | 19.61 | Indonesia | 54.65 |
2.1. Simulation protocol
To evaluate the performance of JULES-crop simulation, JULES-Crop is applied over the historical period from 1961 to 2005 with climatology from CruNCEP, modelled ozone fields and observed CO2 data to simulate crop yields for four major global crops: soybean, wheat, maize, and rice (see supplementary material). The order of O3 damage for the four crops simulated by JULES for year 2000 is consistent with the estimation by Van Dingenen et al (2009), whereby soybean has the highest sensitivity and maize has the least (supplementary material).
For future simulations, JULES was forced over the 2005–2100 period with changing CO2, O3 and climate according to the RCP2.6 and RCP8.5 scenarios.
The simulations are initialized from the historical simulations from Osborne et al (2015). However, when a driving variable is fixed (i.e. O3 or CO2), it is fixed at the year-2005 value for the transient future period. The model is applied for the 2005–2100 transient simulation using a factorial design varying or fixing CO2, O3 and varying climate according to the RCP scenarios (table 2). Given that the historical simulations were driven with merged Climatic Research Unit and National Centre for Environmental Prediction data (CRUNCEP) and the future simulations with HadGEM2-ES climatology, and the fact that the model requires 1–2 years of spin-up for the fast fluxes (soil moisture, soil temperature and NPP), we spun up the model for 5 years using 2005 climatology before the actual simulation.
Table 2. Summary of future transient runs with a combination of prescribed CO2 and O3, black: climate change only, red: climate change and CO2 change, blue: climate change and O3 change, purple: combined effect of climate change, CO2 and O3 change together.
| Run ID | Climatology | CO2 | O3 |
|---|---|---|---|
| RCP2.6 | RCP2.6 | Const. 2005 | Const. 2005 |
| RCP2.6 + CO2 + O3 | RCP2.6 | RCP2.6 | RCP2.6 |
| RCP2.6 + CO2 | RCP2.6 | RCP2.6 | Const. 2005 |
| RCP2.6 + O3 | RCP2.6 | Const. 2005 | RCP2.6 |
| RCP8.5 | RCP8.5 | Const. 2005 | Const. 2005 |
| RCP8.5 + CO2 + O3 | RCP8.5 | RCP8.5 | RCP8.5 |
| RCP8.5 + CO2 | RCP8.5 | RCP8.5 | Const. 2005 |
| RCP8.5 + O3 | RCP8.5 | Const. 2005 | RCP8.5 |
The future harvested areas for the four crops (i.e. wheat, soybean, maize, and rice) were kept constant at the year-2000 distribution as presented by Monfreda et al (2008) and Ramanutty et al (2008) since the yield changes are independent of changes in the cultivated areas. There were 13 global simulations, including eight factorial future transient simulations with combinations of the two RCP scenarios driving data prescribed with CO2 and O3 (table 2). RCP2.6 and RCP8.5 were selected as they represent the upper and lower boundary of future RCP and climate change scenarios. These runs were used to investigate the relative impacts of climate change, CO2 and O3 damage on crop yields. The relative contribution of a driving variable is calculated by subtracting the yield of the baseline RCP-2005 run from RCP (to estimate the climate change contribution), RCP + CO2 (to estimate the CO2 contribution) and subtracting the baseline yield from RCP + O3 (to estimate the O3 contribution).
3. Results and discussions
3.1. Impacts of different combinations of climate, CO2 and O3 changes on global crop yields
As shown in figure 1, JULES-crop simulates a higher yield for all crops in RCP8.5 than in RCP2.6 if the CO2 fertilization effect is included. However, without CO2 fertilization, RCP8.5 results in a lower yield than RCP2.6 due to O3 damage and climate change alone (blue line in figure 1). The effect of O3 damage is greatest for soybean and wheat; as C3 plants they are more sensitive to O3 damage than C4 maize (Long et al 2005, Williams et al 2017).

Figure 1. Global average crop yield from 2010 to 2100 for (a) maize, (b) wheat, (c) soybean and (d) rice simulated by calibrated JULES-crop in RCP2.6 and RCP8.5 scenarios with constant 2005 CO2 and O3 in black line, varying CO2 and constant 2005 level O3 in red, constant 2005 CO2 and varying O3 in blue and varying O3 and CO2 in purple.
Download figure:
Standard image High-resolution imageIn JULES-crop, the effect of CO2 fertilization is higher than O3 damage; the CO2 increase in RCP8.5 more than compensates the O3 damage, and in RCP2.6, the compensation cancels out the O3 damage effect for soybean and wheat. CO2 can also reduce the leaf stomatal conductance of vegetation and therefore reduce plant O3 uptake and damage. Climate change alone in RCP8.5 has a significant negative effect on yields, causing around one-third of the yield loss from 2010 to 2100 for all four crops (see supplementary materials for more information). Global soybean experiences the highest yield loss from O3 damage among the crops, losing around 1 tonne per hectare. The climate change impact on crop yields in RCP2.6 is significantly less than the impact in RCP8.5; the yield stays mainly constant from 2005 to 2100.
The O3 impact is substantially higher in RCP8.5 than in RCP2.6 (figure 1). The impact of O3 on crop yield is higher when CO2 increases are not included in the simulation. This effect is the result of a higher CO2 concentration causing stomatal closure and reducing the uptake of O3 into the stomata, which leads to a lower plant O3 impact. This means that CO2 fertilization offsets yield loss due to O3 damage. However, this mechanism does not apply to maize and rice in the RCP8.5 scenario (figure 1(a): maize and 1d: rice), whereby including O3 does not further reduce the yield compared to the standard scenario (without CO2−O3 interactions). The result suggests that climate change dominates the changes in maize and rice yields, which can be explained by the regional analysis in the next session.
Figure 2 shows that soybean is the most sensitive to O3 damage, followed by wheat. Rice and maize have similar O3 damage sensitivity. All three C3 plants (soybean, rice and wheat) show higher sensitivity to CO2 rise than the only C4 plant (maize) among the staple crops. Under the combined effect of CO2 fertilization and O3 damage, soybean shows a slightly higher compensation effect than the other C3 crops when compared with simulations without enhanced CO2 fertilization. All C3 crops show similar percentage yield change when RCP8.5 + CO2 + O3 are compared with the climate change-only scenario.
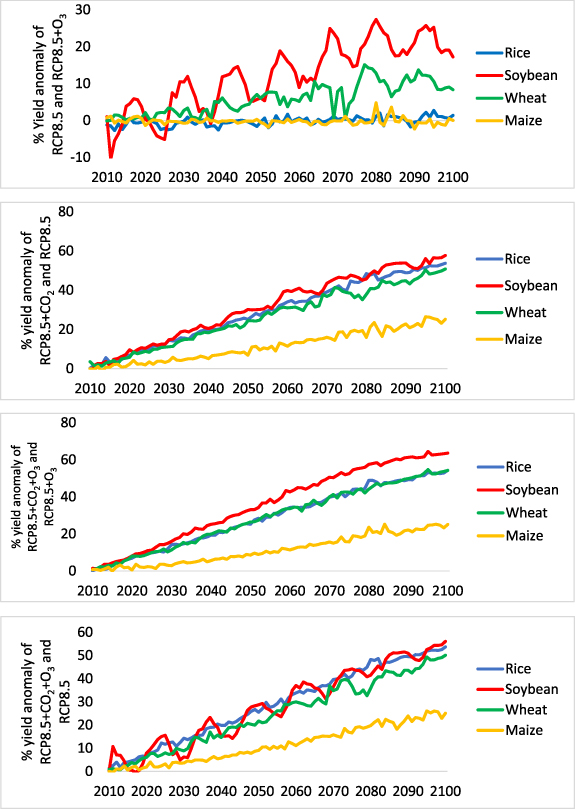
Figure 2. Percentage of yield anomaly of the four crops in the following combinations of scenarios (from top to bottom): RCP8.5 minus RCP8.5 + O3, RCP8.5 + CO2 minus RCP8.5, RCP8.5 + CO2 + O3 minus RCP8.5 + O3 and RCP8.5 + CO2 + O3 minus RCP8.5.
Download figure:
Standard image High-resolution imageThe general yield loss of the four crops due to O3 damage simulated by JULES-crop are consistent with other studies. Together with results from previous studies, we show that the sensitivity of the four crops to O3 are ranked in the order from high to low as soybean, wheat, rice, and maize, with soybean being the most sensitive and maize being the least (Van Dingenen et al 2009, Feng et al 2022). Maize is the least sensitive because as a C4 plant, maize has an efficient CO2-concentrating mechanism, which essentially decouples stomatal conductance and the ensuing ozone damage from photosynthesis.
Climate change-only simulations show that temperature and precipitation change in RCP8.5 scenarios have a considerable negative impact on crop yield. Figures S4 and S5 shows that all crops are negatively impacted by climate change, with rice most impacted. This is because most rice-producing countries are concentrated in the tropical regions, where climate change would cause temperature rises above the optimal temperature threshold of rice (Erda et al 2005, Parry et al 2005, Auffhammer et al 2012).
In the RCP8.5 scenario, the simulated crop yield for all four crops decreased due to climate change alone (see supplementary materials for more detail). Yields for all four crops fall by more than 7%, according to table S4. These simulated reductions in yields resulting from climate change are mainly due to increasing temperature and frequency and intensity of extreme weather events such as storms (Villarini and Vecchi 2012) as reported by many other studies (Kang et al 2009, Asseng et al 2014, Porter et al 2014, Levis et al 2016, Mills et al 2018, Schauberger et al 2019). The reductions will be explained in the next section.
According to figures 1, S4 and table S4, on a global scale, RCP8.5 climate with RCP8.5 +CO2 + O3 scenarios simulate increases in yields for all crops. It increases the most for soybean (>60%), and then wheat and rice (20%–30%), and it increases the least for maize (<6%). The fact that maize has the smallest increase in yield of the four crops is due to the phenology of C4 plants. In RCP2.6 scenario, the CO2 concentration increases to 440 ppm in 2050 and decreases back to 400 ppm in around 2075. Therefore, the overall CO2 fertilization effect in RCP2.6 is small compared to the RCP8.5 scenario. When the CO2 fertilization effect is not considered, O3 damage is very noticeable; yields decrease for all crops in 2050 with the largest decline in soybean (22%) and wheat (16%); yield reductions in rice and maize are smaller in comparison (<8%). O3 damage on soybean is higher than on other crops in general. According to UNEP (2018), the average O3 induced soybean yield loss is around 23%, while other crops are less than 10%. Mills et al (2018), using multiple observations, also concluded that soybean is more sensitive to O3 than other crops. Osborne et al (2016) showed that the O3 sensitivity of soybean has increased overtime by one third between 1960–2000. It is possible that selective breeding strategies that target high yield and high stomatal conductance has inadvertently selected for soybean cultivars that have higher O3 sensitivity overtime (Osborne et al 2016).
Figure 3 summarizes the factorial runs by plotting the global yield change from 2010 to 2100 according to the annual CO2 and O3 concentration combinations. The colour of the data points represent the yield change. The yield for all crop types decreases when CO2 is below 430 ppm. When CO2 is above 500 ppm, even with a high O3 concentration, the yield still increases. For RCP8.5 + O3 scenario, with increasing O3 concentration alone (the horizontal straight line), yields decrease for soybean and wheat because they are both O3 sensitive crops. Since O3 damage is most significant during the crop growing period, the regional seasonal O3 concentrations were plotted in figure S1.

Figure 3. Global crop yield change from 2010 to 2100 relative to yield at 2005 according to CO2 (y axis) and O3 (x axis) concentration. Each point represents a year. The colour represents the yield change relative to the year 2005 yield.
Download figure:
Standard image High-resolution imageAt the global scale, O3 damage impact on rice yield is not as large as expected (Pang et al 2009, Tang et al 2011) according to figures 1 and 3. Therefore, we look at the regional yield change to find which regions contribute to the reduction of yield in RCP8.5 when CO2 and O3 are not included in the model in the next section.
3.2. Impacts of O3 and CO2 alone on regional crop yield
Usually, crop growing seasons coincide with high-O3 seasons. Figure 4 shows that higher O3 concentrations during the growing season negatively correlate with yield for all regions. According to figure 4, using the RCP8.5 scenario, the higher the O3 concentration during the growing season, the more crop yield will be affected by higher temperatures. This effect is also reported by Van Dingenen et al (2009) and Avnery et al (2011), who used a concentration-based approach to estimate yield loss.
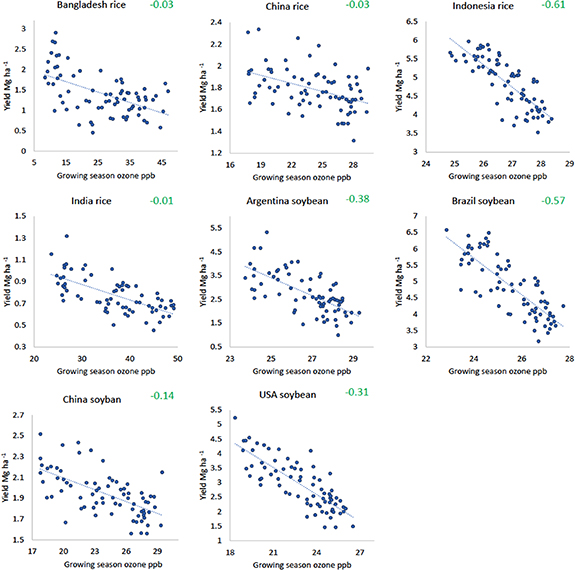
Figure 4. Scatter plots of modeled JULES crop yield and average modelled O3 concentration in ppb during the growing season for rice and soybean. June–August are the growing season for the Northern hemisphere regions and tropical. December–February are the growing season for southern hemisphere regions. The numbers on the top right represent Pearson correlation.
Download figure:
Standard image High-resolution imageIn general, in RCP2.6, decreases in O3 concentrations are not mainly due to an assumed clean air policy but rather due to a climate change mitigation policy, which reduces emissions of the greenhouse gases such as CH4 and postulates a transition to more renewable energy production (Chalmers et al 2012, Wild et al 2012, Jones and Warner 2016). The reduction of O3 is a co-benefit of the decline in O3 precursors (CH4, NOx, CO) from the transition to renewable energy. Therefore, this suggests that climate change mitigation is as important as clean air policy in improving food security. However, regarding the yield improvement alone on a plant physiology perspective, a clean air policy will be more beneficial as CO2 fertilization affords a substantial yield increase, and it can compensate for the O3 damage on crop yield.
According to figures S6–S8 in RCP8.5, soybean, wheat, and rice experience a significant yield increase in all regions, although O3 concentration increases because of the strong CO2 fertilization that overshadows the damaging effect of O3 (figure 5). Since maize is a C4 crop less sensitive to CO2 and O3 increases, it shows a slight increase in yield. RCP2.6 in figure S3 shows that O3 concentration decreases in 2030, resulting in increased yield in all regions. The yield increase in RCP2.6 is around 10%–15%, while RCP8.5 could be up to 80%.
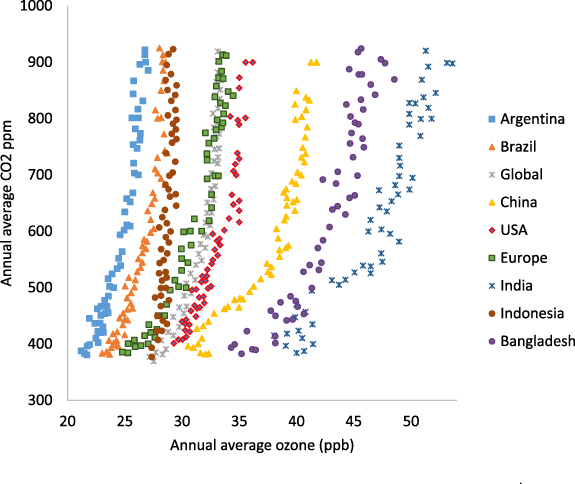
Figure 5. Regional CO2 and O3 concentration in RCP8.5 scenarios from HadGEM2. Each dot represents a year.
Download figure:
Standard image High-resolution image3.3. Impact of climate change alone on regional crop yield
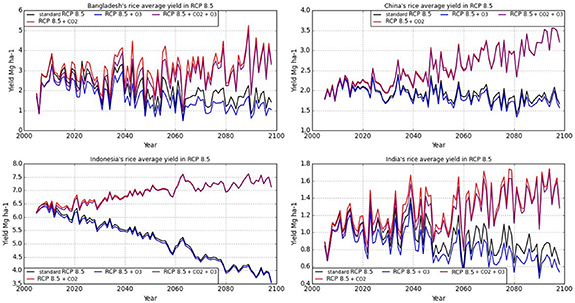
Figure 6 implies that majority of the rice yield reduction is because of climate change. The climate change in Indonesia contributes to the largest decline of rice yield from 6.5 to 4.0 tons ha–1, mainly due to increases in ambient air temperature with the annual average temperature over 30 °C from 2070 (figure 4).
Figure 6. Rice yield in the four major rice-growing regions Bangladesh, China, Indonesia and India in RCP8.5 scenarios as simulated by JULES.
Download figure:
Standard image High-resolution image
In the RCP8.5 scenario, Asian countries experience a high frequency of extreme weather events with heatwaves of temperatures greater than 30 °C projected to increase by 131% (Lee et al 2014) compared to the current climate (figure 6). The frequency of heavy rainfall is expected to increase by 24% in RCP8.5 for some regions, as shown in figure S5. These extreme weather events would result in frequent floods and droughts (Lee et al 2014). In the RCP8.5 scenario, an intensified monsoon season over East Asia is projected. Since all the key rice-producing countries are in East Asia, this significantly impacts the yield. Advancements in agronomical technology would not be quick enough to adapt to the changing climate (Jagadish et al 2012, Scheben et al 2016).
Since heatwaves in East Asia usually coincide with the rice growing season, it has an enormous impact on yield. Nevertheless, high CO2 concentrations in the RCP8.5 scenario offset the yield loss from climate change.
3.4. Comparison between JULES-crop and Food and Agriculture Organisation yield projections
In table 3, JULES-crop yield is compared against the FAO Working Paper 2050 projections. According to this data, the FAO projection is much more optimistic than JULES-crop using the RCP8.5 and 2.6 projections. All four crops show a higher yield growth in FAO data than JULES-crop RCP8.5 and 2.6 scenarios simulations. The difference is that because FAO projections are based on socioeconomic factors, it is fundamentally different from the biophysical factors JULES-crop uses. Among the four crops, soybean yield growth for RCP8.5 is the closest to FAO projection, suggesting that soybean calibration improves the yield estimation (table 3).
Table 3. Comparison of crop yield (Mg ha−1 yr−1) FAO projection and JULES-crop simulations of RCP8.5 and RCP2.6 scenarios in 2010 and 2050.
| Crops | FAO | RCP8.5 CO2 + O3 + climate | RCP2.6 CO2 + O3 + climate | |||||||||
|---|---|---|---|---|---|---|---|---|---|---|---|---|
| 2010 | 2050 | Difference | 2010 | 2050 | Difference | 2010 | 2050 | Difference | ||||
| Maize | 4.74 | 6.06 | +1.22 | +26% | 2.83 | 2.93 | +0.09 | +3.4% | 2.75 | 2.77 | +0.02 | +1% |
| Wheat | 2.77 | 3.82 | +1.05 | +38% | 2.13 | 2.54 | +0.41 | +19% | 2.06 | 2.38 | +0.32 | +15% |
| Soybean | 2.3 | 3.2 | +0.9 | +39% | 3.41 | 4.15 | +0.75 | +22% | 3.31 | 3.84 | +0.54 | +16% |
| Rice | 4.07 | 5.32 | +1.25 | +31% | 3.04 | 3.68 | +0.64 | +21% | 3.09 | 3.35 | +0.25 | +8% |
JULES-crop future simulations allow a comparative study of human and climate influence on crop yields. In general, climate change, O3 damage and CO2 fertilization also result from human activities. We can divide the factors into active and passive human influences. Active human influences includes land use change, fertilizer application, irrigation, and other management methods, which follow primarily socioeconomic and technological development. Passive influences are the biophysical effects that JULES-crop currently represents, i.e. impacts of climate change, O3 damage and CO2 fertilization on yields. FAO statistics consider the active but not the passive influences. The crop production projection in the FAO report (Alexandratos et al 2015) was based on demand and trade projections. Demand and trade were based on demographic and socioeconomic projections for each country. Alexandratos et al (2015) argues that future yield growth is attained mainly by closing the yield gap in developing countries, whereas yield ceilings have already been reached in some developed countries. Mills et al (2018) also found that O3 damage is one of the most important factors that contribute to yield gap, especially O3 sensitive crops, soybean and wheat (Mills et al 2018). The FAO report does not account for extreme weather events or pest infestation outbreaks, and it also neglects CO2 fertilization, leading to a considerable underestimation of productivity. Therefore, it tends to be overly optimistic (table 3). While JULES-crop does not have nitrogen limitation, for the RCP scenarios with CO2 and O3, it is thus also over-optimistic, assuming that the CO2 effect would be fully translated into yield growth (Long et al 2004).
3.5. Impact of increasing CO2 on human nutrition
Besides carbohydrates, a healthy diet should include nutrients such as protein, phosphate, and minerals. (Tulchinsky 2010). A phenomenon has been observed in non-legume C3 crops during high CO2 conditions. The crops cannot assimilate sufficient nitrogen from soils to maintain the usual C:N ratios in tissues (Bloom et al 2012, Myers et al 2014). This phenomenon has been known as 'carbohydrate dilution', in which CO2 stimulated carbohydrate production by plants dilutes the rest of the grain components. Of all the elements, changes in nitrogen content at elevated CO2 concentrations have been the most studied. This carbohydrate dilution effect has been observed consistently in most crops but less significant on leguminous crops. Research suggested high CO2 concentration could stimulate greater nitrogen fixation to maintain tissue C:N ratios (Erda et al 2005, Myers et al 2014). As projections showed that atmospheric CO2 would likely continue to increase in the future, programmes such as biofortification, supplementation and breeding crops cultivar for decreased sensitivity to CO2 would help address the nutrient deficiency caused by CO2 fertilization.
4. Conclusions
In conclusion, results from global JULES-crop simulations suggest that rising CO2 has the greatest impact on global crops yield, climate change is the second most important, and O3 pollution has a relatively smaller impact (except for soybean). This study shows that on a regional scale, the relative impact of climate, CO2 and O3 would be different from the global scale as O3 air quality and climatic changes (e.g. in precipitation and temperature) varies considerably spatially.
This study demonstrates the co-benefits of climate mitigation and air quality improvement are the most powerful policies to develop. CO2 fertilization may offset part of the adverse effects of climate change and air pollution. Still, such benefits of CO2 fertilization would not be sustainable if the damaging effects of climate penalties and air pollution continues. CO2 fertilization would also reduce the nutrient content of crops and may lead to potential malnutrition in food-insecure countries. In the long run, climate mitigation and clean air should combine with technology advancement of crop science. Continued development of cultivars that are heat tolerant, O3 tolerant and supplemented with nutrients would help improve food security and human nutrition in the world of growing population.
Acknowledgments
Felix Leung gratefully acknowledges financial support from the NERC CASE Studentship with Met Office (NE/J017337/1), 'Impact of tropospheric O3 on crop production under future climate and atmospheric CO2 concentrations, and their interactions within the Earth System'. Felix Leung is also funded by the Research Sustainability of Major RGC Funding Schemes of The Chinese University of Hong Kong (Project No. 3133189), the Vice-Chancellor's Discretionary Fund of The Chinese University of Hong Kong (Project No. 4930744) and the CUHK-University of Exeter Joint Centre for Environmental Sustainability & Resilience (ENSURE) fund (Project No. 4930820). We acknowledge the following AmeriFlux sites for their data records: US-Ne1, US-Ne1, and US-Ne3. In addition, funding for AmeriFlux data resources and core site data was provided by the US Department of Energy's Office of Science. Gerd Folberth wishes to acknowledge support by the Met Office Hadley Centre Climate Programme funded by BEIS and Defra (GA01101) and additional funding through the EU Horizon 2020 CRESCENDO project, Grant 641816. Stephen Sitch wishes to acknowledge support by NERC (NE/R001812/1). The authors would also like to acknowledge Karina Williams, Anna Harper, and Eddy Robertson for the help in technical part of JULES, and Wu Chao for the valuable comments on the manuscript
Data availability statement
The data that support the findings of this study are available upon reasonable request from the authors.