


Abstract
Uganda is the third-largest refugee-hosting country partly due to its open-door policy—deemed one of the most progressive. When new refugees arrive, refugee settlements are established rapidly, and irreversible changes to the landscape are inevitable. We utilize satellite data to map land cover (LC), land use, and burned area (BA) to assess their relationship in the context of large-scale refugee resettlement in Bidi Bidi—Uganda's largest refugee settlement. We show inevitable dramatic changes in LC, e.g. built-up residential zones increased from 1.8% to 30%, while cropland increased from less than 0.7%–25.6% during our study period (2015–2019). In contrast, BA that affected more than 80% of the area was drastically reduced during the establishment phase (August–December 2017). Substantial reduction in BA was observed predominantly within the residential zones, but outside of the zones, BA was hardly affected by the arrival of refugees. Our study shows that these changes in LC and BA are mainly missing in the readily accessible satellite-derived data products, which impede assessment, planning, and implementation of humanitarian response programs. We discuss the importance of mapping at the appropriate spatial and temporal scales and the importance of context, sector, and geographic domain knowledge expertise in developing critical information products for informing programs to support vulnerable populations.
Export citation and abstract BibTeX RIS

Original content from this work may be used under the terms of the Creative Commons Attribution 4.0 license. Any further distribution of this work must maintain attribution to the author(s) and the title of the work, journal citation and DOI.
1. Introduction
Understanding the linkages between land cover (LC) and land use (LU) and fire dynamics is essential for land management [1]. This linkage is particularly critical when traditional practices such as bush burning for rangeland management and crop field preparations pose significant threats to human life, especially when rapid changes in population increase vulnerability in already fragile environments within refugee settlements [2–5].
Fire is an essential part of the African savanna ecosystems, with frequent fire activity determining the vegetation structure and composition. Local communities have developed knowledge and practices for regulating fire activity without eliminating it to minimize the undesirable effects of fire [6, 7]. Many livelihood activities in Africa involve fire, including cooking, land preparation for agriculture, hunting, deterring wildlife damage to crops or livestock, improving quality and quantity of forage, preventing bush encroachment, and fire management [6]. Despite the significant scale of burning and the dangers fires pose to the local population, very few studies have assessed the significance of fires at the regional (Northern Uganda) scale and their relationship to LU and LC change. The likely continued influx of refugees makes understanding these relationships essential.
Satellite Earth-observation (EO) data provides critical, relevant, and timely information supporting development planning, including urban growth analysis [8], urbanization [9], drought monitoring and early warning [10–12], cropland and agricultural LU mapping [13–17], agricultural monitoring and food security [18–20], and burned area (BA) estimation [21, 22]. This study is particularly interested in using EO data to understand the relationships between BA and LU [23, 24] and the relationship between refugee settlements and LC [25–28]. However, the lack of up-to-date and high-resolution LC maps remains a critical barrier to their use in supporting policy planning, particularly in regions dominated by smallholder agriculture that are most vulnerable to food insecurity, including most refugee settlements [25]. EO-derived products such as readily available cropland maps, e.g. LC CCI [29] and MCD12Q1 IGBP [30], are too coarse. Similarly, the publicly available moderate resolution imaging spectroradiometer (MODIS) BA Product (MCD64A1 Collection 6 [21]) that provides over 20-years of global coverage at 500 m spatial resolution is too coarse to capture small and fragmented burns which are the most common fire type in Africa [21, 24, 31, 32]). This can lead to a severe underestimation and misinterpretation of both the landscape changes and their drivers and can impact short- and long-term management strategies of refugee settlements [22, 33–36].
Refugee settlements in Uganda are largely missing in datasets with diverse downstream applications, including improving emergency responses and early warning of climate hazards [37]. Due to low temporal and spatial resolution, many existing products do not cover the settlement scale LC dynamics. This limitation is evident in readily accessible population datasets, including [38] and [39]. Settlement scale mapping is not only resource-intensive but often requires specialized mapping, very high-resolution data, and local knowledge to provide context-specific insights to interpret results [40]. There have been few studies seeking to understand the dynamics, consequences, and livelihood implications of ongoing large-scale resettlement in Uganda (for example [41]) and studies leveraging EO (for example [42]). These studies can be critical and are often the only source of information needed to ensure appropriate humanitarian responses.
1.1. Study goal
To examine the relationship between BA and land cover and land use change (LCLUC) in large-scale refugee resettlement, we begin our analysis with a brief background of the study area–Bidi Bidi Refugee Settlement. We map LCLUC pre-and post-settlement establishment (2015–2019) and analyze pixel-level dynamics to understand the role of fire in LU transition. We quantify road density and analyze readily accessible population data, both critical features of LU transition that can explain spatial changes.
2. Study area
Bidi Bidi is the largest refugee settlement in Uganda, located in Yumbe district east of the river Nile. Our study area is approximately 850 km2 with the five refugee residential zones (figure 1) that total 250 km2 juxtaposed with host communities. Host community leaders designated the zone locations in an area primarily grazing [43]. Several host community village centers (including Odrevu, Baringa, Ezeli, and Yumbe) are located within our larger study area and are directly accessible from the settlement zones. Yumbe district has a tropical climate with mean annual rainfall ranging from 1050 to 1350 mm and an annual temperature ranging from 24 ∘C to 27 ∘C (see figure 2) [7]. Except for a small patch of the forest toward the East, Bidi Bidi was primarily a grassland area with scattered short trees and shrubs with croplands located mainly to the southwest and northeast [44]. Subsistence farming remains the primary source of livelihood [44].

Figure 1. Location of Bidi Bidi refugee settlement, Uganda.
Download figure:
Standard image High-resolution image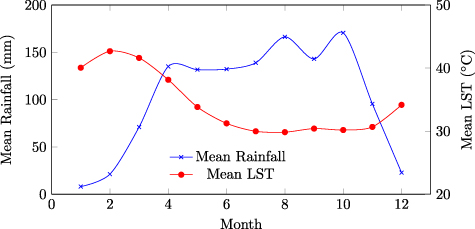
Figure 2. Mean annual rainfall and land surface temperature (LST) 2002–2018 for Yumbe District.
Download figure:
Standard image High-resolution imageRefugee residential Zone 1 was established immediately after violent clashes broke out in Juba, South Sudan in July 2016, and closed to new arrivals approximately two months later, when planned capacity was exceeded 1 . Later arrivals were settled in Zones 2–5 before the settlement was closed in December 2016. By May 2017, Bidi Bidi was home to an estimated 287 000 refugees [45].
2.1. Uganda's refugee crisis
Africa's largest refugee-hosting country Uganda has a 'progressive' refugee policy that allows refugees access to basics required to rebuild their lives. Although Uganda is home to over 1.4 million refugees, the country falls in the low human development category, and the lack of funding is challenging its liberal refugee-hosting history. Uganda has a long refugee-hosting history dating back to the 1940s. However, more extensive hosting started later in 1955 when an estimated 79 000 Southern Sudanese refugees arrived, followed by Congolese and Rwandese refugees in 1959/1960 who settled in present-day Oruchinga and Nakivale [46]. Historically, most of the refugees in Uganda have been from Congo, Rwanda, and Sudan, but the country has also hosted many more refugees [46]. While some refugees can return, the majority remain displaced and permanently settled in the refugee settlements [47]. With continued political strife in the region, this trend has created a perpetual emergency response cycle and a growing refugee population in Uganda. New refugee arrivals are often similar to previous influxes characterized by a very high proportion of women and children. By the end of 2017, after Bidi Bidi was established, the refugees and asylum seekers were estimated at 1.3 million people, with nearly 986 626 persons from South Sudan, 236 406 from the Democratic Republic of Congo, and 39 658 from Burundi [47].
3. Data and methods
3.1. LC classification
A single annual (10 m) mosaic was extracted from Sentinel-2 images with less than 20% cloudy pixels between 1 May and 30 September each year, beginning with 2015 before establishing the settlement until 2019. May to September is the peak of the growing season in the region. It is selected to ensure we minimize errors of commission and omission between cropland and other natural vegetation [48, 49]. Specifically, 2015–2018 images were downloaded from USGS Earth Explorer. Images with the least cloud cover over Bidi Bidi (May to November) during the growing season were manually selected and atmospherically corrected to Level-2A surface reflectance products using the Sen2Cor algorithm [50] and uploaded to Google Earth Engine (GEE). 2019 Level-2A images were accessed directly in GEE.
Mosaics were created from Level-2A Sentinel-2 imagery in GEE, excluding cloudy and shadow pixels, using the Sentinel2Cloud probability masks (see table in appendix 1 for the full list of images each year). Median pixel mosaics were then clipped to the Bidi Bidi boundary obtained from the United Nations High Commissioner for Refugees (UNHCR) during fieldwork in 2016. Only the 10 meter (Bands 2, 3, 4, and 8) and 20 meters (Bands 5, 6, 7, 8A, 11, and 12) were used for this study. The 20-meter bands were pan-sharpened to 10 meters before training the LC classifier. The Normalized Difference Vegetation Index (NDVI) was calculated as  and added to each mosaic. NDVI data are a common data source for LC mapping and have been shown to improve model accuracy when added as an input variable [16, 51]. Random Forests was selected after several experiments, including running the support vector machine [52], Classification and Regression Trees [53] and Random Forest [54] classifiers in GEE. It had the highest overall accuracy (OA) for all years and all classes. Table 1 summarizes the datasets used in this study.
Table 1. Data sets used in this study.
| Task | Data | Source |
|---|---|---|
| Land cover mapping | 2015–2018 Sentinel-2 L1C | USGS Earth Explorer |
| 2019 Sentinel-2 L2A | GEE ee.ImageCollection COPERNICUS/S2_SR | |
| Burned Area Estimation | Sentinel-2 | Sentinel-hub.com |
| Landsat | USGS Earth Explorer | |
| Road Delineation | PlanetScope Monthly Mosaics | Planet Labs |
| Training data | Planet Monthly Mosaics, Google Earth Pro Imagery | |
| Shapefiles | Settlement and Zone boundaries | Obtained from UNHCR during fieldwork in 2016 |
3.2. Training data
LC training data (urban, shrub/forest, cropland, and grassland) were collected through a combination of image interpretation in GoogleEarth Pro and QGIS using monthly mosaics from PlanetLabs API (www.planet.com) and screen labeling directly in the GEE JavaScript API. Planet's monthly and quarterly Basemaps have a high temporal and high spatial resolution (3 m) and were used to dis-aggregate similar LC types, particularly between agricultural and grassland classes that were sometimes difficult to discern. Figure 3 highlights the increasing lack of discernible spatial details from on-the-ground photos to MODIS (500 m) resolution. 80% of the data were used for training and 20% for validation. To assess the accuracy of the classifiers, we used a Confusion Matrix. We report the full error matrix indicating the level of agreement of the derived classes and the training data [55].

Figure 3. Comparison of four remotely sensed products with different spatial resolutions moving from high (left) to low (right). Planet Scope (3 m; 1 November 2016), Sentinel-2 (10 m; 30 October 2016), Landsat-8 (30 m; 5 December 2016), MODIS (500 m; 1 November 2016). The red box highlights the location of the photographed area.
Download figure:
Standard image High-resolution image3.3. BA estimation
BA maps were derived from Sentinel-2 and Landsat-8 imagery. While Sentinel-2 was the predominant input due to the higher spatial and temporal resolution, we used Landsat-8 data when less than two cloud-free Sentinel-2 images were available per month and before January 2016 when the availability of Sentinel-2 data was inconsistent.
Four annual (2015–2019) BA maps were produced representing the fire year (FY) (August–July) for Northern Hemisphere Africa proposed by [56].
The annual BA maps were derived semi-automatically using the Burned Area Index for Sentinel-2 (BAIS2) (equation 1) to automatically map BA derived from the arithmetic difference between pre-fire BAIS2 and post-fire BAIS2 estimates [57]. A variable threshold (0.32–0.4), dependent on vegetation cover and image quality, was applied to enhance visual differentiation between burned and non-BAs. For each image pair, we started with a BAIS2 difference of 0.4 and decreased the threshold by 0.05 increments until the automated BA mask had the best balance between including all the new BA pixels and excluding the unburned areas, clouds, and shadows. The BA mask was then manually adjusted to reduce the misclassification of low severity fires. Two rounds of visual interpretation and burn scar digitizing were performed by comparing the BA mask to false-color composite Sentinel-2 (12-8A-4) and Landsat-8 (7-5-4).
Annual BA maps were compared to the BA derived from the MODIS MCD64A1 Collection 6 product [21], a publicly available BA product commonly used in fire research [24, 31, 32]. This was done to test if MCD64A1 captured the year-to-year variability. MCD64A1 provides a long time series needed to differentiate between natural and anthropogenic drivers of fire activity changes. Fire-CCI small fire dataset for 2016 (20 m) from the European Space Agency's Climate Change Initiative [58] was used to test the accuracy of our high-resolution BA maps. Since Fire-CCI covered a calendar year instead of a FY, we recalculated the annual BA map for 2016 using the calendar year to enable the comparison.
3.4. LC change and BA dynamics
We combed results from sections 3.1 and 3.3 analyzed pixel-level LC trajectories. For example, to assess if the fire was explicitly the cause of natural vegetation giving way to urban or cropland. The results from this analysis are included in section 5.1.
3.5. Population and road density analysis
To assess population dynamics, we used readily available population datasets, including the Facebook High-Resolution Population Density Map [38], Landscan [59], WorldPop [60] and the World Settlement Footprint [39]. A summary description and summary of findings are included in supplementary material (appendix C available online at stacks.iop.org/ERL/17/064019/mmedia).
Road density was calculated from hand digitizing roads from PlanetScope images for 2015 (pre), 2017 (during the establishment phase), and 2019 post-settlement establishment.
4. Results
4.1. LC in Bidi Bidi 2015–2019
LC maps for Bidi Bidi from 2015 to 2019 are shown in figure 4. The average OA was 0.9936, while the average consumers' and producers' accuracy was 0.994 and 0.979, respectively. The overall training size is shown in table 2. The producer's accuracy (the number of reference sites classified accurately divided by the total number of reference sites for that class) for all years and LC classes except for the 2019 shrub/forest class was 0.895. supplementary material (appendix B) include a detailed Confusion Matrix of LC maps by year and by class showing omission and commission errors. These results show that the highest confusion occurred between the cropland and grassland classes.
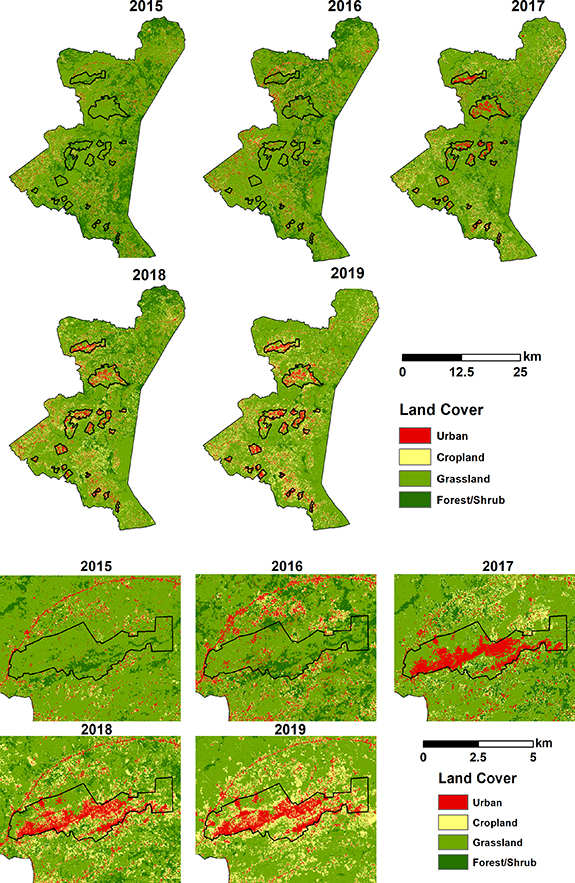
Figure 4. Top: landcover maps for Bidi Bidi refugee settlement derived at 10 m resolution from Sentinel-2 data. Refugee residential zone boundaries are denoted with black boundaries. Bottom: zoomed into Zone 2 shows the rapid expansion in built-up class in 2017 followed by the rapid expansion of cropland in 2018 and 2019.
Download figure:
Standard image High-resolution imageTable 2. Confusion matrix indicating agreement for random forests classification by class by year and overall training size.
| 2015 | 2016 | 2017 | 2018 | 2019 | |
|---|---|---|---|---|---|
| Training size | 1374 | 986 | 339 | 387 | 393 |
| Features generated | 60 748 | 30 035 | 36 454 | 63 987 | 50 970 |
| OA | 0.996 | 0.996 | 0.998 | 0.997 | 0.981 |
| Consumers accuracy | |||||
| Urban/Built-up | 0.994 | 0.984 | 0.996 | 0.997 | 0.995 |
| Cropland | 0.998 | 0.993 | 0.998 | 0.992 | 0.979 |
| Grassland | 0.996 | 0.997 | 0.998 | 0.997 | 0.977 |
| Shrub/Forest | 0.998 | 0.997 | 0.998 | 0.999 | 0.993 |
| Producer's accuracy | |||||
| Urban/Built-up | 0.974 | 0.986 | 0.998 | 0.997 | 0.998 |
| Cropland | 0.920 | 0.913 | 0.979 | 0.973 | 0.963 |
| Grassland | 1.000 | 0.999 | 0.999 | 1.000 | 0.998 |
| Shrub/Forest | 0.996 | 0.999 | 0.993 | 0.996 | 0.895 |
Figure 5 and table 3 summarize the LCLUC statistics calculated from the 10-meter product. In 2015, before the establishment of Bidi Bidi, the built-up areas accounted for 3.4%, increasing to 5% in 2016 and reaching 6.7% in 2019. Within residential zones, built-up areas rapidly increased from 1.8% (2015) to 4.5% in 2016, reaching 26% in 2017/18 and 32% in 2019. Zones 2–5 established shortly after September 2016 are not included in the 2016 map. Cropland areas stood at just 4.6% in 2015 within the larger settlement boundary and less than 0.7% within the zones, primarily concentrated to the southeast of the settlement (see figure 5). Cropland area increased to 5.4% in 2016, with a significant jump to 9.4% in 2017, 13.8% in 2018, and reached 16.9% in 2019. Within residential zones, croplands areas quickly expanded to 5.5% in 2017 from 0.7% in 2015 and reached 18.5% and 25.4% in 2018 and 2019. This rapid built-up and cropland area expansion coincided with the drastic reduction of natural vegetation from 92% (97.5% within zones) in 2015 to 76.4% (42.1% within residential zones) in 2019. Shrub/forest declined to just 7.2% in 2019, from 24.7% in 2015 and 3.1% within zones from 16.3% in 2015.

Figure 5. LC time-series 2015–2019 in the larger settlement area Bidi Bidi (a) and within designated settlement zones (b) showing a steady decrease in natural vegetation and a steady increase in the urban and agricultural classes. Natural vegetation (Nat.Veg.) includes forest/shrub and grassland.
Download figure:
Standard image High-resolution imageTable 3. LCLUC in Bidi Bidi refugee settlement showing the percentage breakdown of LC classes within the larger settlement boundary and within designated residential zones 1–5.
| Bidi Bidi | 2015 | 2016 | 2017 | 2018 | 2019 |
|---|---|---|---|---|---|
| Urban | 3.4 | 5.0 | 5.1 | 6.1 | 6.7 |
| Cropland | 4.6 | 5.4 | 9.4 | 13.8 | 16.9 |
| Grassland | 67.4 | 68.8 | 70.0 | 65.9 | 69.2 |
| Shrub/Forest | 24.7 | 20.8 | 15.6 | 14.2 | 7.2 |
| Shrub/Forest + Grassland | 92.0 | 89.6 | 85.6 | 80.1 | 76.4 |
| Within ZONES | 2015 | 2016 | 2017 | 2018 | 2019 |
| Urban | 1.8 | 4.5 | 26.0 | 26.0 | 32.6 |
| Cropland | 0.7 | 1.7 | 5.5 | 18.5 | 25.4 |
| Grassland | 81.2 | 80.6 | 62.3 | 51.1 | 39.0 |
| Shrub/Forest + Grassland | 97.5 | 93.8 | 68.5 | 55.4 | 42.1 |
4.2. Burned area (BA)
The binary BA maps (figure 6) are based on the difference between pre-and post-fire BAIS2 estimates. Results show that BA stood at 66.53% prior to the arrival of refugees during the 2015–2016 FY, reducing to 53.38% in 2016–2017 before increasing to 59.38% and 60.71% in 2017–2018 and 2018–2019 respectively in the entire settlement area (table 4 summarize the BA statistics). We suspect BA was primarily associated with grassland management by the host community that lived on and used the land for grazing. Results also show that BA exceeded 70% within areas later designated as settlement zones before their establishment (see table 3 in supplementary materials). After establishing the refugee settlements, BA drastically decreased due to the increase in emergency-related activities, including road construction. BA decreased by over 13% during FY 2016–2017, while the reduction within the settlement was even more pronounced. BA decreased by 50% within the first two zones established before the fire season in 2016 but rebounded in 2017 and 2018 outside of the settlements. However, BA within the zones slightly increased (Zone 1 and 4) or reduced even further (Zones 2, 3, and 5).
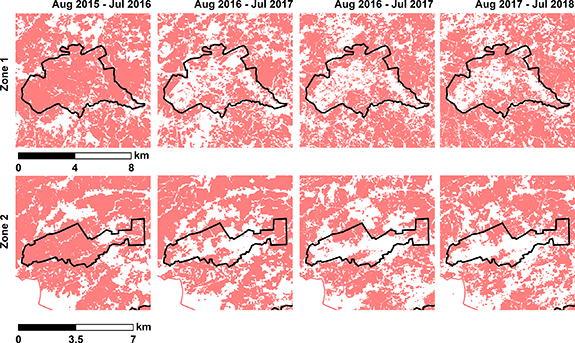
Figure 6. BA maps for Zone 1 and Zone 2 for Bidi Bidi refugee settlement derived at 30 m showing reduced BA where roads and buildings were constructed but slightly to no changes elsewhere.
Download figure:
Standard image High-resolution imageTable 4. Percentage annual BA calculated by FY (August–July) based on Sentinel-2 data.
| 2015-2016 | 2016–2017 | 2017–2018 | 2018–2019 | |
|---|---|---|---|---|
| Zone 1 | 85.47 | 45.12 | 49.11 | 50.09 |
| Zone 2 | 83.33 | 48.32 | 35.77 | 33.52 |
| Zone 3 | 76.14 | 51.56 | 45.26 | 42.27 |
| Zone 4 | 67.76 | 39.24 | 60.42 | 58.48 |
| Zone 5 | 54.85 | 45.55 | 36.92 | 28.42 |
| Outside residential zones | 66.67 | 54.05 | 60.54 | 62.18 |
| Bidi Bidi | 62.93 | 53.38 | 59.38 | 60.71 |
5. LC versus BA
By plotting BA and LC data, trends emerge, although our study period is insufficient to assess the BA/LC relationships. For example, while the BA area did not change in the larger settlement area (Bidi Bidi), we see very little BA within built-up areas, which reduced to zero by 2019. Our data show a positive relationship between BA and cropland area, which we expected since fires are often used to clear new areas for agriculture and land preparation. BA declines as the vegetated area declines within the natural vegetation (shrub and grassland combined) (figure 7). In the supplementary, appendix D we summarize how the products from this study compare with existing readily accessible global data products, including LC CCI and MCD12Q1 IGBP LC maps and Fire-CCI and MCD64A1 BA datasets. These products being the go-to for global and regional studies, we evaluate their utility for our study area's unique context.
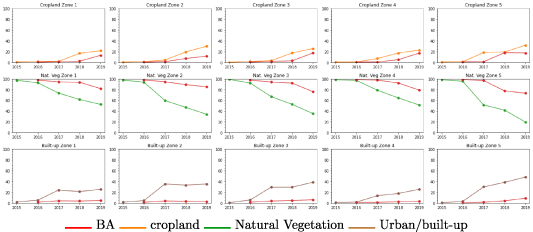
Figure 7. Percent of annual BA within specific LC classes in settlement zones 1–5. LC was estimated for a calendar year, while BA was calculated for FY (August–July). For example, FY2016 means 01 August 2015–31 July 2016.
Download figure:
Standard image High-resolution image5.1. LC change and BA dynamics
Our pixel-level assessment of BA and LCLUC showed in figure 8 confirms field observations that most of the urban conversion at the establishment of the settlement in 2017 (natural vegetation largely grassland areas to built-up) was to establish homes and roads. Built-up class expansion (transitions shown in blue) at the establishment in 2017 did not follow fire disturbance because bulldozers were used to clear areas. In 2017–2018, 2018–2019, we see more pixels converted from natural vegetation to cropland following (shown in orange). The entire settlement results are included in supplementary material (appendix E), table E1 showing the pixel-level BA and LCLUC dynamics and maps showing the transitions from year to year for the whole study area.

Figure 8. LCLUC and BA dynamics before and after the establishment of Bidi Bidi in Zone 2.
Download figure:
Standard image High-resolution image5.2. BA and road density
Most road establishments occurred between June 2016 and December 2016 with the highest increase in road density occurring in Zones 2 and 4 with approximately 1732% and 3093%, respectively, primarily shrub areas as shown in our LC results (see figure 9(a)). Roads were created rapidly with bulldozers by UNHCR.

Figure 9. Annual road density (a) and percent BA within zones in Bidi Bidi (b).
Download figure:
Standard image High-resolution image6. Discussion
Bidi Bidi experienced a drastic increase in population (July–December 2016) which led to a rapid expansion in its built-up areas (shelter for new arrivals, roads, and other infrastructure), a slight increase in cropland in the first year, followed by rapid increases in the subsequent years. This study shows a reduction in natural vegetation, making way for built-up and cropland areas, consequently decreasing fuel connectivity, likely causing the decrease in BA. However, the total BA in the larger settlement did not vary much and was close to pre-settlement levels (60%) by 2019.
Similar to precipitation, fire activity has a well-defined season. Most BA was detected right after the end of the rainy season (December–March). However, BA was detected even during the rainy season. BA reduced within the natural vegetation and became more prominent within cropland areas signifying an increased use for cropland management. Although four years is a short time to analyze trends in BA, our analysis highlights the need to develop higher resolution datasets in this context.
Except for a few main roads, Bidi Bidi was built from the ground up, leading to a substantial increase in road density and built-up area shortly after refugees arrived. Rapid cropland expansion was inevitable. All zones were fully established by the end of 2017. Other than cropland expansion, reduction of the natural vegetation during the establishment phase and shortly after can be attributed to high demand for firewood for cooking, grass for hut thatching, and livestock grazing (See figure 3).
Drastic decrease in BA after settlement establishment (2016/17 FY), particularly within residential zones, clearly illustrates rapid population growth (built-up class) and LC fragmentation on BA (see figure 9) [61]. Infrastructure development right before and immediately after the arrival of refugees decreased fire spread [62]. However, the increase in BA, both outside and within some zones, was unexpected in the two years following the settlement establishment. Moreover, BA was hardly affected by the refugees' arrival outside of the settlements. This finding contradicts a common assumption that cropland expansion reduces BA extent within cropland and surrounding areas [23]. Additionally, [62] suggested that a drastic decrease in landscape connectivity can almost eliminate fire activity in African savannas. Still, we found this was not the case for Bidi Bidi during our study period. Figure 10 provides a clear example that while an increase in road density and housing undoubtedly reduced the BA within settlements, fire activity still occurred if vegetation was present.

Figure 10. 2015 and 2017 roads and BA in Zone 1 and Zone 2.
Download figure:
Standard image High-resolution image
MCD64A1 detected less than a third of the BA extent in this study, consistent with [22] who showed that a hybrid Sentinel-2A and Landsat-8 30-m product captured more detail than the 500-m MODIS BA product, with systematically higher BA extent. Considering Bidi Bidi experienced a drastic increase in population density during our study period, which lead to a decrease in fuel connectivity, a reduction in fire size is expected [35]. The smaller the fires, the higher the probability that they will not be detected, which is especially true with cropland landscapes [36]. Additionally, we detect BA during the rainy season while no fires were detected in the MCD64A1 because most of these post-season fires are agricultural.
While global coarse-resolution products, LC CCI (300 m) and MCD12Q1 IGBP (500 m) (see supplementary appendix D), showed almost no changes within Bidi Bidi between 2015 and 2019, our LC maps depicted an overwhelming reduction of natural vegetation. The road density analysis further supports the main findings of drastic grassland conversion to built-up within settlements and cropland in neighboring areas. The lack of changes within cropland classes and a complete absence of the urban class within Bidi Bidi illustrates how small and vulnerable regions can be overlooked when datasets are developed for regional-or global-scale studies. Therefore, caution must be exercised when this data is used for local studies. Here, we demonstrate how a global BA product could severely underestimate BA, while a global LC product fails to capture the LC change, and settlements are not detected for population estimates.
7. Conclusions
This study developed 10 m resolution LC maps and 30 m BA maps for the Bidi Bidi refugee settlement in northern Uganda. This study highlights the need to map and monitor settlement scale and context-relevant dynamics in this case for humanitarian response.
LC maps are critical for planning and managing resources. More so in regions with vulnerable populations and humanitarian emergencies. High-resolution, accurate maps are needed to support decision-makers in designing programs, policies, and mitigation strategies that ensure their communities' needs are met. The maps need to be available for long-term planning and policy purposes, but most importantly, they are necessary in response to rapidly evolving crises. These resources need to be up-to-date, and in the case of smallholder systems, they must be available at the appropriate scale. Currently, the majority of openly accessible maps are created from low-to-moderate resolution imagery and do not sufficiently, if at all, detect refugee settlement LU.
Rapid changes in human population migration due to conflict can leave a lasting impact on the natural landscape. This study shows that remote sensing data cannot explain all the consequences. However, remote sensing tools remain critical for monitoring the long-term impacts of human activity on the landscape, particularly where ground data are challenging to obtain or are non-existent.
Drastic increase in population led to substantial clearing of natural vegetation in Bidi Bidi. This can compound and magnify the risks of environmental and social hazards such as soil erosion, flooding, loss of local watersheds, and biodiversity, and conflicts over LU and resource access impacting both refugees and host communities alike. Therefore, mapping and monitoring the trajectories and managing their consequences need to be integral to settlement management programs.
This study also demonstrates the importance and prevalence of fire in Northern Uganda, a savanna ecosystem, providing evidence that drastic increases in population density do not permanently eliminate fire. While sudden changes in human pressure can have an immediate effect on BA, this study supports the self-regulating fire theory, where fire suppression/exclusion leads to an accumulation of fuel, which increases the probability of fire in the future [63, 64]
Appendix C includes a summary of the limitations of readily accessible global products (LC, BA, and population). We show that while useful for monitoring global dynamics many products fall short in capturing critical details for humanitarian action and have limited utility in response planning. Therefore, it is important that the EO community work with humanitarian actors to develop contextually useful data to produce temporally and spatially appropriate products with representative training and validation data co-developed with end-users.
Finally, geographical and sector domain knowledge is required when developing information products that explain landscape changes. Firsthand knowledge of the trajectory of events in Bidi Bidi helped inform the analysis in this study and was invaluable for interpreting the results moreover a dialogue with humanitarian actors can further inform and improve the utility of datasets.
While higher resolution BA maps show a drastic improvement, 20–30 m resolution is still too coarse to accurately discern and map small agricultural fires, which are common in wooded savannas [65, 66]. Additionally, LC classification could benefit from ground truth data specifically to reduce confusion between spectrally similar classes grassland versus cropland, cropland vs urban/build-up/bare and grassland vs forest/shrub LC types. An absence of global high-resolution yearly population data limited our ability to study the direct impact of migration on land management and ecosystem services in Bidi Bidi. Therefore, we had to use changes in road density and proportion of agricultural land as proxies for anthropogenic influences.
Future work will focus on extending the time frame of this analysis to study the immediate changes in LC and BA after the arrival of refugees and understand how sustainable the current open-door policy is for both hosting and refugee communities. Moreover, extending the study area to cover additional settlements in northern Uganda and a collection of social-economic data will help quantify LCLUC on a broader scale and provide a comprehensive analysis of the social and economic impacts of these conversions.
Data availability statement
The data that support the findings of this study will be openly available following an embargo at the following URL/DOI: 10.5281/zenodo.6547884. Data will be available from 01 June 2022.
Footnotes
- 1
Oral communication with Settlement Commandant November 2016.