

Abstract
A reliable estimation of flood impacts enables meaningful flood risk management and rapid assessments of flood impacts shortly after a flood. The flood in 2021 in Central Europe and the analysis of its impacts revealed that these estimations are still inadequate. Therefore, we investigate the influence of different data sets and methods aiming to improve flood impact estimates. We estimated economic flood impacts to private households and companies for a flood event in 2013 in Germany using (a) two different flood maps, (b) two approaches to map exposed objects based on OpenStreetMap and the Basic European Asset Map, (c) two different approaches to estimate asset values, and (d) tree-based models and Stage-Damage-Functions to describe the vulnerability. At the macro scale, water masks lead to reasonable impact estimations. At the micro and meso-scale, the identification of affected objects by means of water masks is insufficient leading to unreliable estimations. The choice of exposure data sets is most influential on the estimations. We find that reliable impact estimations are feasible with reported numbers of flood-affected objects from the municipalities. We conclude that more effort should be put in the investigation of different exposure data sets and the estimation of asset values. Furthermore, we recommend the establishment of a reporting system in the municipalities for a fast identification of flood-affected objects shortly after an event.
Export citation and abstract BibTeX RIS

Original content from this work may be used under the terms of the Creative Commons Attribution 4.0 license. Any further distribution of this work must maintain attribution to the author(s) and the title of the work, journal citation and DOI.
1. Introduction
In July 2021 severe floods caused more than 40 billion Euro damage and led to more than 240 fatalities in Central Europe [1]. In the aftermath of floods the recovery phase begins including the compensation of economic impacts. The estimation of the economic impacts is usually challenging and the true extent of the impacts remains largely unclear for months after the event. Yet, accurate planning of the recovery phase requires reliable fast first order estimates of the economic impacts.
Reliable impact estimations are not only needed for fast first order estimate after events, but also for the assessment of flood risk. Flood risk is mostly described as product of hazard, exposure and vulnerability. All components of flood risk underlie changes. The change of climate changes European river floods and therefore the hazard [2]. The change of society increases exposed assets e.g. due to urbanization [3, 4]. The change of human adaptation affects societies' vulnerability to floods [5, 6]. As the components of flood risk are changing, so are the methods and data sets for its assessment. Yet, the effects of the advancements of methods and data on the impact estimations are rarely investigated. Despite the role of flood risk assessments in policy decisions on adaptation to future floods [7, 8].
Several flood inundation models have been developed for the application on different spatial scales. These scales typically extend from the local building level (micro) to the regional (meso) and national level (macro) [9]. Next to the differences in the spatial resolution, models treat protection measures like dikes or reservoirs differently as well. Most models operating up to the macro scale do not consider protection measures (e.g. PCR-GLOBWB) [10–13]. Some of the models operating from the micro to meso scale include protection measures such as levees or dams [14, 15]. Falter et al [15] use a 2D model integrated in SWIM (Soil and Water Integrated Model, [16]) which calculates maximum water depth in the hinterland in case of dike overtopping. However, a dike failure is not included. Ernst et al [14] applied the two-dimensional micro-scale flood model WOLF 2D with two different protection measure scenarios. They found high differences in the economic impacts calculated with the two different scenarios. The influence on estimates for a specific event compared to the influence of exposure and vulnerability has not been investigated by now.
The choice of data describing the exposed elements is usually scale dependent. Risk assessments on the macro-scale often use spatially redistributed GDP values, while land use based data is used from the micro to the meso scale [9]. New developments stressed the use of object based data sets such as from OpenStreetMap (OSM) [17] to enable object-based approaches [18] or the global assessment of flood risk to infrastructure [19]. These data sets can be used consistently from the micro to the macro scale and results of the first investigations are promising. A comparison of land use based and object based data sets for different sectors has not been conducted so far.
Recent developments in flood damage estimation promoted the use of various multi-variable probabilistic models [20]. These approaches range from tree-based models [21–23] over Bayesian networks [24] to Bayesian regressions [25]. The models are able to describe damage processes more detailed and to benefit more from additional data than ordinary stage-damage-functions (SDFs) [26]. This usually results in better prediction performances of these models compared to SDFs. On the downside multi-variable models also require more data regarding the input variables used by these models to estimate flood damage. Most models consider the water level as the most influential input variable. Therefore, information on the water level is usually required as a minimum input. We refer to [27] and [28] for a more in-depth review of flood damage models. The influence of the multi-variable probabilistic models on the overall risk estimates has not yet been investigated and compared to the influence of the hazard and exposure components.
However, the influence of the choice of the methods and data sets on the risk assessment are vital for their reliability and necessary for further improvements. Recent events like the flood event in Germany and Belgium in 2021 underlined the need for a reliable risk assessment and rapid impact estimations. Sensitivity analyses are carried out for single risk components revealed context-dependend influence of different factors included in hydraulic models [29, 30] or the influence of the representation of buildings on the attribution of water levels at the micro-scale [31]. Some studies found the potential of changing risk estimates with different model assumptions in the risk components [32, 33]. This study investigates the influence of different methods and data sets on the impact estimation of households and companies. This serves two purposes. Firstly, it enables the identification of ways towards reliable and fast first order impact estimations. Secondly, it points out the potential for further improvements considering the three risk components hazard, exposure and vulnerability.
2. Materials and methods
We study the role of different data sets and methods by using two variants to describe each component of flood risk. We estimate the flood impacts to private households and companies with each data and method combination for the flood 2013 in Germany [34], and validate the estimations at the spatial scale of federal states and municipalities. We use a probabilistic seamless estimation approach which provides distributions of impact estimates at any spatial scale [35]. This section gives a condensed overview. More details on the data sets and methods are given in the
2.1. Hazard—water masks
For the description of the hazard we use two flood masks giving the flood extent and magnitude. The first flood mask was specifically derived for the flood event 2013 by JBA Risk Management (www.jbarisk.com). This flood mask has a spatial resolution of 10 meter and includes protection measures like dikes. The second flood mask was put together from flood maps provided by the European Joint Research Center (JRC) [36]. This flood mask was put together based on the calculated return periods at the respective river sections which were affected during the flood in 2013 [34]. This flood mask has a spatial resolution of 100 meter and does not include protection measures like dikes. More details are given in section 'Hazard'.
2.2. Vulnerability—damage models
Two damage models estimate the direct economic impacts to private households and companies. The development of both methods is based on the same survey data sets collected in the aftermath of flood events [42–44].
Random Forests (RFs) which utilize a broader set of variables for the impact estimation including additional information on the inundation duration, the contamination and damage reducing factors as e.g. precautionary measures [38]. RF is a machine-learning algorithm which partitions a data set into smaller chunks of data points with similar response values (economic flood impacts in this case) by means of ensembles of regression trees [39]. They are commonly used for flood impact estimation in the scientific literature [21–23, 40]. We used the conditional inference tree algorithm to overcome a typical variable selection bias towards predictors with many possible splits [41].
Further we use SDFs which use only the water level as explanatory variable for the economic impacts. We chose a square-root function for the impact estimation of companies and households as this is a widely used function in Germany [37]:

Both models are applied to a set of realisations of the exposed objects resulting in distributions of possible impacts [35]. See section 'Vulnerability' for more details.
2.3. Exposure—exposed areas and objects
Two data sets support the identification of flood-affected areas and buildings. The Basic European Asset Map (BEAM) is landuse-based and contains monetary asset values per area unit [45]. OSM is voluntarily collected geographical information of buildings and infrastructure, which is more and more used in geo-risk applications [17, 19]. Buildings with an occupancy related to a commercial, educational, industrial, public and mixed use are counted as affected companies. The term companies is here therefore used as an umbrella term for buildings involved in various economic activities. See table A2 for an extensive list in the
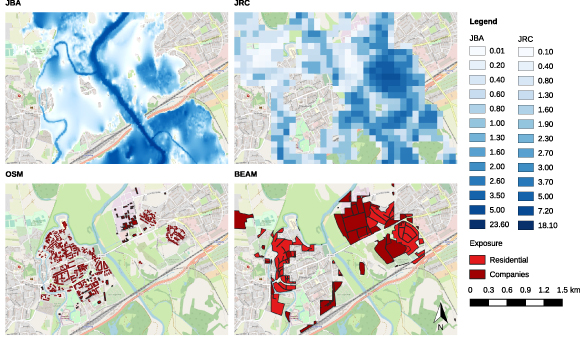
Figure 1. Maps showing the flood affected parts of Eilenburg, Saxony. The OSM data shows the buildings affected according to the JBA flood map, the Basic European Asset Map (BEAM) data shows area affected according to the JRC flood maps.
Download figure:
Standard image High-resolution image2.4. Exposure—asset scaling
The BEAM data sets include asset values, but the OSM data sets require a separated asset estimation. For this we use data sets from the national accounts and scale them down to the object level in two different ways. The first approach uses the area taken from the OSM data for whole Germany and distributes the asset values for each economic sector respectively. This approach is further referred to as area scaling. The second approach distributes the asset values based on the number of flats in a residential building or based on the number employees of a company. We refer to this approach as unit scaling.
2.5. Validation
We use rough damage reports given by federal state for a plausibility check at the federal state level [46]. We conduct a more detailed validation with in-depth reports on damage and affected objects per municipality for the federal state Saxony-Anhalt and Saxony. The continuous ranked probability score (CRPS) is a scoring rule which evaluates entire distributions, in this case of flood impact estimations. The score evaluates the sharpness and calibration of a predictive distribution and generalizes the absolute error [47, 48]. The CRPS of a given distribution for a observation yi is defined as
where  is the cumulative distribution function (CDF) of the predictive distribution
  and
and  is the indicator function. We compute the CRPS with an empirical CDF estimated from samples of
  . See [49] and [50] for details on the numerical implementation. The CRPS is calculated individually for each reported impact in the federal states and municipalities. It has the same unit as the observations, which is Euro in this case. The scores are divided by the observations to ensure their comparability across different federal states and municipalities. This means estimations evaluated with a value of one show an error exactly as high as the observation used for validation. As we use a logarithmic scale for most of the figures, values above zero indicate higher CRPS values than the observations and vice versa. The lower the CRPS values the better does the forecast perform. For the federal states the observation yi
is chosen as the middle (25%) of the range of the reported values (between 15% and 35%). For the municipalities the reported value is used as observation yi
.
. See [49] and [50] for details on the numerical implementation. The CRPS is calculated individually for each reported impact in the federal states and municipalities. It has the same unit as the observations, which is Euro in this case. The scores are divided by the observations to ensure their comparability across different federal states and municipalities. This means estimations evaluated with a value of one show an error exactly as high as the observation used for validation. As we use a logarithmic scale for most of the figures, values above zero indicate higher CRPS values than the observations and vice versa. The lower the CRPS values the better does the forecast perform. For the federal states the observation yi
is chosen as the middle (25%) of the range of the reported values (between 15% and 35%). For the municipalities the reported value is used as observation yi
.
2.6. Relative contribution of risk components
The use of different data sets and methods to describe the risk components affects the impact estimation. We compute a relative difference between impact estimates to assess the effect of the data sets and methods on the estimations. The difference is related to the range of the impact estimations of the respective spatial unit. The spatial unit can be a single building up to a federal state. The relative contribution RC of a risk component  for a spatial unit i is defined as
where x is the mode of the calculated distribution of the impact estimates. The RC is calculated similarly for all components. Consequently, a high relative contribution means that there is a lower agreement of existing methods and data sets in the respective component compared to the other components.
3. Results and discussion
Here we show the impact estimations and their validation at the spatial level of federal states (section 3.1) and municipalities (section 3.2). We further highlight the role of water masks in the identification of flood-affected areas (section 3.2.1) and analyze the asset scaling methods for OSM data sets in dependence to the spatial scale (section 3.2.2). The overall contribution of the three risk components to the impacts assessments is discussed in section 3.3.
3.1. Impact estimation and plausibility check—federal states
The impacts computed based on OSM data sets with area scaling show a systematic overestimation (figures 2(a) and (c)). These overstimations are less pronounced for estimates based on the BEAM data set. In contrast, the estimated impacts on companies based on OSM data with unit scaling show a better fit with the observed impacts than the estimates based on the BEAM data set (figure 2(d)). Estimated impacts to assets of residential objects based on OSM and unit scaling show an improved fit as well (figure 2(b)). In most cases the estimates resulting from the JBA flood maps show better agreements with reported values than those resulting from JRC flood maps. Remarkable differences between estimates from different vulnerability models are not apparent.

Figure 2. Estimated and plausible flood impacts of the flood 2013 in eight affected federal states in Germany (Bavaria, Brandenburg, Lower Saxony, Mecklenburg-Vorpommern, Saxony, Saxony-Anhalt, Schleswig-Holstein, Thuringia). Estimated impacts are calcualted with different damage models (RF (solid lines); SDFs (dashed lines)), based on different water masks (observed water mask by JBA (left); estimated water mask by JRC (right) and different exposure data sets (taken from OSM data sets (blue); taken from the BEAM (orange)). Asset estimations are based on the area area scaling (a) and (c) and the unit scaling (b) and (d).
Download figure:
Standard image High-resolution imageThe calculated CRPS values in figure 3 show the performance of the estimates in the federal states. Estimates based on OSM and area asset estimations show the highest scores and therefore the lowest performance. The performance of estimates based on OSM improves when using the unit asset estimation. Estimates based on JBA flood maps perform better than those based on JRC flood maps for residential areas and companies as well as both asset estimation approaches. The use of different vulnerability models shows only marginal effects on the performance.

Figure 3. Logarithmic CRPSs of flood impact estimations of the flood 2013 in eight affected federal states in Germany (Bavaria, Brandenburg, Lower Saxony, Mecklenburg-Vorpommern, Saxony, Saxony-Anhalt, Schleswig-Holstein, Thuringia). Estimated impacts are calculated with different damage models (RF (solid lines); SDFs (dashed lines)), based on different water masks (observed water mask by JBA (left); estimated water mask by JRC (right) and different exposure data sets (taken from OSM data sets (blue); taken from the BEAM (orange)). Asset estimations are based on the area area scaling (a) and (c) and the unit scaling (b) and (d).
Download figure:
Standard image High-resolution imageThe systematic overstimation of models using the OSM data sets with area asset scaling in combination with JRC water masks can be traced back to two possible reasons. Firstly, the overestimation could be due to a general incompleteness of the OSM data sets [51]. The incompleteness can lead to asset values per area which are too high, since asset values per area are calculated based on areas of OSM objects assigned to any of the economic sectors considered for whole Germany. The overestimation is therefore also present in area with a higher completeness of the OSM data. Allocating the asset values per employee or the number of flats leads to better results, as the data sources are seemingly more reliable. The estimates reflect this increased reliability. The completeness of the OSM data sets, however, tends to increase due to their highly dynamic growth [52]. Detailed studies on the completeness of the OSM data sets and how they evolved over time are missing but would strongly support the confidence in the validation of historic and recent events. Secondly, the larger error when using the JRC water mask in comparison to the JBA water mask (figures 3(b) and (d)) can be explained by the larger area identified (table 1). These errors can be largely reduced by using the unit asset scaling method (figures 3(b) and (d)).
Table 1. The number of residential and commercial objects and their area identified by the water masks of JBA and JRC based on the OSM and BEAM data sets for the flood event 2013. The number of objects are given in hundreds and the area is given in 100 000 sqms. Note that the values from JRC water masks are only displayed for the eight flood-affected federal states considered in this study.
| Companies | Residential | |||
|---|---|---|---|---|
Hazard  Exposure Exposure | Objects | Area | Objects | Area |
JRC  OSM OSM | 360 | 62 | 2510 | 44 |
JRC  BEAM BEAM | 48 | 112 | 75 | 111 |
JBA  OSM OSM | 90 | 18 | 1020 | 41 |
JBA  BEAM BEAM | 29 | 50 | 51 | 75 |
Companies show a higher performance with OSM objects and unit scaling compared to the BEAM data set (figure 3(d)). The performance of the estimation of impacts to residential areas based on OSM data with JRC water masks does not improve much with the altered asset scaling method (figures 2(b) and 3(b)). One reason could be that the sum of the assets estimated stay the same with both asset estimation methods. JRC flood masks cover a larger area than those from JBA and thus identify more small buildings, which add up to the a similar area (table 1). Table 1 shows that JRC and JBA identify a comparable total area of residential objects, but JRC identifies much more single objects leading to higher assets when estimated based on buildings. In general, the estimation of economic flood impacts to residential objects at the level of federal states is most accurate with JBA water mask and BEAM data sets.
Overall, the comparison reveals that using different water masks, exposure data sets and asset scaling methods can lead to large differences in estimated economic impacts and the model performance. The asset scaling method for the OSM data sets can make the difference between being inferior or superior to estimations with the BEAM data sets. In most cases BEAM data sets perform a bit better at the spatial scale of federal states than the OSM data sets. Estimations based on water masks which are specifically derived for a certain event are more plausible. Yet, water masks put together from hazard maps with a good approximation of the return periods still result in good estimates at the level of federal states. The use of different damage models does not lead to comparable differences in the estimations.
3.2. Impact estimation and validation—municipalities
Here we validate the estimations at the spatial scale of municipalities with detailed damage reports from the federal state Saxony-Anhalt and Saxony. The first section deals with water masks and the identification of flood-affected objects. The second section investigates differences due to the exposure data sets and asset scaling methods.
3.2.1. Water masks and the identification of affected objects
Figure 4 shows the identified objects based on the water masks and the number of objects reported by the municipalities in Saxony and Saxony-Anhalt. Each point reflects the reported and identified objects in a municipality. The reported and identified numbers show a strong mismatch for both residential and commercial objects in Saxony and Saxony-Anhalt. Especially the JRC water mask identifies affected objects in municipalities which have not reported to be affected and vice versa. Both water masks tend to overestimate the number of affected objects, whereby the JRC water masks identify more objects than the JBA water mask.
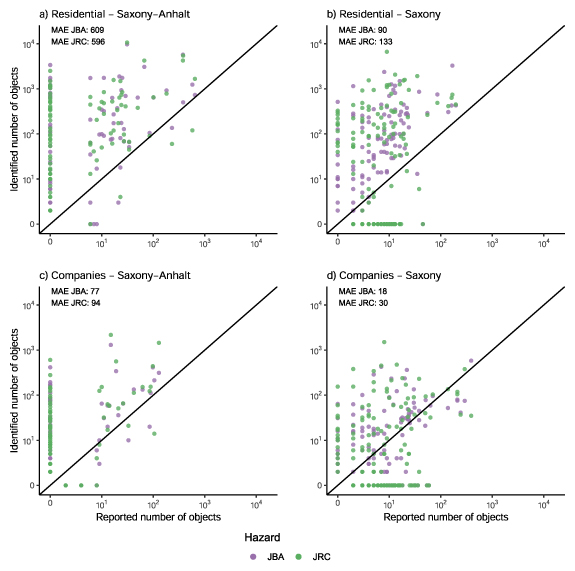
Figure 4. Number of affected objects reported per municipality and the number of objects identified by means of the water mask from JBA and JRC in Saxony-Anhalt and Saxony. In the upper left corner of the subplots the mean absolute error (MAE) is shown for the identified numbers of affected objects by the two different water masks from JBA and JRC.
Download figure:
Standard image High-resolution imageConsequently, the use water masks of JBA and JRC leads to overestimation per federal state and sector by factors between 1.6–8.5 and 3.6–10, respectively (figure 5). In absolute numbers this is an overall overestimation of 1.8 billion and 3.6 billion Euro for both federal states together. The overestimation is higher for residential areas. Model runs based on the reported number of objects tend to be lower than the reported impacts. The range of the reported impacts in Saxony reveals a large variety of possible impacts with a similar amount of affected buildings (figures 5(b) and (d)). Impacts for one building vary therefore between a few thousands up to one million Euro.
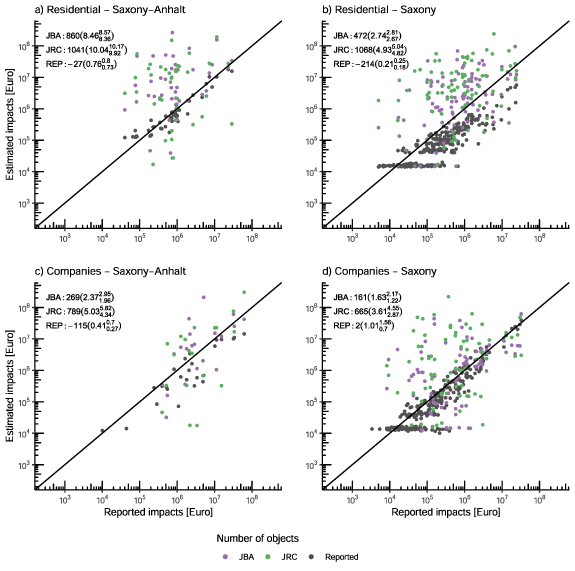
Figure 5. Estimated and reported impacts to residential and commercial objects in municipalities of Saxony and Saxony-Anhalt. The modelling approach calculates a distribution of economic impacts for each municipality. The points indicate the mode of the distribution. OSM data sets with unit asset scaling are used. In the upper left corner of the plots the overall deviation from the estimated to the reported values in million Euro for the respective federal state. The deviation of the estimates relative to the reported values is given as a factor in brackets for the mode and the 90% interval of the distributions.
Download figure:
Standard image High-resolution imageThese shortcomings in the identification of affected buildings on the spatial scale of municipalities affect the impact estimation directly. Consequently, the resulting estimates based on the identified objects have low precision and low accuracy (figure 5). The true overestimation might a bit lower than the one shown here, since the number of reported objects is prone to uncertainties as well. Not every object which has been affected by the flood might have been reported to the officials. Still, it can be assumed that the majority has been reported.
Estimations with the reported numbers have in most cases a high precision and high accuracy. Yet, even if the numbers are known, the models underestimate the reported impacts. This underestimations can hardly be attributed to different models for residential or companies since both deliver results with a lower (figures 5(a) and (d)) and a higher underestimation (figures 5(b) and (c)). Even with the uncertainties in the estimations considered there is a strong underestimation at least for the residential areas in Saxony (figure 5(b)). At the lower spatial scales, i.e. municipalities with a lower number of affected objects, the low accuracy of the estimates stand out (figures 5(b) and (d)). This shows once more the stochastic behaviour of damage processes at individual objects and the following difficulty to capture these processes reliably.
Overall, the use of water masks lead to a overestimation of economic flood impacts. This overestimation is higher for result based on JRC water mask compared to the JBA water masks. Estimations based on the reported number of affected objects per municipality underestimate the reported impacts, but are in general reliable.
3.2.2. Exposure data sets and asset scaling
The performance of the impact estimations based on OSM data is higher for residential and commercial objects in both federal states (figure 6). BEAM data sets show a higher performance for impact estimations of commercial objects than for residential objects. The differences in performance based on water levels from different water masks or resulting from different damage models is comparably low (figure 6).

Figure 6. Logarithmic CRPSs of flood impact estimations of the flood 2013 in municipalities of Saxony-Anhalt and Saxony. Estimations are based on the reported numbers of affected objects. The water masks are only used to sample the water levels. In Saxony-Anhalt 25 municipalities reported affected companies and 44 reported affected private households. In Saxony 239 municipalities reported affected companies and 260 reported affected private households. Estimated impacts are calculated with different damage models (RF (solid lines); SDFs (dashed lines)), based on different water masks (observed water mask by JBA (left); estimated water mask by JRC (right) and different exposure data sets (taken from OSM data sets (blue); taken from the BEAM (orange)). OSM asset estimations are based on the unit scaling method.
Download figure:
Standard image High-resolution imageThe unit scaling methods leads to lower CRPS values for companies in both federal states and for residential objects in Saxony-Anhalt in comparison to the area asset estimation (figures 7(a), (c) and (d)). CRPS values are getting lower with increasing number of objects. The opposite can be observed for residential objects in Saxony (figure 7(b)). Differences in the water levels from JBA and JRC are very low.
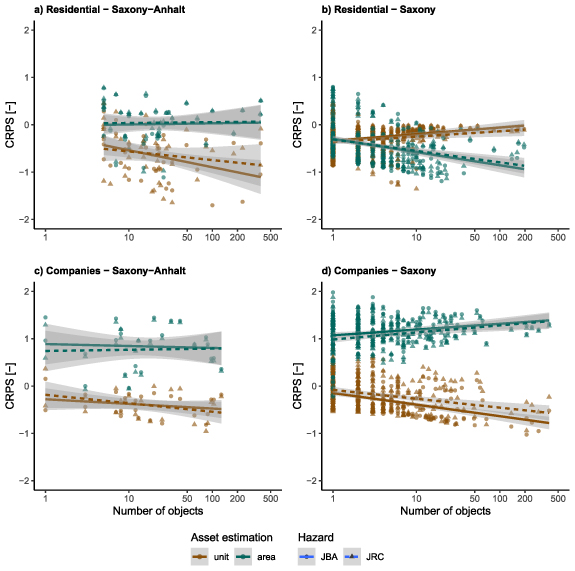
Figure 7. Logarithmic CRPSs of flood impact estimations of the flood 2013 in municipalities of Saxony-Anhalt and Saxony in dependence to the number of objects affected. In Saxony-Anhalt 25 municipalities reported affected companies and 44 reported affected private households. In Saxony 239 municipalities reported affected companies and 260 reported affected private households. Estimated impacts are calculated with RFs, based on water levels from different water masks (observed water mask by JBA (solid lines and circles); estimated water mask by JRC (dashed lines and triangles)) and affected Objects are taken from the validation data sets. Asset estimations are based on the area scaling (green) and the unit scaling method (brown). Linear models are fitted to the CRPS in dependence to the spatial scale to show the trend.
Download figure:
Standard image High-resolution imageEstimates based on OSM data sets show superior performance at the level of municipalities compared to BEAM data sets (figure 6), especially, if a reliable number of affected objects can be obtained. This is more pronounced for residential areas than for commercial objects. This can be lead back primarily to the coarser spatial resolution of the BEAM data sets making them less suitable to be used in combination with reported numbers of affected objects. The influence of water levels taken from different water masks as well as the use of different vulnerability models on the estimates is negligible.
Asset scaling based on units shows mostly a higher performance compared to the area scaling (figure 7), with the exception of the estimations for the residential areas in Saxony (figure 7(b)). Here the models underestimate the impacts severely (figure 5(b)). A big part of this underestimation is probably due to underestimated exposed assets. Using the area scaling increases the asset values (figures 2(a) and (b)) and therefore leads to more accurate estimations (figure 6(b)).
The choice of exposure data sets as well as asset scaling methods has a strong influence on the performance of the estimations. OSM data sets in combination with the unit asset scaling lead generally to the most reliable estimates for municipalities. Different water levels and damage models do not have much influence on the actual impact estimates at the spatial scale of municipalities.
3.3. Relative contribution of the risk components
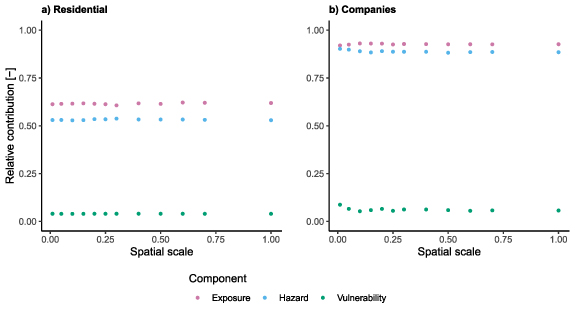
The choice of exposure data sets has the highest influence on the impact estimation for both, private households and companies (figure 8). The choice of the hazard data influences the impact estimation to a slightly lesser extent. Different vulnerability models contribute only a very small part to the difference of the impact estimation. All effects are independent of the spatial scale.
Figure 8. Relative contribution of the three risk components hazard, exposure and vulnerability to the impact estimation in dependence to the spatial scale. The spatial scale is defined as a share of all flood-affected objects identified with the chosen hazard and exposure data sets in the affected federal states. Assets for OSM data are scaled with the unit scaling method.
Download figure:
Standard image High-resolution image
The differences in estimations caused by different water levels in different water masks is not very big (figures 6 and 7). Hence the high relative contribution of the risk component hazard can be attributed to the different extents of the water masks (figure 8). Figure 3 shows the same effect. The high contribution shows the importance of flood maps showing the flood extent reliably for the assessment of recent flood events. While the influence of the extent of the floods excel the influence of different water levels for the hazard component, the exposure component is strongly influenced by the asset scaling and the exposure data sets (figures 2, 3, 6 and 7). Both aspects need to be considered, especially for the use of OSM data sets.
The high contributions of the risk components hazard and exposure show that there is high potential for improvement. Using a particular data set can influence the estimations strongly and the implications should be known for risk assessments or impact estimations. The room for improvements seem to be smaller for the component vulnerability. The low contribution also means that there is a higher agreement of existing methods and further improvements are somewhat limited in their potential to significantly improve the overall flood impacts assessments for now.
4. Conclusion
We conclude with a few recommendations regarding current flood impact assessments, further efforts in the field and for policy makers.
Current flood impact assessments should consider the following points. Water masks specifically derived for a particular flood lead to better estimations than water mask from hazard maps put together according to the appropriate return periods. Yet, the latter are still able to result in plausible estimates shortly after the floods occurrence and should still be used in case a more detailed map is not yet available. At larger spatial scales (e.g. federal states) BEAM data sets lead to plausible economic impact estimates which are on par or even excel the ones based on OSM data sets. As the spatial scales get smaller and especially with a reasonable estimate of flood-affected objects, OSM data sets with unit asset scaling lead to the most reliable calculations. Compared to the influence of hazard and exposure, the influence of different damage models is small. Regular SDFs are therefore sufficient for impact estimations.
Future efforts should therefore focus on the improvement of the description of the flood extent and the identification of flood-affected objects. In most cases it is probably sufficient to sample water levels based on distributions from existing water masks, but the flood extent must be as precise as possible. The rapid acquisition of affected areas and buildings after an event should be priority and get improved to enhance impact assessment of future floods. Flood risk assessments would also benefit from a precise description of exposed assets.
A reliable estimation is feasible solely based on the number of affected buildings. This number can hardly be identified from aerial images or water masks alone. Therefore, affected regions and municipalities should record a rough estimate of buildings affected shortly after the flood. This information enables a fast reliable estimation of economic impacts at each municipality to directly inform decision makers on recovery needs and budget planning.
Data availability statement
The data that support the findings of this study are available upon reasonable request from the authors.
The data sets of the flood events in Germany from 2005 and 2013 are available via the flood damage data base HOWAS 21 (http://howas21.gfz-potsdam.de/howas21/). All official statistic data sets for the estimation of residential and companies assets are available from the GENESIS online data base from the German Federal Statistical Office (Accession Number(s) 52111-0003, 31231-0001 and 81000-0117). All OSM data sets are available from the OSM online data base https://download.geofabrik.de/europe/germany.html. The BEAM is available at https://emergency.copernicus.eu/mapping/list-of-components/EMSN024. The flood maps from the European JRC are available at https://data.jrc.ec.europa.eu/collection/id-0054.
Appendix.: Data and methods
The appendix describes the data sets and methods used for the description of the risk components hazard (section 'Hazard'), vulnerability (section 'Vulnerability') and exposure (section 'Exposure'). Validation data sets and methods are described in section 'Impact estimation and validation'. The main analysis was done with R (version 3.6.3)—a language and environment for statistical computing [53] and the open source database PostgreSQL with the PostGIS extensions.
Appendix. Hazard
The extent and the magnitude of the hazard is described by two different water masks. The first water mask is provided by JBA Risk Management (www.jbarisk.com). This water mask was specifically derived for the flood event in 2013. The water mask takes flood defences into account and the extent is cross-checked with aerial imagery. The spatial resolution is 10 meter.
The second water mask is a product of local flood maps in Europe derived with LISFLOOD provided by the European JRC. Flood protection measures are not taken into account [36]. The spatial resolution is 100 meter. The local flood maps are provided for return periods of 10, 20, 50, 100, 200 and 500 years. The return periods of the flood maps are chosen according to the respective return periods calculated for the corresponding river sections during the flood event 2013 [34]. The resulting local flood maps are then merged to a water mask depicting the flood event in Germany in 2013.
Appendix. Vulnerability
The vulnerability is described by two different models. The first approach to model vulnerability is the use of RFs, the second is the estimation by means of SDFs. Both approaches use survey data sets collected after major flood events in Germany [42–44].
The RFs make use of several input variables to estimate the impacts shown in table A1. From the RFs we derive impact distributions conditioned on the input variables following the algorithm described in [54]. These distributions reflect the probabilities of possible flood impacts based on the input data base. This study makes only use of the possible impacts with the highest probability instead of using the whole distribution. The package 'party' (version 1.2) was used to compute the RFs [55]. The models for company flood damage are described in detail in [38] and [35].
Table A1. Variables used in the tree-based impact models for companies and residential areas.
| Company variables | Residential variables | Data source | Distribution | |
|---|---|---|---|---|
| Flood impact | ||||
| Water level | Water level | — | — | |
| Inundation duration | Inundation duration | Survey | Gamma | |
| Contamination | Contamination | Survey | Multinomial | |
| Damage reduction | ||||
| Adaptation ratio | Precaution indicator | Survey | Multinomial | |
| Mitigation ratio | Survey | Multinomial | ||
| Emergency indicator | Survey | Multinomial | ||
| Other | ||||
| Number of employees | Floor space | Official statistics | Gamma | |
| Business premises | Survey and | Multinomial | ||
| official statistics |
Here we additionally implement the estimation of impacts to buildings and contents of private households. The model development for the households is analogous to the company models, however, the input variables differ (table A1). The relevant variables were preselected according to previous studies [20, 56]. Hence, individual damage models are used for the four different economic sector groups (1) manufacturing, (2) commercial, (3) financial and (4) service formed according to the European statistical classification of economic activities in the European Community (NACE Rev. 2; Nomenclature statistique des Activites economiques dans la Communaute Europenne) [58] as well as (5) residential use. In total, ten different RFs were built according to the conditional inference tree algorithm of [41] for the respective sector groups as well as two different types of assets buildings and equipment/contents.
The SDFs use only the water level as explanatory variable for the estimation of the flood damage. We chose a square-root function for the impact estimation of companies and households [37].

This is a typically used SDF in Germany which was also applied in former studies [20, 21, 59].
Both models are applied to a set of realisations of exposed objects (similar to [35] and [18]). For each exposed residential object 300 realisations are sampled to reflect the missing knowledge about variables like the inundation duration, contamination, precaution and the exact flood space. 500 realisations are sampled per affected company due to the higher heterogeneity of companies compared to private households. The samples are taken from distributions which are derived from surveys of past events and from the official statistics. Note that the water level was not sampled but taken directly from the location of the objects within the water masks. The data sources and the used distributions are listed in table A1.
Appendix. Exposure
The estimation of economic impacts is done for companies and private households. Here the term companies serves more as an umbrella term of the following economic activities which we divided into four sectors following NACE Rev. 2 (Nomenclature statistique des Activites economiques dans la Communaute Europenne) according to the European statistical classification of economic activities in the European Community [58]: the manufacturing sector (Mining and Quarrying, Manufacturing, Electricity, Gas, Steam, and Air Conditioning Supply, Water Supply; Sewerage, Waste Management and Remediation Activities, Construction; NACE classes B-F), the commercial sector (Wholesale and Retail Trade; Repair of Motor Vehicles and Motorcycles, Transportation and Storage, Accommodation and Food Service Activities; NACE classes G-I), the financial sector (Information and Communication, Financial and Insurance Activities, Real Estate Activities, Professional, Scientific and Technical Activities, Administrative and Support Service Activities; NACE classes J-N), and the service sector (Public Administration and Defence; Compulsory Social Security, Education, Human Health and Social Work Activities, Arts, Entertainment and Recreation, other Service Activities; NACE classes O-S).
The exposed areas and buildings and their asset values are based on the OSM data set and the BEAM. The OSM data set is composed by individual buildings mapped by citizens. The data set version we used dates back to the year 2018. We assumed this as a sweetspot between more complete mapping status without having to many buildings which have been built in the time between 2013 and 2018. We used two approaches for the estimation and distribution of asset values of companies and residential buildings identified from OSM data. Both approaches take net asset values from the national accounts (VGR des Bundes) from the year 2013. The data is available via the GENESIS online data base (www-genesis.destatis.de/genesis/online/). The first approach distributes the asset values based on the area calculated from the OSM data. That is the net assets from the perspective sector for whole Germany are divided by the squaremeters of all buildings identified as any of the economic sectors. For residential objects the areas reported in GENESIS table 31 231-0001 are taken. Asset values in Euro per sqm of the contents of residential buildings are taken from [57]. Paprotny et al [57] use OSM and publicly available data from e.g. Eurostat and national statistical institutes (e.g. the German Federal Statistical Office) for the estimations. The resulting values are then applied to flood affected buildings to calculate their assets. We refer to this as the area scaling approach. The second approach uses the number of employees following the approach described in [35]. Residential assets are calculated and distributed based on the number of flats in a residential building. Net assets of the respective sector are divided by the living area in whole Germany taken from GENESIS online data base (table 31 231-0001). Based on these statistics the number of flats and consequently square meters affected are sampled. We refer to this as the unit scaling approach. Table A2 shows the resulting asset values per area and per unit for the different economic sectors.
Table A2. Asset values for OSM objects. The area values are given in Euro per sqm. The unit values are Euro per employee for the companies and Euro per flats for the residential objects.
| Buildings | Content | ||||
|---|---|---|---|---|---|
| Code | Economic sector | Area | Unit | Area | Unit |
| WZ08-C | Manufacturing | 815 | 17 603 | 630 | 45 015 |
| WZ08-D | Electricity, gas, steam | ||||
| and air conditioning supply | 815 | 507 813 | 630 | 181 578 | |
| WZ08-E | Water supply; sewerage; waste | ||||
| management and remediation activities | 815 | 1 019 157 | 630 | 75 130 | |
| WZ08-F | Construction | 815 | 9262 | 630 | 9947 |
| WZ08-G | Wholesale and retail trade; repair | ||||
| of motor vehicles and motorcycles | 2894 | 22 700 | 1480 | 10 808 | |
| WZ08-H | Transporting and storage | 2894 | 124 760 | 1480 | 69 098 |
| WZ08-I | Accommodation and | ||||
| food service activities | 2894 | 20 631 | 1480 | 6990 | |
| WZ08-J | Information and communication | 14 136 | 30 539 | 16 576 | 37 158 |
| WZ08-K | Financial and insurance activities | 14 136 | 108 040 | 16 576 | 8732 |
| WZ08-M | Professional, scientific and | ||||
| technical activities | 14 136 | 23 804 | 16 576 | 11 919 | |
| WZ08-N | Administrative and | ||||
| support service activities | 14 136 | 12 843 | 16 576 | 76 014 | |
| WZ08-P | Education | 5635 | 106 796 | 1073 | 7608 |
| WZ08-Q | Human health and | ||||
| social work activities | 5635 | 64 100 | 1073 | 15 225 | |
| WZ08-R | Arts, entertainment and recreation | 5635 | 22 825 | 1073 | 18 492 |
| WZ08-S | Other services activities | 5635 | 29 787 | 1073 | 9303 |
| WZ08-L | Real estate activities | ||||
| Residential with 1 flat | 1350 | 172 800 | 386 | 49 408 | |
| Residential with 2 flats | 1350 | 128 250 | 386 | 36 670 | |
| Residential with 3 and more flats | 1350 | 93 150 | 386 | 26 634 | |
| Dormitories | 1350 | 72 900 | 386 | 20 844 | |
The BEAM data set uses enhanced CORINE land use data [45]. The enhancement uses data from the Urban Atlas (a Copernicus land monitoring service) to increase the spatial resolution in urban areas. The BEAM data set also contains monetary asset values per area unit. The values are derived by socio-economic statistics from the EUROSTAT database. The data set provides values for residential areas as well as for areas of industry, service and trade.
Appendix. Impact estimation and validation
We estimate economic flood impacts with different methods and data sets for a flood event in Germany in 2013. During this event eight federal states in Germany were affected, namely Bavaria, Brandenburg, Lower Saxony, Mecklenburg-Vorpommern, Saxony, Saxony-Anhalt, Schleswig-Holstein, Thuringia. The impacts are estimated at the building level following the method described in [35]. The results are distributions of impact estimates which can be aggregated to any spatial unit (from individual buildings up to countries). These distributions reflect the broad range of individual specifications of characteristics of company and residential buildings (described by the input variables and the asset values), which are usually not fully known. The ranges are covered by sampling possible characteristics of an object from distributions taken from official statistics, survey data and the water masks. The estimations in the figures are modes taken form these distributions.
We validate the results with two different data sets on the level of federal states and the municipal level. Firstly, we use damage reports per federal state as benchmarks [46]. The reports show overall damage jointly for the sectors private households, the industrial and commercial sector, agriculture and forestry as well as state and municipal infrastructure. The share of the individual sectors is only available for the federal states Bavaria and Saxony. The range between the shares of the two federal states is 15% and 35% for the industrial and commercial sector and 20% and 35% for private households. These ranges are applied to the reported overall damage of the other federal states.
Secondly, we use data sets obtained by the ministries of Saxony and Saxony-Anhalt. These data sets contain the number of households and companies which applied for reconstruction assistance and the amount of the overall loss reported per municipality. Note, that the values of both data sets are also prone to uncertainties. Especially the values per federal state can only give an idea of which damage value ranges are plausible. The values per municipality in Saxony and Saxony-Anhalt are likely to be more reliable, but can still deviate from the true flood damage.