

Abstract
Few studies have used empirical evidence of past adaptation to project temperature-related excess mortality under climate change. Here, we assess adaptation in future projections of temperature-related excess mortality by employing evidence of shifting minimum mortality temperatures (MMTs) concurrent with climate warming of recent decades. The study is based on daily non-external mortality and daily mean temperature time-series from 11 Spanish cities covering four decades (1978–2017). It employs distributed lag non-linear models (DLNMs) to describe temperature-mortality associations, and multivariate mixed-effect meta-regression models to derive city- and subperiod-specific MMTs, and subsequently MMT associations with climatic indicators. We use temperature projections for one low- and one high-emission scenario (ssp126, ssp370) derived from five global climate models. Our results show that MMTs have closely tracked mean summer temperatures (MSTs) over time and space, with meta-regression models suggesting that the MMTs increased by 0.73 °C (95%CI: 0.65, 0.80) per 1 °C rise in MST over time, and by 0.84 °C (95%CI: 0.76, 0.92) per 1 °C rise in MST across cities. Future projections, which include adaptation by shifting MMTs according to observed temporal changes, result in 63.5% (95%CI: 50.0, 81.2) lower heat-related excess mortality, 63.7% (95%CI: 30.2, 166.7) higher cold-related excess mortality, and 11.2% (95%CI: −5.5, 39.5) lower total temperature-related excess mortality in the 2090s for ssp370 compared to estimates that do not account for adaptation. For ssp126, assumptions on adaptation have a comparatively small impact on excess mortality estimates. Elucidating the adaptive capacities of societies can motivate strengthened efforts to implement specific adaptation measures directed at reducing heat stress under climate change.
Export citation and abstract BibTeX RIS

Original content from this work may be used under the terms of the Creative Commons Attribution 4.0 license. Any further distribution of this work must maintain attribution to the author(s) and the title of the work, journal citation and DOI.
1. Introduction
Excess mortality associated with non-optimal temperatures have been documented across the world, together with a pronounced capacity of the populations to adapt to their local climate (Burkart et al 2021, Zhao et al 2021). One often used measure of this adaptation is the minimum mortality temperature (MMT), at which the temperature-attributable mortality risk is lowest. There is ample evidence from many regions of the world that the MMT is the higher the warmer the local climate, as exemplified by large cross-sectional studies finding positive associations between location-specific MMT and climate indicators, such as the annual mean temperature, most frequent temperature, or mean summer temperature (Guo et al 2014, Yin et al 2019, Tobías et al 2021).
Fewer studies have investigated changes in the MMT over time, generally finding increasing MMTs over recent decades (Todd and Valleron 2015, Åström et al 2016, Chung et al 2018, Achebak et al 2019, Folkerts et al 2020, Follos et al 2021). Rising MMTs have been paralleled with increasing ambient temperatures in most locations, but not all studies found a significant relationship between experienced shifts in the local climate and observed temporal changes in the MMT (Todd and Valleron 2015, Chung et al 2018, Achebak et al 2019).
Better understanding the temporal pace of adaptation is imperative in the context of climate change (Davis et al 2003, Bobb et al 2014, Kinney 2018), and will help to reduce the enormous adaptation uncertainty affecting currently available projections of temperature-related excess mortality (Gosling et al 2017). In fact, due to this large uncertainty on adaptation, many studies estimating temperature-related excess mortality under climate change scenarios have so far ignored adaptation (Gasparrini et al 2017, Weinberger et al 2017, Vicedo-Cabrera et al 2018, Huber et al 2020). The majority of studies which do consider adaptation have taken the approach of shifting the MMT (sometimes also referred to as optimal temperature), changing the slope of the temperature-mortality association, or combining these two approaches (Gosling et al 2017). Partly because of the sparsity of long-term mortality time-series, few of these studies have actually used empirical evidence to inform the magnitude of change assumed in the employed adaptation scenarios (notable exceptions are (Muthers et al 2010, Petkova et al 2017, Carleton et al 2018, Wang et al 2018, Lay et al 2021). A common approach for constructing adaptation scenarios has also been to place the MMT at a constant percentile of the temperature distribution (Honda et al 2014, Sanchez Martinez et al 2018, Díaz et al 2019), although the available empirical evidence from longitudinal studies that would support this approach is limited.
Here, we use a long-term dataset of daily non-external mortality and mean temperature records for 11 cities in Spain to explore the temporal and spatial variability of the MMT over four decades and to evaluate longitudinal and cross-sectional associations of the MMT with the mean summer temperature (MST). Subsequently, we apply the found MMT-MST associations to account for adaptation in future projections of temperature-related excess mortality based on two different climate change scenarios (ssp126, ssp370), using data from five global climate models. To the best of our knowledge, we are the first to undertake a comprehensive assessment of historical changes in the MMT related to past warming in order to inform scenarios of future adaptation to heat. Our study employs advanced methods based on distributed lag non-linear models (DLNMs) (Gasparrini 2014) to estimate temperature-mortality associations, and recently developed mixed-effect meta-regression techniques (Sera et al 2019) to obtain stable estimates of MMTs, and to explore associations of MMTs with climatic indicators.
2. Methods
2.1. Mortality and temperature data
Data on daily non-external mortality (ICD-9: 0-799; ICD-10: A00-R99) for 11 Spanish capital cities in the period 1978–2017 were provided by the Spanish National Institute of Statistics (see figure S1 for a map indicating city locations available in the supplementary online material at stacks.iop.org/ERL/17/044075/mmedia). Detailed information on the data collection methodology is given in INE (2013). Among the most populated cities in Spain, we selected those with time series of daily mean temperature covering the longest time period. There were no missing values in the mortality time series selected. Data of daily mean temperatures from a representative weather station in each city, corresponding to the average of maximum and minimum daily temperatures, were provided by the Spanish National Meteorology Agency (see table S1 for more information on selected weather stations). None of the temperature series had more than 0.3% of missing values (table S1). Mean summer temperatures (MSTs) were computed from the daily data as June-July-August averages.
Projections of daily mean temperature were derived from global climate model (GCM) simulations carried out in the Scenario Model Intercomparison Project (ScenarioMIP; O'Neill et al 2016) that was part of the 6th phase of the Coupled Model Intercomparison Project (CMIP6; Eyring et al 2016). The data used here comprises future simulations covering 2015–2100 from 5 GCMs (GFDL-ESM4, IPSL-CM6A-LR, MPI-ESM1-2 h, MRI-ESM2-0, UKESM1-0-LL). We considered one low-emission scenario (ssp126) and one high-emission scenario (ssp370). To avoid deviation between observed and simulated historical temperature distributions, the temperature time series were bias-adjusted using the available weather station data, employing a method developed for the third phase of the Inter-Sectoral Impact Model Intercomparison Project (ISIMIP3; Lange 2019, Lange 2021). This method is a parametric quantile-mapping method that preserves the projected temperature trends in all distribution quantiles. For the mapping, the daily mean temperature values were assumed to follow a normal distribution with seasonally dependent mean value and standard deviation.
2.2. Statistical analysis
The statistical analysis consisted of 3 stages. First, we divided the data (1978–2017) into 8 non-overlapping 5-y subperiods. For each city and each period, we fitted a quasi-Poisson regression model using distributed lag non-linear models (DLNMs) to represent the complex temperature-mortality associations. Specifications of the models were adopted from previous studies, showing their suitability for projections of temperature-related mortality (Gasparrini et al 2017, Vicedo-Cabrera et al 2019, Huber et al 2020). Specifically, we used natural cubic splines for both the exposure-response and lag-response curves, with three internal knots placed at the 10th, 75th and 90th percentile and equally spaced in the log-space, respectively. Lags of up to 21 d were accounted for. The model also included an indicator for the day of the week, and we used a natural cubic spline of time with 7 degrees of freedom per year to control for seasonal and long-term trends. We undertook a sensitivity analysis altering the specifications of the models (see table S2 for a description of the alternative modelling choices). We also tested other temporal subdivisions of the data, namely using five 8-y subperiods and four 10-y subperiods, respectively, and repeating the analysis based on 5-y subperiods for 1978–1997 and 1998–2017, separately (table S3).
In the second stage, we combined the reduced model coefficients from the first stage, describing the overall cumulative exposure-response curves in each city and each subperiod, with a multivariate meta-regression model (Sera et al 2019, 2020). This meta-regression model included an intercept only and one random-effect term at city-level. We chose not to include any meta-predictors at this stage to avoid spurious correlation in the subsequent analysis of possible association between climatic indicators and the minimum mortality temperature percentiles (MMTPs) and minimum mortality temperatures (MMTs). MMTPs and MMTs were derived based on best linear unbiased predictors (BLUPs) from the intercept-only meta-regression model, and the city- and subperiod-specific temperature distributions. We chose to use BLUPs to determine MMTPs and MMTs, because estimates based on first-stage model coefficients were unreliable due to the small sample sizes resulting from 5-y subperiods. Following (Tobías et al 2017), we used Monte Carlo simulations (n = 5000) to empirically estimate 95% confidence intervals and variances of the MMTP and MMT estimates. We restricted the searching of the MMTP to the 70th to the 99th percentiles for more robust estimates, given that for some cities and some subperiods the cumulative exposure-response curves showed two distinct minima in the lower and higher temperature range. This restriction was widened to the 1st to 99th percentiles in the sensitivity analysis. Excess mortality estimates (attributable numbers and fractions) by observational subperiod and city were computed based on BLUPs and MMTs using the forward approach described by (Gasparrini and Leone 2014).
The third stage consisted of a mixed-effect meta-regression, pooling MMT estimates for each city i and subperiod p from the previous stage. Given prior evidence on the role of mean summer temperatures (MST) in explaining adaptive processes regarding vulnerability to non-optimal temperatures (Todd and Valleron 2015, Wang et al 2018) we focused our analysis on potential associations of MMT with MST. This choice also makes sense conceptually because the MMT usually falls in the upper range of the temperature distribution (Gasparrini et al 2015), corresponding to the summer season. In order to separate longitudinal (i.e. intra-city) variability from cross-sectional (i.e. inter-city) variability we adopted a Cronbach decomposition (Cronbach and Webb 1975) with the following formula:
where  are mean summer temperatures for city i and subperiod p centred on the city mean (i.e. city-specific averages across subperiods) and
  the city means centred on the overall mean, which are included as fixed-effect predictors. The random terms
  represent the city effect on the estimates and they are assumed to follow a normal distribution
  , where
  is the between cities variance term. The cities random terms allow to consider possible non-independence of the multiple MMTs and MMTPs estimated over the different periods in each city. We assumed
  , where
  is the estimation error of MMT for each city and subperiod, computed as the variance of MMTs from the Monte Carlo simulations in the second stage of the analysis. We fitted the same type of meta-regression model to the city- and subperiod-specific MMTP estimates. Heterogeneity was assessed using the I2 statistics. In a supplementary analysis, we used centred mean annual temperatures instead of centred MST as meta-predictors.
2.3. Future projections
For future projections of MMTs and excess mortality, we used the last of the observational subperiods as a baseline, i.e. using estimated BLUPs, MMTs, observed temperatures and death counts from 2013 to 2017. First, for each city i, 5-y subperiod p over 2016–2100, GCM g and climate scenario s, we computed the projected minimum mortality temperatures  based on the projected mean summer temperatures
  with the following equation:
where  is taken from equation (1). We repeated these computations for the lower and upper value defining the 95% CI of
  to account for uncertainty in the observed MMT-MST association. The rationale of choosing
  here was that we meant to capture short-term adaptative processes, rather than the long-term adaptation reflected by the cross-sectional MMT-MST association (i.e.
  in equation (1).
In the next step, we computed daily attributable numbers based on projected temperatures in subsequent 5-y periods over 2016–2100, without adaptation (i.e. constant MMTs) and with adaptation (i.e. shifting MMTs). All of these computations were based on the overall cumulative exposure-response functions of the last observational subperiod (2013–2017), and used the average of daily death counts per day of the year from the same period to construct 5-y series of daily projected mortality. The approach taken to account for changing future MMTs in the computation of attributable mortality was to shift projected daily mean temperatures,  , for each GCM g and each climate scenario s, by the difference between projected and observed MMTs in each future 5-y period p, according to:

This is equivalent to re-centring the exposure-response functions on the projected MMTs, but easier to implement computationally. Under the assumption of no adaptation, we set 
 , thus simply using the projected temperature series.
The computations of daily attributable numbers, based on either  (with adaptation) or
  (without adaptation) then followed the usual approach for the projection of temperature-related excess mortality (Vicedo-Cabrera et al
2019). We summed daily attributable numbers in defined 5-y periods, and specified 10-y time slices (2030s, 2050s, 2090s), separating components due to heat and cold by summing the subsets corresponding to days with
(without adaptation) then followed the usual approach for the projection of temperature-related excess mortality (Vicedo-Cabrera et al
2019). We summed daily attributable numbers in defined 5-y periods, and specified 10-y time slices (2030s, 2050s, 2090s), separating components due to heat and cold by summing the subsets corresponding to days with  (
( ) higher or lower than
  . Attributable fractions were computed by dividing the resulting sums by the total number of projected deaths in the respective periods.
Uncertainties in attributable mortality was assessed by drawing Monte Carlo samples (n = 1000) from the multivariate normal distribution defined by the BLUPs and the corresponding co-variance matrices. In projections, this procedure was repeated for each scenario, GCM and, under the assumption of adaptation, each estimate of projected MMTs (central, low, high). Uncertainties are reported in terms of empirical 95% confidence intervals, which were estimated based on the 2.5th and 97.5th percentile of the resulting samples.
All computations were done using R (version 4.0.0) with packages dlnm and mixmeta. The code is available on request from the first author.
3. Results
3.1. Temperature-mortality associations by city and subperiod
Our dataset from 11 cities in Spain included more than 3 million deaths registered over 1978–2017 (table 1). It spanned a range of summer climates with average MST of 19.6 °C (range: 18.9, 20.2) in the coolest city (Valladolid) and 27.1 °C (range: 25.6, 28.3) in the hottest city (Sevilla). On average across cities summers warmed by approximately 2 °C between the first and the last of the considered 5-y subperiods, exceeding the warming observed in annual mean temperatures (table 1).
Table 1. Descriptive statistics and attributable fractions by city, based on 8 non-overlapping 5-y periods covering 1978–2017.
| City | Total deaths | Mean annual temperature (°C) | Mean summer temperature (°C) | Average attributable fractions (%) (95% CI) | ||||
|---|---|---|---|---|---|---|---|---|
| Mean (min, max) | ΔTa | Mean (min, max) | ΔTa | Total | Cold | Heat | ||
| Alicante | 93 501 | 18.3 (17.8, 19.2) | 1.3 | 24.9 (24.1, 25.8) | 1.7 | 7.2 (5.0, 9.3) | 6.6 (4.2, 9.0) | 0.6 (0.2, 0.9) |
| Barcelona | 643 884 | 16.2 (15.3, 17.4) | 2.0 | 23.2 (21.7, 24.7) | 2.9 | 7.1 (5.3, 8.7) | 6.4 (4.4, 8.2) | 0.7 (0.4, 1.0) |
| Bilbao | 137 647 | 14.7 (14.1, 15.2) | 1.1 | 19.9 (18.6, 21.0) | 2.0 | 6.7 (4.6, 8.6) | 6.2 (3.9, 8.3) | 0.5 (0.3, 0.7) |
| Madrid | 1 011 140 | 14.6 (14.0, 15.5) | 1.4 | 24.0 (23.0, 25.2) | 2.3 | 6.5 (4.6, 8.2) | 5.4 (3.4, 7.3) | 1.0 (0.7, 1.3) |
| Malaga | 166 989 | 18.6 (17.9, 19.5) | 1.7 | 25.0 (23.7, 26.1) | 2.2 | 6.2 (4.1, 8.2) | 5.4 (3.1, 7.7) | 0.7 (0.4, 1.0) |
| Murcia | 103 647 | 18.3 (17.9, 19.2) | 1.2 | 26.1 (25.3, 27.0) | 1.6 | 7.4 (4.9, 9.5) | 6.8 (4.1, 9.2) | 0.6 (0.2, 1.0) |
| Palma de Mallorca | 112 071 | 16.6 (15.8, 17.5) | 1.7 | 23.9 (22.7, 24.9) | 2.2 | 7.7 (5.4, 9.6) | 7.1 (4.5, 9.3) | 0.6 (0.2, 1.0) |
| Sevilla | 223 709 | 19.2 (18.3, 19.9) | 1.4 | 27.1 (25.6, 28.3) | 1.9 | 5.2 (3.4, 6.9) | 3.9 (1.8, 5.8) | 1.4 (1.0, 1.7) |
| Valencia | 276 575 | 17.6 (17.1, 18.2) | 1.0 | 24.7 (23.6, 25.4) | 1.7 | 7.2 (5.2, 9.1) | 6.7 (4.6, 8.7) | 0.5 (0.2, 0.7) |
| Valladolid | 95 373 | 11.5 (11.1, 11.8) | 0.6 | 19.6 (18.9, 20.2) | 1.2 | 5.5 (3.4, 7.6) | 4.6 (2.1, 7.0) | 1.0 (0.6, 1.3) |
| Zaragoza | 211 923 | 15.6 (14.8, 16.4) | 1.6 | 24.3 (22.9, 25.3) | 2.4 | 6.8 (4.5, 8.8) | 5.9 (3.4, 8.1) | 0.9 (0.5, 1.2) |
| All cities | 3 076 459 | 16.5 (15.9, 17.2) | 1.4 | 23.9 (22.8, 24.8) | 2.0 | 6.7 (4.9, 8.2) | 5.8 (3.9, 7.5) | 0.9 (0.6, 1.0) |
a Difference between last (2013–2017) and first 5-y (1978–1982) averages.
The intercept-only meta-regression model used to derive BLUPs of the overall cumulative temperature-mortality associations (figure 1) suggested some heterogeneity across cities and subperiods (I2 = 52.4%). Yet, apart from changes in the MMT, the shape of the city-specific associations remained quite similar between different subperiods (figure 1). In particular, we did not find any temporal trends in the RRs at low and high temperatures in the relative percentile scale (figure S2). The average attributable fraction aggregated across cities during 1978–2017 was 6.7% (95%CI: 4.9,8.2), with 5.8% (95%CI: 3.9,7.5) attributable to low temperatures, and 0.9% (95%CI: 0.6,1.0) attributable to high temperatures (table 1). City-specific attributable fractions (figure S3) as well as pooled attributable fractions (figure 3) varied by subperiods but did not show any consistent temporal trends over the historical study period.
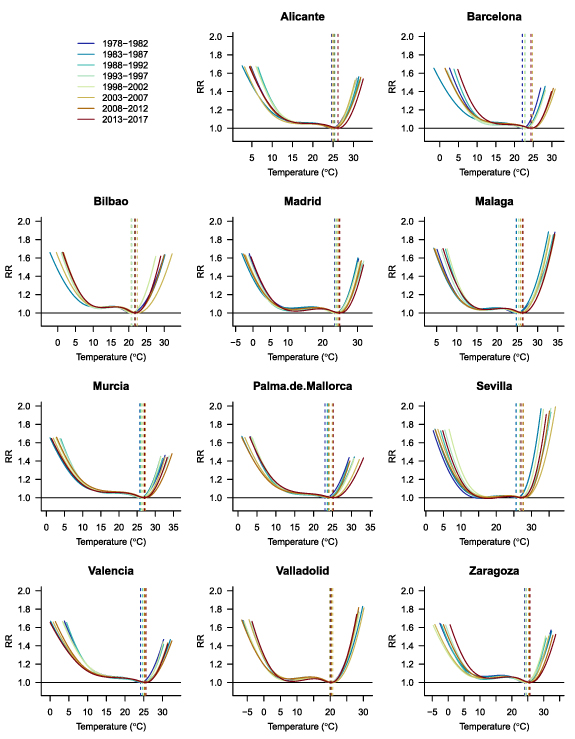
Figure 1. Period-specific cumulative temperature-mortality associations by city, based on best linear unbiased predictors (BLUPs) from random-effect longitudinal meta-regression model. Dashed lines show the minimum mortality temperatures (MMTs) for each time period. For a better representation of temporal changes in MMTs see also figure 2 (dashed black lines) and figures S5 and S7.
Download figure:
Standard image High-resolution imageCity-specific MMTs increased over time in parallel with MSTs (figure 2 solid and dashed black lines, table S4). The corresponding MMTPs ranged between the 89th and 97th percentile of the subperiod-specific daily mean temperature distributions (figure S4 and table S4). Widening the percentile range for searching of the MMTP only affected the estimates in one of the cities (Sevilla, figure S4).
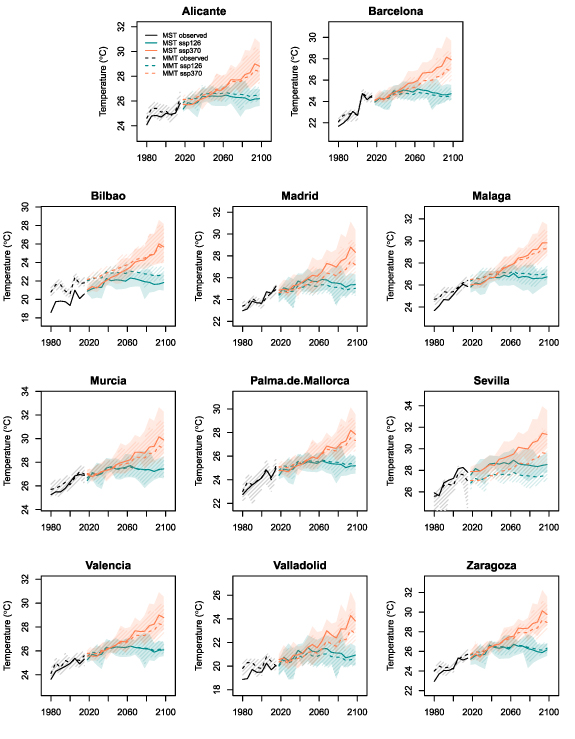
Figure 2. Mean summer temperatures (MST) (solid lines) and minimum mortality temperatures (MMT) (dashed lines), based on observations (black) and future projections (GCM-ensemble means) for climate change scenarios ssp126 (green) and ssp370 (orange). Shading corresponds to 95% empirical CIs, considering uncertainties in exposure-response functions, and for projections also GCM differences and uncertainties in the MMT-MST associations.
Download figure:
Standard image High-resolution imageThe Cronbach-type meta-regression models suggested that MMTs increased by 0.73 °C (95% CI: 0.65, 0.80) per 1 °C longitudinal (i.e. temporal) increase in the MST, and 0.84 °C (95% CI: 0.76, 0.92) per 1 °C cross-sectional (i.e. spatial) increase in the MST (table 2). For MMTP, the model indicated small decreases on the order of <1 percentile point per 1 °C increase in the MST (table 2).
Table 2. Longitudinal and cross-sectional associations between the minimum mortality temperature (MMT) and the MMT percentile (MMTP) with the mean summer temperature (MST), from Cronbach-type mixed-effect meta-regression models. For comparison, the I2 statistics of the intercept-only model are reported.

|

| |||||||
|---|---|---|---|---|---|---|---|---|
| βx | 95% CI | p-value | I2 | βx | 95% CI | p-value | I2 | |
| Intercept-only | 97.6% | 67.5% | ||||||
| Cronbach-type | 43.5% | 53.1% | ||||||
| 0.73 | (0.65, 0.80) | <0.001 | −0.75 | (−1.11, −0.40) | <0.001 | ||
| 0.84 | (0.76, 0.92) | <0.001 | −0.55 | (−0.96, −0.15) | <0.01 | ||
The sensitivity analysis showed that period-specific estimates of MMTs and MMTPs changed slightly according to specifications of the model for temperature-mortality associations (figures S5 and S6). However, coefficients of the meta-regression models describing the longitudinal and cross-sectional associations of the MMT with the MST, which we used to define adaptation in future projections, were relatively robust against changes in these model specifications (table S2). When testing alternative temporal subdivisions of the data, MMT and MMTP estimates generally fell within the 95% CIs of the default estimates (figures S7 and S8). Results from the Cronbach-type meta-regression model for MMT-MST associations were very similar to the default results, except when basing the analysis on the last 20 years rather than the full 40-y period (table S3). For MMTP, results were more strongly dependent on the choice of subperiods. Yet, with only a few exceptions, coefficients suggested a negative association of the MMTP with MST similar to our main analysis (table S3).
3.2. Future projections
Increases in projected decadal averages of the MST above the last observational decade (2008–2017) did not exceed 1 °C in the low-emission scenario ssp126 (figure 2 and table 3). By contrast, in the high-emission scenario ssp370, the MST averaged across cities was projected to increase by 1.6 °C (range: 0.9, 3.9) in the 2050s and by 3.9 °C (range: 2.6, 6.0) in the 2090s relative to 2008–2017 (figure 2 and table 3). The annual average temperature increase was projected to be only slightly lower (table 3).
Table 3. GCM-ensemble mean projected warming, attributable fractions (%) and relative difference with vs. without adaptation (%), by climate change scenario, aggregated across cities.
| ssp126 | ssp370 | |||||
|---|---|---|---|---|---|---|
| 2030s | 2050s | 2090s | 2030s | 2050s | 2090s | |
| Temperature anomaly a (°C) (min, max) | ||||||
| Mean annual temperature | 0.5 (0.0, 1.1) | 0.8 (0.4, 1.4) | 0.7 (0.1, 1.8) | 0.7 (0.2, 1.2) | 1.4 (0.9, 2.4) | 3.3 (2.1, 5.3) |
| Mean summer temperature | 0.7 (−0.2, 1.4) | 1.0 (0.3, 1.6) | 0.7 (0.3, 1.7) | 0.7 (0.2, 1.6) | 1.6 (0.9, 3.0) | 3.9 (2.6, 6.1) |
| Attributable fraction without adaptation (%) (95% CI) | ||||||
| Total | 6.8 (5.0, 8.5) | 6.5 (4.7, 8.1) | 6.3 (4.4, 8.2) | 6.5 (4.7, 8.1) | 6.5 (4.7, 8.1) | 8.2 (5.6, 11.6) |
| Cold | 5.6 (3.7, 7.4) | 5.2 (3.3, 6.9) | 5.2 (3.0, 7.3) | 5.3 (3.3, 7.2) | 4.6 (2.7, 6.4) | 3.4 (1.5, 5.3) |
| Heat | 1.2 (0.5, 1.8) | 1.3 (0.7, 2.2) | 1.1 (0.6, 1.8) | 1.2 (0.7, 2.0) | 1.9 (1.1, 3.5) | 4.8 (2.4, 9.0) |
| Attributable fraction with adaptation (%) (95% CI) | ||||||
| Total | 6.9 (4.9, 8.7) | 6.7 (4.7, 8.4) | 6.3 (4.4, 8.2) | 6.6 (4.7, 8.3) | 6.6 (4.8, 8.3) | 7.1 (5.3, 8.8) |
| Cold | 5.9 (3.9, 7.9) | 5.7 (3.7, 7.5) | 5.5 (3.5, 7.4) | 5.6 (3.6, 7.4) | 5.5 (3.6, 7.2) | 5.5 (3.6, 7.3) |
| Heat | 0.9 (0.6, 1.3) | 1.0 (0.7, 1.3) | 0.9 (0.6, 1.2) | 1.0 (0.7, 1.3) | 1.1 (0.8, 1.6) | 1.6 (1.0, 2.7) |
| Relative difference with versus without adaptation (%) (95% CI) | ||||||
| Total | 1.2 (−5.3, 5.3) | 1.9 (−1.1, 5.9) | 0.6 (−1.2, 4.2) | 1.2 (−1.0, 5.6) | 1.9 (−5.1, 5.8) | −11.2 (−39.5, 5.5) |
| Cold | 6.0 (−8.4, 20.5) | 9.8 (−1.2, 25.5) | 5.7 (−1.5, 26.5) | 5.5 (−1.9, 23.8) | 20.7 (7.6, 60.3) | 63.7 (30.2, 166.7) |
| Heat | −14.8 (−40.5, 21.6) | −23.5 (−44.6, −0.1) | −15.5 (−51.7, 2.6) | −13.4 (−42.7, 5.0) | −36.9 (−64.1, −21.3) | −63.5 (−81.2, −50.0) |
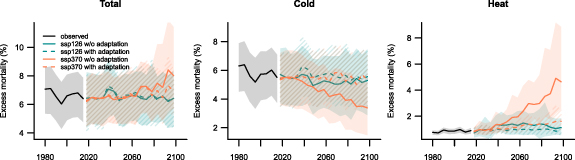
Without adaptation, future heat-related excess mortality for all cities combined was projected to increase, reaching 1.9% (95%CI: 1.1, 3.5) by the 2050s and 4.8% (95%CI: 2.4, 9.0) by the 2090s under the high-emission scenario ssp370 (figure 3 and table 3). Under the same scenario, cold-related excess mortality was projected to decrease to 4.6% (95%CI: 2.7, 6.4) by the 2050s and 3.4% (95%CI: 1.5, 5.3) by the 2090s (figure 3 and table 3). Total temperature-related excess mortality was estimated to change little until mid-century and then to increase to 8.2% (95%CI: 5.6, 11.6) by the 2090s. Under the low-emission scenario ssp126, without adaptation, attributable fractions were estimated to stay within the ranges observed over 1978–2017, except for a relatively small projected increase in heat-related excess mortality by the 2050s (figure 3 and table 3).
Figure 3. Projected (GCM-ensemble mean) total, cold-related, and heat-related excess mortality aggregated across all cities, for ssp126 (green) and ssp370 (orange), without adaptation (solid lines), and with adaptation (dashed lines). Black lines show estimated excess mortalities over the observational period (1978–2017). Shaded areas show 95% empirical CIs, based on uncertainties in the temperature-mortality associations, GCM uncertainties, and uncertainties in the MMT-MST association.
Download figure:
Standard image High-resolution image
Assuming adaptation according to past MMT shifts (figure 2) strongly impacted the projected aggregated excess mortality under ssp370. Heat attributable fractions were 36.9% (95%CI: 21.3, 64.1) lower by the 2050s and 63.5% (95%CI: 50.0, 81.2) lower by the 2090s with adaptation relative to the estimates without adaptation (figure 3 and table 3). Cold attributable fractions were 20.7% (95%CI: 7.6, 60.3) higher by the 2050s and 63.7% (95%CI: 30.2, 166.7) higher by the 2090s. The relative percent differences with and without adaptation for total temperature-related excess mortality were comparatively small, with the confidence interval even for the 2090s estimate (−11.2%; 95%CI: −39.5, 5.5) including zero (figure 3 and table 3). Under ssp126, assuming adaptation in projections changed excess mortality estimates compared to projections without adaptation in the same direction as for ssp370 (figure 3). However, the magnitudes of these changes were small, and all confidence intervals included zero (table 3). For the 2030s, estimates of attributable fractions were very similar between low and high-emission scenarios, and adaptation assumptions had minor effects in both scenarios (figure 3 and table 3). City-specific results were qualitatively the same as results for all cities combined (figures S9–S11).
4. Discussion
Here, we studied the variability of the MMT across space and time in 11 Spanish cities over four decades to inform adaptation scenarios in future projections of temperature-related excess mortality. We found positive associations of the MMT with MST, both geographically and temporally. Projections of temperature-related excess mortality that included future shifts in MMTs according to future projected summer warming suggested that, if the pace of adaptation observed over past decades was maintained in the future, a large portion of the possible additional heat mortality burden could be avoided. Reversely, cold-related excess mortality would not decrease as much as estimated under the assumption of no adaptation. Overall, the impact of adaptation assumptions on excess-mortality estimates was much stronger for the high-emission scenario ssp370 than for the low-emission scenario ssp126.
Our results on the geographical MMT-MST associations agree with previously published findings. In a global study including data from 41 countries, (Tobías et al 2021) found that the MMT increased 0.8 °C (and the MMTP decreased 0.8 percentile points) per 1 °C increase in the annual mean temperature. In another global-scale study, (Yin et al 2019) reported an increase of 0.7 °C in the MMT per 1 °C increase in the most frequent temperature. Both alternative temperature indicators are closely correlated with MST in our dataset (annual mean temperature: r = 0.87, p < 0.001; most frequent temperature: r = 0.72, p < 0.001). Based on geographically highly resolved data from France, (Todd and Valleron 2015) reported an increase of 0.76 °C in the MMT per 1 °C increase in the MST, which is very close to the 0.84 °C rise in MMT per 1 °C cross-sectional increase in MST found here.
The same authors also investigated the temporal variability in MMT as a function of MST, finding an increase of approximately 0.4 °C in the MMT per 1 °C increase in MST over time (between 1968–1981 and 1996–2009). Our estimate of the temporal MMT-MST association is higher (0.76 °C rise in MMT per 1 °C temporal increase in the MST), and only slightly lower than our estimate for the spatial association. Therefore, our findings do not support the conclusion by (Todd and Valleron 2015) regarding the lag in adaptive processes over time compared to longer-term adaptation as reflected in the spatial MMT-MST relationship. This is in accordance with another study on sex and age-specific cardiovascular mortality in Spain (Achebak et al 2019), which reported positive associations between mean annual temperatures and the MMT of similar magnitude across space (48 provinces) and time (23 overlapping subperiods). Surprisingly, a study from Japan (Chung et al 2018) also found increases in MMTs over four decades, but none of the considered associations with climate indicators were significant. More studies on this topic are warranted, given that the velocity of past adaptive processes is crucial for evaluating the potential of adaptation to changing temperatures under future climate change.
Our projections of temperature-related mortality assuming no adaptation were in accordance with recent studies that did not account for adaptation. As in our study, e.g. the estimates by Martínez-Solanas et al (2021) for Europe suggested that increases in heat-attributable mortality are likely to overcompensate decreases in cold-related mortality in the second half of the 21st century, especially under high-emission scenarios. Our projections also qualitatively agree with the results for Southern Europe (Italy and Spain) presented by Gasparrini et al (2017), although the net increases in temperature-related mortality found in this study under the high-emission scenario were larger than reported here. The difference might be due to the older climate change scenarios used (RCP8.5), and the application of time-invariant exposure-response functions estimated from Spanish data covering 1990–2014.
Similar to our findings, previous studies suggested that adaptive processes have the potential to mitigate large portions of the changes in temperature-related mortality projected by studies that ignore adaptation. For example, Lay et al (2021) estimated that for a 2 °C global warming scenario, temperature-related mortalities in the US were 97% lower when assuming recently observed vulnerabilities compared to earlier vulnerabilities. Wang et al (2018) reported that incorporating empirically estimated adaptation into projections resulted in little change in the projected heat wave-related mortality in the US compared to present-day, in accordance with our findings. These authors modelled adaptation by including interactions with MSTs in the regression equations for heat-wave related mortality. Interestingly, in our supplementary analysis, annual mean temperatures as meta-predictors explained less of the heterogeneity of MMTs across periods and cities than MSTs (table S5).
Our results can also be used to evaluate previous projections that have included adaptation by setting future MMTPs to constant values estimated from observed data (Honda et al 2014, Sanchez Martinez et al 2018, Díaz et al 2019). Our results suggest that MMTPs have decreased slightly over the past four decades in Spain while the climate has warmed. Thus, holding the MMTP constant to mimic adaptation in future projection overestimates the pace of observed adaptation. However, given that the MMTPs would decrease only by a few percentile points even under high-emission scenarios according to the associations estimated in our study, this overestimation should be small. The major unknown is whether the pace of adaptation observed in the past can be maintained in the future. This is less questionable for the low-emission scenario ssp126, which implies additional summer warming of <1 °C according to our analysis, than for the high-emission scenario ssp370, which would bring about additional summer warming about twice as large of what was observed over the four decades studied here. Searching for empirical evidence on potential limits to adaptation (such as e.g. found in Wang et al 2018, Lay et al 2021), in this case related to past shifts in MMTs, would be an interesting avenue for future research.
A number of limitations of our study need to be mentioned. First, our results do not shed light on the possible adaptive mechanisms underlying the found correlations of the MMT with MSTs. Additional analyses should attempt to enlarge the number of meta-predictors included in the meta-regression models. Unfortunately, we did not have access to information on, e.g. air conditioning prevalence, urban green coverage, and heat-health action plan effectiveness, which could be related to actual mechanisms of heat adaptation. Second, by imposing a linear relationship between MMT and MST we assume no future limits to adaptation. Yet, there is evidence that at least some of the past shifts in temperature-mortality associations can be related to increasing prevalence of residential air conditioning in Spain (Sera et al 2020), which could ultimately reach the clearly defined limit of 100% prevalence. This suggests that the MST-MMT relationship would at a certain point level off, in contrast to our assumptions. Third, our projections heavily rely on the ability of the GCMs considered in realistically projecting future temperatures, including the extremes of the distributions. Interestingly, our data shows that average summer warming was stronger than average annual warming during recent decades in the Spanish cities studied here. This difference between summer and annual warming is not as clear in the GCM projections, suggesting that the considered GCMs might underestimate summer warming trends in Southern Europe, which has also been suggested by (Van Oldenborgh et al 2009). Fourth, our study was restricted to analysing non-external mortality. Studying temperature-related respiratory mortality in Spain, (Achebak et al 2020) reported a shift in seasonality, related to a discontinuous drop in the MMT over 1980–2016. It is conceivable that similar changes in cause-specific mortality are the reason for the two distinct minima that we observed in some of the exposure-response curves.
5. Conclusion
We have found here that the MMTs in Spanish cities have increased in parallel with rising MSTs over recent decades, at a surprisingly rapid pace, similar to what is suggested by geographical MMT-MST associations. We projected temperature-related excess mortality under low- and high-emission scenarios, incorporating adaptation by shifting future MMTs according to observed associations with MSTs. Our findings showed that future adaptation at the pace registered during past decades would avoid a large proportion of the changes in temperature-related excess mortality expected under the assumption of no adaptation, especially under high-emission scenarios. Future research needs to identify the physiological, infrastructural and behavioural factors underlying the observed shifts in the MMTs, in order to inform specific adaptation policies and measures. Our findings also show that the risks in terms of increased death burden associated with a possible failure to adapt are smallest under the low-emission scenario. To avert major health risk from climate change, international efforts to reduce greenhouse gas emissions are thus indispensable, besides strengthened investment in adaptation.
Acknowledgments
We thank Aleš Urban and two anonymous referees for helpful comments on previous versions of the manuscript.
Data availability statement
The data that support the findings of this study are available upon reasonable request from the authors.
Conflict of interest
The authors declare that they have nothing to disclose.
Funding information
This work received funding from the Spanish Ministry of Economy, Industry and Competitiveness (Grant ID: PCIN-2017-046), the German Research Foundation (DFG, Project No.: 427397136), the German Federal Ministry of Education and Research (BMBF, Grant ID: 01LP1907A), and the European Union's Horizon 2020 research and innovation programme (Marie Skłodowska-Curie Grant Agreement No.: 101032087).