

Abstract
Understanding population exposure to precipitation-related extreme events is important for effective climate change adaptation and mitigation measures. We analyze extreme precipitation using indices (EPIs), including consecutive dry days (CDD), annual total precipitation, simple daily intensity, and the number of extremely wet days, under the past and future climatic conditions over East Africa. The exposure of the East African population to these extreme events at 1.5 °C and 2.0 °C global warming levels (GWLs) is analyzed based on Climate Model Intercomparison Project phase 6 models. Exposure is computed from extremely wet and dry days (R95p and CDD, respectively). Under both GWLs, EPIs (except CDD) averaged over East Africa are projected to increase under the Shared Socio-economic Pathways (SSP)2-4.5 and SSP5-8.5 scenarios. The largest increase in wet events will likely occur in eastern and northern Kenya. The results also reveal an intensification of precipitation extremes over Burundi, Rwanda, and some parts of Uganda. However, small changes are expected over most parts of Kenya and Tanzania. Examination of population exposure to EPIs shows that the most prominent and net intense occurrence is over Burundi, Rwanda, and some parts of Uganda. In contrast, less change is noted to occur over vast parts of Kenya and Tanzania. Meanwhile, limiting the warming target to less than 1.5 °C but not more than 2.0 °C has 37% (44.2%) and 92% (4%) less impact on the occurrence of EPIs for R95p (CDD) under SSP2-4.5 (SSP5-8.5) scenarios, respectively. The study establishes that future exposure is predominantly driven by changes in population compared to other factors such as climate or concurrent changes in climate and population (the nonlinear interaction effect). For instance, climate effects are anticipated to contribute ∼10.6% (12.6%) of the total change in population exposure under 1.5 °C (2.0 °C) warming levels, while population and interaction effects are expected to contribute ∼77.4% (71.9%) and 12% (15.5%), respectively, under 1.5 °C (2.0 °C) scenarios. Interestingly, the projected changes in regional exposure due to the interaction effects under SSP2-4.5 are greater than the climate effect, while the reverse pattern is observed under SSP5-8.5. For example, under SSP5-8.5, climate effects for 1.5 °C and 2.0 °C are larger (after population effect) with ∼3.8 × 10⁵ (15.7%) and ∼6.1 × 10⁵ (17.5%) billion person-mm, respectively. The high exposure noted over East Africa calls for a shift in policies to instate suitable adaptation measures to cushion the already vulnerable population.
Export citation and abstract BibTeX RIS

Original content from this work may be used under the terms of the Creative Commons Attribution 4.0 license. Any further distribution of this work must maintain attribution to the author(s) and the title of the work, journal citation and DOI.
1. Introduction
The world is warming due to human-caused greenhouse gas emissions, resulting in substantial regional climate changes (IPCC 2021). The latest Intergovernmental Panel on Climate Change (IPCC) report, the 6th Assessment Report (AR6), revealed that the occurrence of climate extremes is linked to the observed increase in global mean surface air temperature (IPCC 2021). The increase in temperature intensifies surface evaporation that raises the water content in the atmosphere and increases the probability of extreme precipitation events in some regions (Pfahl et al 2017). Extreme precipitation is associated with devastating socio-economic impacts on agriculture, transport, and other climate-dependent sectors (IPCC 2014). It is projected that the frequency and intensity of extreme events will increase with the rise in global mean surface temperature (GMST) (IPCC 2014, 2021, Westra et al 2014, Dosio and Fischer 2018, Madakumbura et al 2019, Chen et al 2020, Lim Kan Sian et al 2021).
Many studies have investigated the variability of past and future climate extremes across Africa's sub-regions. For instance, Kendon et al (2019) projected an increase in mean and extreme precipitation across most parts of Africa using the convection-permitting (4.5 km grid-spacing) model. East Africa (EA) is prone and vulnerable to the impacts of climate extremes. The livelihood of the region's population is mainly dependent on rain-fed agriculture. Unfortunately, the rainfall over the region exhibits high spatio-temporal variability. Recent studies have reported a decrease in rainfall over the region since 1999 (Ongoma and Chen 2017, Ayugi et al 2018, 2021c, Mumo et al 2019, Ngoma et al 2021a), compounding the impact of weather and climate hazards on the fast-growing local population. Observed and projected trends in precipitation or temperature extremes over EA region have been noted in recent studies (i.e. Shongwe et al 2011, Omondi et al 2014, Cattaini et al 2018, Ayugi et al 2021a). For instance, a study by Cattani et al (2018) noted an overall increasing trend during the October to December (OND) season for PRCPTOT, R1mm, and SDII over eastern EA, with the exception of Kenya. On the other hand, Gebrechorkos et al (2019) remarked that most precipitation indices showed increasing and decreasing trends in Ethiopia, Kenya, and Tanzania, but no general pattern was observed. However, recent studies (Ongoma et al 2018, Ayugi et al 2021a) that examined the projected changes in rainfall over the region reported varying findings. To illustrate, Ongoma et al (2018) projected an increase in very wet and extreme very wet days over the region during the mid and end of the 21st century. According to related studies (Ogega et al 2020, Ayugi et al 2021a), there is a projected increase in precipitation intensity and heavy precipitation events over EA. Furthermore, Dosio et al (2019, 2021) showed that both global and regional models agree on a projected increase in precipitation intensity and daily maximum precipitation amount over EA. The same findings were recently reported by Luhunga and Songoro (2020) in a study that focused on extreme climatic events over the Lake Victoria region. These findings over EA are supported by recent studies that employed regional climate models from the coordinated regional climate downscaling experiment framework (Nikulin et al 2018, Osima et al 2018, Dosio et al 2019, Ogega et al 2020, Ayugi et al 2020, Onyutha 2020, Tan et al 2020, Tegegne et al 2021).
There is a need for studies to understand the future changes in climate extremes and the associated impacts, and very importantly, to quantify the implications of limiting global warming levels (GWLs) to 1.5 °C. Understanding the period of occurrence of the extremes and the spatial coverage is important since the two are necessary for quantifying future vulnerability and risk of climate disasters from which effective climate change adaptation and mitigation measures can be devised.
Globally, Liu et al (2020) projected that approximately 30% of the global population (2.97 billion people) will be exposed to precipitation extremes at least 10 d yr−1 under the Representative Concentration Pathway (RCP)8.5‐SSP3 scenario by the middle of this century (2046–2065). The study observed the need for more attention on Asia and Africa due to their rapid population and gross domestic product (GDP) growth, in agreement with Chen et al (2020), since socio-economic effects play a significant role in the changes in exposure at both global and continental scales. Chen et al (2020) projected a global increase in population exposure of 2.3% following an increase in surface air temperature to 2.0 °C. Zhao et al (2021) reported that extreme precipitation events and population exposure are projected to increase with warming levels over the Indus River Basin. Marengo et al (2021) studied extreme rainfall and hydro-geo-meteorological disaster risk in 1.5 °C, 2.0 °C, and 4.0 °C global warming scenarios: an analysis for Brazil. The projections showed that densely populated areas are the most exposed to landslides and floods. They further noted that the exposure was projected to persist and aggravate for warming above 2.0 °C. The observations by Marengo et al (2021) agreed with the findings of Zhang et al (2018) over monsoon regions where it was projected that 0.5 °C less warming would reduce the risk of population exposure to once-in-20 year extreme precipitation events by 22%–46%. Over China, Chen and Sun (2020) and Wang et al (2020) projected an increase in exposure of about 21.6% under the RCP4.5-SSP2 scenario by the end of the 21st century, despite a projected decline in population, thus stressing the need to address GHG emissions as efforts to minimize exposure to precipitation extremes. Similar findings were reported by other researchers (Wang et al 2020, Ma and Yuan 2021).
Across Africa, Weber et al (2020) projected an increase in the population size exposed to climate extremes under RCP8.5-SSP3 by 47‐folds, compared to the present day. The study further showed that the interaction between climate and population growth is the major factor influencing changes in exposure at the end of the century. The aforementioned study agreed with the findings of Rohat et al (2019) that explored future exposure to dangerous heat, driven by climatic and demographic changes across 173 large African cities. The study noted an increase of 20–52 times, reaching 86–217 billion persons-days per year by the 2090s, depending on the scenario (Rohat et al 2019).
The Climate Model Intercomparison Project phase 6 (CMIP6; Eyring et al 2016) presents the prospects for advancing our understanding of climate change impacts resulting from compounded global warming. Relevant stakeholders urgently need accurate and reliable evidence that will enable them to deal with pertinent issues such as those that pinpoint the exact tendencies of historical changes, the magnitude of the shift, future changes, and population exposure. However, there is still insufficient information on the projections of EA precipitation extremes under the CMIP6 radiative forcings and their possible impact on the local population. To the best of our knowledge, this study is the first to investigate the population's exposure to extreme precipitation at 1.5 °C and 2 °C warming levels across EA using CMIP6 models under shared socio-economic pathways (SSP2-4.5 and SSP5-8.5). These SSP-based scenarios consist of a set of baseline scenarios, which describe future developments in the absence of climate change or new climate policies beyond those in place today, as well as mitigation scenarios that explore the implications of climate change mitigation policies applied to the baseline scenarios (O'Neill et al 2017). The outcome of this research is important in understanding the impacts of precipitation extremes. Thus, we aim to address the following questions in this study: (a) to what extent could the exposure to the precipitation extremes over EA be avoided if the GWLs increase is limited to 1.5° compared to other temperature increases? And (b) what are the roles of climate and population changes on the exposure?
2. Data methods
2.1. Data
The study utilizes historical and future precipitation and surface air temperature datasets from 26 CMIP6 models (Eyring et al 2016). The datasets cover two time slices: 1850–2014 and 2015–2100 for historical and future periods, respectively. The comparison analysis is conducted relative to the baseline period given in the AR6: 1995–2014. The SSP2-4.5 and SSP5-8.5 scenarios that represent modest mitigation and worst-case scenarios are utilized in the study. The SSP2-4.5 scenario is considered a more plausible outcome where modest mitigation implementation will curb global warming to ∼2.5 °C warming relative to the pre-industrial period by the end of the 21st century (O'Neill et al 2017). On the other hand, SSP5-8.5, also referred to as 'business as usual', represents a fossil-fuel intensive future, void of stringent climate mitigation, leading to nearly 5 °C of warming by the end of the century. The choice of the two radiative forcing scenarios from the available five possible frameworks is informed based on the assumption that differences in climate outcomes from the different scenarios for the same global pathways are likely small relative to varying regional climate features or/and inter-model uncertainties (O'Neill et al 2017). The first realization ensemble is considered in the study to allow equal comparable analysis, except for a few GCMs having the first variation member as r1i1p1f2 or r1i1p1f3. Table S1 (available online at stacks.iop.org/ERL/17/044051/mmedia) shows the first ensemble member of models employed in the study, their country of origin, and native resolutions.
The estimation of population changes is established using projections obtained from SSPs scenarios (Jones and O'Neill 2016). The socio-economic datasets are sourced from the Inter-Sectoral Impact Model Intercomparsion Project framework (Warszawski et al 2014). The SSPs for projected population are available at a global scale on 50 × 50 km grid-level. Given the varying grid resolution for models and observed datasets, re-gridding is performed at 1° × 1° using a bilinear interpolation technique. Jones (1999) recommends using bilinear interpolation when re-gridding from coarser to finer resolution, while a conservative technique can be employed when re-gridding from finer to coarser resolution. For consistency, this study combines the population under SSP2 and SSP5 with CMIP6 models under both scenarios to estimate population exposure correspondingly. Liu et al (2020) employed a similar approach.
2.2. Methods
2.2.1. Timings of the 1.5 °C and 2 °C warming targets
This study uses the warming thresholds of 1.5 °C and 2.0 °C relative to pre-industrial levels. It should be noted that the 1.5 °C and 2 °C GWLs are extracted from the SSPs that focus on rapid (transient) cases and not quasi-stabilized climate states (Rogelj et al 2018), since there is a difference in climate between rapid warming and stabilized climate states (Rugenstein et al 2019, King et al 2020). The time of the specified thresholds is defined as the first year when the 21 year running mean of the GMST reaches 1.5 °C and 2 °C relative to preindustrial levels. To determine a relatively stable climatology, two 10 year periods around the specific threshold are compared with the reference period based on annual mean temperature datasets to assess the changes in EPIs as used in previous studies (e.g. Shi et al 2018, Fu et al 2018, Wang et al 2020, Zhao et al 2021). All precipitation indices are thus computed using a 20 year mean period to determine the warming levels at 1.5 °C and 2.0 °C. Table S2 shows the timing of 1.5 °C and 2 °C global warming above pre-industrial levels under SSP2-4.5 and SSP5-8.5.
2.2.2. Extreme precipitation indices and estimates of avoided impacts
The study employs five precipitation indices defined by the expert team on climate change detection and indices. The summary of the indices used in this study is presented in table 1. Each index represents different categories of precipitation occurrences, such as precipitation intensity, duration, and frequency. They include the duration of dry days (CDD), the simple daily intensity (SDII), very heavy precipitation (>20 mm) days greater (R20mm), extremely wet days (R95p), and annual total precipitation (PRCPTOT). Zhang et al (2011) provide details on the climate indices used for examining the impacts of climate change. The reliability of the climate indices has been affirmed in numerous studies across various regions (Akinsanola et al 2020, 2021, Dike et al 2020, Zhu and Yang 2020, Ayugi et al 2021b). To assess how the precipitation indices differ between future and reference period, the climatological mean difference was computed and the Student t-test for unequal variances was performed to evaluate their statistical significance at the 95% confidence level. In order to ascertain the possible scenario of avoiding the impacts of higher warming at 2.0 °C above pre-industrial levels, the avoided impacts (AI) caused by additional 0.5 °C warming is computed from equation (1);
Table 1. Names, abbreviations, definitions, and units of climate indices used in the study.
| Category | Description | Acronym | Unit |
|---|---|---|---|
| Duration indices | Consecutive dry days | CDD | day |
| Percentile-based index | Extremely wet days | R95p | mm |
| Threshold-based index | Heavy precipitation days | R20mm | days |
| Intensity-based index | Wet-day intensity | SDII | mm d−1 |
| Annual precipitation total | Wet-day precipitation amount | PRCPTOT | mm |
where GW2.0 and GW1.5 denote the change in 1.5 °C and 2.0 °C warming, respectively, relative to the present baseline. A similar approach has been used in other recent studies (e.g. Chen et al 2020, Wang et al 2020).
2.2.3. Exposure to extreme precipitation
In the present study, population exposure (PE) is defined as the number of people exposed to R95p or CDD (Jones et al
2015, Liu et al
2017, Coffel et al
2018, Zhao et al
2021). The R95p (CDD) represents the prevalence of flood (drought) extremes that can affect the region (Kilavi et al
2018, Ongoma et al
2018, Haile et al
2020, Tan et al
2020, Wainwright et al
2020). The PE for R95p is measured in person.mm while CDD is computed in person.day. The study adopts 20 year averages for precipitation extremes and population to reduce the inter-annual variations (Chen et al
2020). Population exposure to EPIs is estimated by multiplying the annual frequency of extreme precipitation events (i.e. R95p and CDD) by the number of people (Jones et al
2015, Chen et al
2020). Considering the two SSPs employed in CMIP6 models (SSP2-4.5 and SSP5-8.5) and the two SSPs populations (SSP2 and SSP5), the study adopts a two by two matrix of climate and population scenarios. This framework presents the basis for computing the expected EPIs related exposure and are identified as SSP2-4.5|SSP2 and SSP5-8.5|SSP5. The multi-model ensemble mean of 26 CMIP6 GCMs is used to compute the spatial PE over the study region. The roles of climate and population changes on the exposure were also investigated as employed in previous studies (e.g. Liu et al
2017, Chen et al
2020, Iyakaremye et al
2021, Ma and Yuan 2021). It is noteworthy to mention that the EA population experiences diverse risks, given that the magnitude of exposures is due to weak adaptive structures and other multi-faceted challenges (Ahmadalipour et al
2019). Nevertheless, this study focuses on climate risks and not estimations of the changes in other vulnerability and risk evaluations. The study employs a technique proposed by Jones et al (2015) that examines the influence of climate and population on exposure through the decomposition of the change and exposure into three effects: climate effect, population effect, and nonlinear interaction effect. The exposure change  can be expressed mathematically using equation (2);

where  is the total change in population exposure,
  and
and  are population and precipitation extremes, respectively, in the baseline period.
  and
and  are the changes in population and precipitation extremes at 1.5 °C and 2.0 °C warming levels relative to the baseline period. The term
  is the climate effect. The study ascertains the effect of climate on exposure by controlling the population in the baseline period while allowing the climate to change according to the projected precipitation extremes. The
  signifies population effect. In this segment, the population is allowed to vary according to the predicted population, leaving climate unchanged in the baseline period. ΔX × ΔY specifies the interaction effect (i.e. the change in exposure that results from simultaneous change in both climatic and population effects) and is computed under all the selected SSPs × SSPs combinations as the difference between total exposure and the sum of the climate and population effects. Detailed explanations and mathematical equations can be obtained in related literature that examined changes in exposure to heat extremes or precipitation extremes at a global level or continental level (e.g. Liu et al
2017, Chen et al
2020, Ma and Yuan 2021).
signifies population effect. In this segment, the population is allowed to vary according to the predicted population, leaving climate unchanged in the baseline period. ΔX × ΔY specifies the interaction effect (i.e. the change in exposure that results from simultaneous change in both climatic and population effects) and is computed under all the selected SSPs × SSPs combinations as the difference between total exposure and the sum of the climate and population effects. Detailed explanations and mathematical equations can be obtained in related literature that examined changes in exposure to heat extremes or precipitation extremes at a global level or continental level (e.g. Liu et al
2017, Chen et al
2020, Ma and Yuan 2021).
Figure 1(a) presents the projected area-averaged population distribution under SSP2 and SSP5 scenarios, respectively, for 2015–2100, while figure 1(b) shows the spatial area-averaged population density over EA during 1995–2014. Currently, the population density is mainly concentrated over the western parts of EA, with countries like Burundi, Rwanda, Uganda, and western Kenya having a greater percentage of the population as compared to other regions (figure 1(b)). The eastern side of Kenya and parts of Tanzania have a sparse population density distribution, except for the coastal belts.
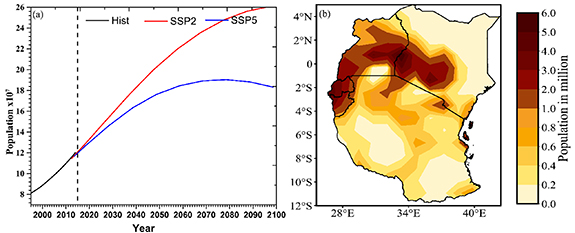
Figure 1. East African population statistics. (a) Time series of population and (b) spatial distribution of population in million during 1995–2100 obtained from ISIMIP2b.
Download figure:
Standard image High-resolution image3. Results and discussions
3.1. Projected changes in extremes precipitation in 1.5 °C/2.0 °C warmer climate
The changes in precipitation indices, except for CDD and heavy precipitation days (R20mm), are expressed as percentage changes relative to the reference period. Indices such as PRCPTOT, SDII, CDD, and R20mm are presented in the supplementary material as figures S3–S6, respectively. For demonstration, the results of R95p are shown in figure 2. The region experiences a pronounced increase in R95p by approximately 12% under SSP2-4.5 based on 1.5 °C global warming. However, the increase in R95p under SSP5-8.5 considering 2.0 °C global warming rises to about 18%. The increase in R95p under SSP2-4.5 scenario in 1.5 °C warming climates is approximately 8% smaller than in 2.0 °C, and even 13% smaller in 0.5 °C less warming between 1.5 °C and 2.0 °C warming climates. The areas with insignificant R95p change differences are mainly observed in southern Kenya and much of central and eastern Tanzania (figure 2(c)). The maximum increase occurs in eastern Kenya, consistent with the findings of Osima et al (2018) that was based on the CMIP5 dataset. The spatial distribution of changes for SDII is similar to that of R95p, while the change values in SDII are smaller than that of R95p (figure S4). The area-mean increase in SDII across EA is also lower under SSP5-8.5 than under SSP2-4.5 scenario in 1.5 °C warming climate (figure S4).

Figure 2. Spatial pattern of projected changes (%) in R95p over EA relative to 1995–2014 for 1.5 °C and 2.0 °C warming. The results are based on the (a) SSP2-4.5/1.5 °C; (b) SSP2-4.5/2.0 °C (d) SSP5-8.5/1.5 °C, and (e) SSP5-8.5/2.0 °C scenario. Subplots along the right column (c), (f) show the spatial pattern of half-a-degree difference between SSP2-4.5/2.0 °C and SSP2-4.5/1.5 °C (c); and between SSP5-8.5/2.0 °C and SSP5-8.5/1.5 °C (f). Dotted areas are significant at the 95% confidence level.
Download figure:
Standard image High-resolution imageSpatial mean average of extreme precipitation indices over EA, and the inter-model spread for 1.5 °C and 2.0 °C of global warming are presented in figure 3, while spatial changes for CDD and R20mm are shown in figures S5 and S6, respectively. Unlike other extreme precipitation indices, CDD show a lower change for SSP5-8.5 compared to SSP2-4.5 at 2.0 °C warming climates (figures 3(b) and S5). Besides, large uncertainties can be seen from the models for CDD across EA under the SSP5-8.5 scenario, with model spreads ranging from −2 to 3 d under the 1.5 °C warming target and −2 to 5 d under the 2 °C warming target (figure 3). Spatial analysis shows significant changes along southern Tanzania, where a notable increase in dry days is projected to occur at 6–8 d for SSP2-4.5 and SSP5-8.5 scenarios, respectively (figures S5(a), (b), (d), (e)). There is a remarkable difference in 0.5 °C less warming, with most parts of the region showing fewer changes in CDD in both scenarios (figures S5(c) and (f)). The magnitude of precipitation changes in R20mm shows significant changes along western sides and is less pronounced under SSP5-8.5/1.5 °C as compared to SSP2-4.5/1.5 °C (figures S6(a) and (d)). Nonetheless, under SSP2-4.5/2.0 °C and SSP5-8.5/2.0 °C scenarios, the region will experience significant changes in R20mm across most parts (figures S6(b) and (d)). Most parts of the study area will encounter a remarkable increase in R20mm under SSP2-4.5/0.5 °C as compared to SSP5-8.5/0.5 °C (figures S6(c) and (f)). Persistent, significant occurrence of R20mm is projected to occur over the western sides of the study area under the two scenarios for 0.5 °C less warming (figures S6(c) and (f)).

Figure 3. Projected changes in (a) PRCPTOT (%), R95p (%), SDII (%); (b) CDD (day) and R20mm (day) for spatial area-avaraged over EA under 1.5 °C and 2.0 °C warming targets, relative to 1995–2014. The black bars indicate the uncertainty ranges of the simulations. The filled bars show the ensemble mean, the middle line on the black bars shows the ensemble median, and the error bars represent ranges of one SD (1σ) among models.
Download figure:
Standard image High-resolution imageIn general, for 1.5 °C and 2.0 °C of global warming, the extreme precipitation indices averaged over EA are projected to increase under both scenarios, except for CDD that demonstrate a decrease in the northern-most parts of Kenya and Uganda. The largest increases occurred in eastern and northern Kenya for PRCPTOT, R95p, and SDII. On the other hand, a notable increase for R20mm occurs over the western sides of the study area under SSP5-8.5/1.5 °C. Moreover, the projected increase will intensify under higher degrees of global warming, despite the comparable inter-model spread between different warming targets (not shown). Under the SSP2-4.5 scenario, PRCPTOT will increase by approximately 2% and 4% over EA for 1.5 °C and 2.0 °C of global warming, whereas R95p will significantly increase by 12% and 18%, respectively. Projected changes under SSP5-8.5 for PRCPTOT and R95p are 2% (10%) and 4% (20%) under 1.5 °C and 2.0 °C of GWLs. Future changes in PRCPTOT is projected to increase, which leads to a potential higher increase in occurrences of R95p and the possibility of flooding. The increase in SDII is slightly smaller than that of PRCPTOT (figure 3(a)). The absolute increase in R20mm is small under both scenarios (figure 3(b)). Meanwhile, limiting warming target to below 1.5 °C but not 2.0 °C will avoid 37% (44.2%) and 92% (4%) impact occurrence of EPIs of R95p (CDD) under SSP2-4.5 (SSP5-8.5) scenarios, respectively (figure S7). These results indicate that a warming climate drives the increasing tendency of extreme precipitation indices with the exception of CDD, implying an intensification of precipitation processes in a warmer climate.
The findings of the present study are in agreement with the recent studies that employed large ensemble members from large ensembles of RCMs outputs to project changes in extremes precipitation over EA region (Cattani et al 2018, Osima et al 2018, Ogega et al 2020, Dosio et al 2021). The aforementioned studies noted an increase in precipitation extremes over the study domain, which is mainly associated with the alteration in the Hadley circulations and thermodynamic impact linked to the Indian Ocean dipole (IOD) (Hastenrath et al 2011, Endris et al 2016, 2019).
3.2. Population exposure to extreme precipitation events as a result of additional warmings
We estimate the projected PE to precipitation extremes based on projections obtained from SSP scenarios (Jones and O'Neill 2016). Figure 4 show the spatial variation distribution of projected changes in population exposure to R95p relative to the baseline period while figures 5 show the responses under two global mean warming levels. Changes in PE to CDD are presented in figures S8 and S9, respectively. With the expected future warming, the PE under different warming scenarios demonstrates the most prominent net intense occurrence over Burundi, Rwanda, and some parts of Uganda (figure 4). In contrast, less change is noted to occur over vast parts of Kenya and Tanzania. Comparable changes are well delineated for different SSP scenarios, even though a substantial increase is expected under SSP2-4.5 scenarios and relatively lower exposure is projected under 1.5 °C as compared to 2.0 °C (figures 4(a), (b), (d), (e)). The exposure to extremely wet precipitation events under the SSP2-4.5 scenario at 1.5 °C warming levels is projected to occur less in most regions, except for Burundi, Rwanda and around east Lake Victoria basin (figures 4(a) and (b)). For example, under the SSP2-4.5 scenario, the PE under 2.0 °C is about 46 × 105 billion person mm, which declines to 40 × 105 billion person mm under SSP5-8.5|SSP5 and 2.0 °C warming levels (figure 5). In comparison, under 1.5 °C warming, exposure is reduced to 26 × 105 billion person mm (23 × 105 billion person mm) under SSP2-4.5 (SSP5-8.5), respectively. In contrast to 2.0 °C warming level, 0.5 °C less warming reveals noteworthy net changes for the exposure to precipitation extremes (figures 4(c) and (f)). The exposure is reduced to 19 × 105 billion person mm (18 × 105 billion person mm) under SSP2-4.5 (SSP5-8.5) scenarios (figure 5). The large population exposed to EPIs under SSP2-4.5 could be attributed to the projected population growth, urbanization, and spatial patterns of development under the SSP2 (middle of the road) scenario. The R95p causes impacts such as water-borne disease outbreaks, stressed sewage networks, landslides, wrecked homes and buildings, damaged crops and affected agricultural production, affected traffic conditions, and most importantly, heavy and deadly flooding. In contrast, the SSP5-8.5, which represents fossil-fueled development, is characterized by a low fertility rate, high income, and sprawl pattern patterns, thereby reducing the impact of PE to EPI. The findings show that 0.5 °C less warming could lead to a 42.1% (43.1%) reduction in population exposed to EPIs under SSP2-4.5 (SSP5-8.5) scenarios.
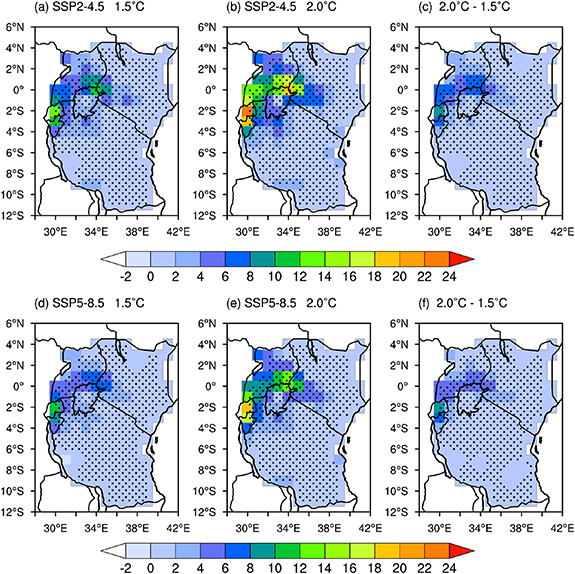
Figure 4. Spatial distribution of projected relative changes in population exposure to R95p (unit: ×105 billion person mm yr−1) compared to the recent climate (1995–2014) under SSP2-4.5 (a), (b) and SSP5-8.5 (d), (e) at different warming levels. Figures (c) and (f) show the change in exposure from 1.5 °C to 2.0 °C warmer climates under SSP2-4.5 and SSP5-8.5, respectively. Dotted areas are significant at the 95% confidence level.
Download figure:
Standard image High-resolution image
Figure 5. Projected changes in population exposure under SSP2-4.5|SSP2 and SSP5-8.5|SSP5. Error bars denote the standard deviation in the anticipated population exposure to R95p (unit: ×105 billion person mm yr−1) compared to the recent climate (1995–2014) under SSP2-4.5 and SSP5-8.5 at different warming levels. Blue bars indicate the effect of 0.5 °C less warming from 2.0 °C over spatial avarages of East African domain.
Download figure:
Standard image High-resolution imageRisks related to climate change have been detected to significantly increase over recent decades and are projected to worsen under future warmer conditions (IPCC 2018, 2021). Estimating population exposure to extreme precipitation events is key to assessing the risk induced by extreme precipitation and flooding. The evolution of exposure to extreme precipitation with different warming levels signifies the speed at which this hazard affects society. Over the study region, the exposure of the population to climate events remains a significant feature (Niang et al 2014). Recent decades have witnessed an amplification of wet extreme event incidences (Kilavi et al 2018, Tramblay et al 2020, Wainwright et al 2020), mainly as a result of the positive phase of IOD (Cai et al 2018, Endris et al 2019, Ngoma et al 2021b). Such changes will directly impact the population that remains vulnerable due to its low adaptive capacity (Ahmadalipour et al 2019). The projected exposure increase over the study domain has been found in other regions across the globe (Chen et al 2020, Wang et al 2020, Ma and Yuan 2021, Zhao et al 2021), and will likely intensify due to the increase in global warming and the proliferation of urban populations. Lowering the warming by 0.5 °C in the future will have a ripple effect in minimizing the adverse impact of climate change, not only over the study region but likewise at the global level (Rogelj et al 2018, Chen et al 2020, Wang et al 2020). Overall, the exposure to precipitation extreme events is expected to increase substantially under a 2.0 °C warmer future as compared to 1.5 °C. The present study agrees with existing studies that project notable intensification of pluvial occurrences over EA during the near and middle 21st century (Nguvava et al 2019, Haile et al 2020, Tan et al 2020, Ayugi et al 2021a).
Finally, the study appraised the relative importance of climate and population change under SSP2-4.5 and SSP5-8.5 at 1.5 °C and 2.0 °C GWLs (figure 6). Under the two scenarios explored in this study (figures 6(a) and (b)), we found future exposure to be predominantly driven by changes in population rather than climate and interaction factors. Under SSP2-4.5, the projected change due to climate (constant population) is nearly 2.3 (∼5.8) × 105 billion person mm at 1.5 °C (2.0 °C) warming levels. However, population exposure (constant climate) is ∼21 (33.8 × 10⁵ billion person mm) at 1.5 °C (2.0 °C) warming levels (figure 6(a)). In other words, climate effects are anticipated to contribute by ∼10.6% (12.6%) of the total change in population exposure under 1.5 °C (2.0 °C) warming levels, while population and interaction effects are expected to contribute ∼77.4% (71.9%) and 12% (15.5%), respectively, under 1.5 °C (2.0 °C) scenarios. For SSP5-8.5 scenario, the expected changes in exposure resulting from climate effect is ∼3.8 (6.1 × 10⁵ billion person mm), i.e. 15.7% (17.5%) of the total change at 1.5 °C (2.0 °C) warming levels, whereas population account for 16.1 × 10⁵ billion person mm (75%) at 1.5 °C and 26 × 105 billion person mm (66.2%) in 2.0 °C of the total change, respectively (figure 6(b)). Interestingly, the projected changes in regional exposure due to the interaction effects under SSP2-4.5|SSP2 are bigger than the climate effect, while the reverse pattern is observed under SSP5-8.5|SSP5. For instance, under SSP2-4.5, the interaction effect contributes about ∼3.1 × 10⁵ billion person mm (12%) and ∼7.0 × 10⁵ billion person mm (15.5%) of the total change in 1.5 °C and 2.0 °C GWLs (figure 6(a)). Under the SSP5-8.5 scenario, climate effects are higher at ∼3.8 × 10⁵ billion person mm (15.7%) of the total change in 1.5 °C and further rises to ∼6.4 × 10⁵ billion person mm (17.5%) in 2.0 °C (figure 6(b)).

Figure 6. EA aggregate projected changes in population exposure under (a) SSP2-4.5|SSP2 and (b) SSP5-8.5|SSP5. Error bars show the standard deviation in the anticipated exposure due to climate, population, interaction, and total effect across the ensemble.
Download figure:
Standard image High-resolution image
The projected population exposure over EA shows similar varying patterns to those observed in other regions or at a continental level. The contributing factors affecting most regions and at the continental level vary from either population effects, GDP, interactive effects, or climate effects (Winsemius et al 2016, Liu et al 2020, Chen et al 2020). For instance, over Europe, the climate effect has a strong influence due to low population growth, while regions of Asia, North/South America, and Oceania have a dominant climate effect as compared to the interaction effect (Liu et al 2020, Chen et al 2020). The present study agrees with recent research that noted the chronology of contributing factors in Africa, with population accounting for >75%, followed by interactive change and climate change having the least contribution (Liu et al 2020). The aforementioned study listed 10 countries with the highest population exposure, accounting for >53% of global exposure. Interestingly, among the listed nations, three countries (including Rwanda, Burundi, and Uganda) are situated in East Africa. Other countries include: Nigeria, the Philippines, Bangladesh, Haiti, the Netherlands, Luxemburg, and Belgium. Similar findings have been observed in other studies that established the impact of climate extremes on society's well-being (Cook et al 2015, Harrington and Otto 2018).
Given the importance of the interaction and population effects, clearly, any policy response designed to reduce population exposure to these extreme events needs to focus at the country level by considering their socioeconomic developments (population growth), and climate mitigation efforts. As a way forward, the high exposure noted over EA calls for a shift in policies with an adaptative measure to be put in place to cushion the effect on the exposed population. Actions such as relocations to high elevation ground, climate smart agriculture, and water harvesting will prove necessary as a first practical step to minimize population and socio-economic losses due to projected increases in precipitation extremes and high population exposure noted (Schlenker et al 2013, Nsubuga and Rautenbach 2017).
4. Summary and conclusions
We first examined the capability of CMIP6 GCMs to simulate current EPIs across EA. We then quantified the climate change impacts on five EPIs, including CDD, SDII, R20 mm, R95p, and PRCPTOT, and investigated the effects of climate and population on total exposure. The findings suggest that most models generally demonstrate the ability to capture the observed EPIs. Projected changes in precipitation extremes show that all the considered EPIs (except CDD) averaged over EA are projected to increase at both 1.5 °C and 2.0 °C GWLs. Nevertheless, large uncertainties were notably exhibited by the models in projecting CDD across EA, especially under the SSP5-8.5 scenario. Meanwhile, limiting the warming target to below 1.5 °C but not 2.0 °C will avoid 37% (44.2%) and 92% (4%) impacts on the occurrence of EPIs of R95p (CDD) under SSP2-4.5 (SSP5-8.5) scenarios, respectively. These results indicate that a warming climate drives the increasing tendency of extreme precipitation indices with the exception of CDD, implying an intensification of precipitation processes in a warmer climate. As for exposure of population to EPIs, population change shows more influence than climate and interaction factors in expediting the intensification of future exposure. The findings show an increased intensification of population exposure that corroborates the need to urgently limit further GHG emissions and strive to realize a carbon-free economy. While previous studies (i.e. Rowell et al 2015, Wainwright et al 2020) noted the challenges of GCMs in projecting mean and extreme precipitation events over EA, we deem the results on regional exposure to EPIs vital for regional planning and development. One such example is by considering climate finance decision-making. Finally, the high exposure noted over EA calls for a dire need to have a more considered policy than a stable climate so as to instate suitable adaptation measures to cushion the already vulnerable population. Future studies may consider population patterns in urban–rural areas and population demographic and socio-economic characteristics (such as age, gender, income, or educational level), which influence extreme precipitation-related deaths or injuries. Moreover, socio-economic development enhances social awareness and capabilities to reduce disaster vulnerability in the future. Hence, the estimated exposed population to EPIs in this study may not be the actual view, as it does not consider the country's level of adaptation mechanisms to extreme precipitation. Overall, the climate effects depends on the global emissions of greenhouse gases, and therefore can only to a limited extent be affected by the measure of the East African countries. On the other hand, the reduction of population growth mainly depends on domestic decisions. China has been the country exercising the most effective population policy in the world, so that their experiences could be very useful in Africa as well.
Acknowledgments
The authors appreciate the WCRP-WGCM for making the latest outputs from CMIP6 publicly available. The support in data analysis provided by ZHU Huan Huan is greatly acknowledged. The authors acknowledge the infrastructural support provided by Nanjing University of Information Science and Technology. Financial and material support was received from the National Key Research and Development Program of China (Grant No. 2017YFA0603804) and grant from Postdoctoral Research Foundation of Jiangsu Province (Grant No. 2191012100301).
Data availability statement
The data that support the findings of this study are available upon reasonable request from the authors.
Authors contribution
The following are individual contributions: B A and V O: conceptualization, formal writing, and original draft preparation. V I and H B: data curation, methodology, visualization. H N, R M and C O: writing-review and editing, investigation. V O and V D: validation, writing-review, and editing. Z H: funding.
Compliance with ethical standards
We declare no conflict of interest in this study.