

Abstract
Accumulating evidence on the impact of climate change on droughts, highlights the necessity for developing effective adaptation and mitigation strategies. Changes in future drought risk and severity in Australia are quantified by analyzing nine Coupled Model Intercomparison Project Phase 6 climate models. Historic conditions (1981–2014) and projections for mid-century (2015–2050) and end-century (2051–2100) from four shared socioeconomic pathways (SSP1-2.6, SSP2-4.5, SSP3-7.0 and SSP5-8.5) are examined. Drought events are identified using both the standardized precipitation index and the standardized precipitation evapotranspiration index. The spatial-temporal evolution of droughts is addressed by quantifying the areal extent of regions under moderate, severe and extreme drought from historic to end-century periods. Drought characteristics derived from the models are used to develop severity–duration–frequency curves using an extreme value analysis method based on ordinary events. Under SSP5-8.5, a tenfold increase in the area subject to extreme droughts is projected by the end of the century, while a twofold increase is projected under SSP1-2.6. Increase in extreme droughts frequency is found to be more pronounced in the southern and western regions of Australia. For example, frequency analysis of 12 month duration droughts for the state of South Australia indicates that, under SSP5-8.5, drought severities currently expected to happen on average only once in 100 years could happen as often as once in 3 years by the end of the century, with a 33 times higher risk (from 1% to 33%), while under SSP1-2.6, the increase is fivefold (1%–5%). The significant difference in the increase of drought risk between the two extreme scenarios highlights the urge to reduce greenhouse gases emission in order to avoid extreme drought conditions to become the norm by the end of the century.
Export citation and abstract BibTeX RIS
1. Introduction
Droughts are climate-related extremes that pose significant risk to the economy, society and the environment. Accumulating evidence on the impact of climate change on drought characteristics [1–5], combined with an increase in vulnerability of human systems and ecosystems to droughts [6–9], highlight the necessity for developing effective adaptation and mitigation strategies [8]. Continuous advances in global climate models (GCMs) and releases of new Coupled Model Intercomparison Project (CMIP) experiments offer new ground for forecasting the state of climate under different emission scenarios, and therefore call for continuous updates of the projections of future drought conditions.
Thus far, the vast majority of studies dealing with the analysis of future droughts are focused on the investigation of trends in drought signals derived from GCMs [3, 10–13]. These studies helped to identify 'hotspots' of future drought increase, independently quantifying the expected magnitude of change of different drought characteristics, such as severity, duration, and frequency. Such information is valuable to alert water managers, biodiversity conservation agencies and other relevant stakeholders, but is still limited for effective assessment of future drought risk as it lacks probabilistic information on the occurrence of severe droughts of a given duration of interest. Estimation of recurrence interval of extreme events of given magnitude is fundamental requirement for risk assessment.
Mirroring the common practice for extreme precipitation risk management, past works introduced the concept of severity–duration–frequency (SDF) curves in the context of drought risk assessment [14, 15]. SDF curves provide a link between the severity of a drought persisting for a given duration to its probability of occurrence, and thus represent a concise tool for assessing drought risk. For example, the 100 year flood, an event with an average return period (T) of one century, is a concept widely used among flood risk managers, water engineers, risk modelers and social scientists and is particularly prime for applications in biodiversity conservation where focus on climate change risks are an increasingly research focus. Using the notion of changes in the T-year drought provides an effective way to communicate future drought risk across disciplines. To assess these changes, parametric frameworks based on extreme value analyses were proposed by comparing historical climatic extremes with future scenarios [16–18]. However, large uncertainties typically emerge from the analysis of extremes from short data records, thus reducing the robustness of these models when it comes to very rare events [19, 20].
Here, for the first time, we combine a novel statistical framework for the analysis of extremes, able to drastically reduce these uncertainties [21, 22], with state-of-the-art climate data and projections [23] to assess future drought risk in Australia. We present a framework that estimates and analyzes the changes in SDF curves with the idea that, since droughts have multiple characteristics [24], a framework providing robust estimates of the return period of droughts with certain severity and duration will offer a clear advancement for future drought risk assessment.
2. Methods
2.1. Study area and data
Climate projections of monthly precipitation and daily temperatures (minimum, maximum and mean) from 1981 to 2100 for Australia were obtained from nine GCMs (table S1 available online at stacks.iop.org/ERL/17/044034/mmedia) of the ScenarioMIP experiment [25] of CMIP6 [23] under four different scenarios of greenhouse gases emissions and socio economic development by the end of the century (SSP1-2.6, SSP2-4.5, SSP3-7.0 and SSP5-8.5). The nine GCMs were chosen based on the availability of selected variables at ∼100 km resolution. The same variables were obtained from 1981 to 2019 from the ERA5-Land reanalysis dataset [26, 27] to serve as a comparison to GCMs historic period. Given that we are interested in the analysis of anomalies, rather than the actual magnitude, of climate variables, we did not apply any bias adjustment procedure to GCM outputs. Our decision on analyzing the original GCM outputs without any bias adjustment is based on the fundamental assumption that GCMs provide plausible projections of climate anomalies and consistent with recent studies on future droughts [2, 11, 28].
Potential evapotranspiration (PET) was estimated based on the Hargreaves–Samani (HS) method [29, 30]. Although previous research indicated the Penman–Monteith (PM) method as the most physically robust [31, 32], it requires significantly more inputs, which would reduce the number of available GCM's. A comparative analysis between PET methods is presented in the supplementary material (section S2.3) to demonstrate the level of uncertainty and consistency of findings of this work with respect to the PET method used.
2.2. Definition of droughts
Droughts were identified using two well established indices, the Standardized Precipitation Index (SPI) [33], and the Standardized Precipitation Evapotranspiration Index (SPEI) [34]. These indices are defined as anomalies in the monthly standardized time series of precipitation (SPI) and precipitation minus PET (SPEI) calculated over a predefined temporal scale (e.g. 3, 6, 12 months, usually termed SPI3, SPI6, SPI12, etc) preceding the month of interest. Since we aim to quantify future, potentially unprecedented values, a parametric approach for the computation of the indices is preferred. Following previous studies [35], a Gamma distribution was used for standardizing SPI, and a three parameter generalized extreme value for SPEI (see section S2.4 for details). The parameters describing these distributions were estimated from the historic part of GCMs and were used to calculate historic and future indices.
Distinct drought events were identified as continuous negative SPEI/SPEI series with at least one value ⩽−1 (i.e. a negative anomaly exceeding 1 standard deviation) [33]. Drought severity was defined as the accumulated SPI/SPEI values within a drought event and a duration of interest [33]. Although the approach can be applied to any time scale, our analyses are based on SPI3/SPEI3; a temporal scale of drought that has been found to correlate well with fire severity [36] and plant productivity [37]. Drought indices were calculated at monthly resolution and drought severity was computed by integrating the indices over different durations within drought events.
Changes in the spatial extent of droughts were analyzed by investigating the drought area ratio (DAR) defined as the fraction of total area of Australia under drought conditions. DAR was analyzed for all drought conditions together with different severity classes: moderate (−1 ⩾ SPI/SPEI > −1.5), severe (−1.5 ⩾ SPI/SPEI > 2) and extreme (−2 ⩾ SPI/SPEI) [33].
2.3. Extreme value analysis
By definition, only a few droughts may occur every year. Thus, the statistical analysis of extreme droughts challenges the asymptotic assumption of the extreme value theorem [38, 39]. Here, we address this issue by adopting a framework based on the concept of ordinary events, which are the independent realizations of the process of interest [40–42]. The approach is based on the idea that a fraction of data much larger than the extremes, the so-called ordinary events, can be used to (a) parametrize the tail of the distribution, and (b) explicitly consider the number of occurrences of the process of interest. By relying on an increased sample (ordinary, as opposed to extreme, events), this approach reduces stochastic uncertainties and systematic errors stemming from bias in the data and limited length of the data records [20–22]. Following the methodology detailed in [43], we focus our analysis on the largest portion of ordinary events whose statistical properties are shared with extremes. Analyses run over several drought temporal scales and locations across Australia suggest that the largest 30% of the ordinary events can be effectively used to describe drought extremes (see section S2.5 for details). The tail of the distribution is found to be characterized by a stretched-exponential decay, which can be parametrized by a two-parameter distribution in the form:  . Extreme T-year drought severities
  are then computed explicitly considering the occurrence frequency of droughts by inverting the extreme value distribution:
  , where
  is the annual exceedance probability, F is the tail model described by the parameters
  , and n is the ratio between the total number of drought events and the number of years in the considered time period.
3. Results and discussion
3.1. Changes in drought indices frequencies
A first indication of the projected changes in droughts can be obtained by analyzing the differences in the empirical cumulative distribution function (CDF) of drought indices for different periods (figure 1). Figure 1(a) presents the CDF for each GCM in the historic period which, by definition of SPEI, is a standard normal distribution. The spread of CDFs in this panel, which is more pronounced on the left tail of the distribution, highlights the uncertainty in representation of extremes due to stochastic sampling uncertainty. The historic median distribution shows a frequency of roughly 2% and 12% for extreme and severe/moderate indices respectively. Under the SSP1-2.6 scenario (figures 1(b) and (c)), most of the models show a clear shift towards dryer conditions (higher probability of low SPEI values) in comparison to the historic period. Relatively small changes are observed in SPEI frequencies between mid- to end-century, which indicates a stabilization for this scenario, in agreement with previous studies [2, 5]. The frequency of extreme indices (−2 ⩾ SPEI) rises to ∼5% (multi-model median value and model range ∼4%–9%) during mid-century, and ∼6% (∼3%–8%) by end-century. The frequency of moderate to severe indices (−2 > SPEI ⩾ −1) is slightly different for both periods, with multi-model median of ∼25% (and range ∼16%–41%) for mid-century and ∼19% (∼17%–22%) for end-century. These frequencies are considerably lower during the historic period than those obtained from the model's projections, which indicates that under SSP1-2.6, conditions become drier, but with a tendency of stabilization from mid- to end-century. Under SSP2-4.5 (figures 1(d) and (e)), the changes in distribution are similar to the previous, but with a slight increase in the frequency of extreme indices, which is ∼5% (∼4%–7%) during mid-century and ∼8% (4%–12%).

Figure 1. Cumulative distribution function (CDF) of SPEI indices for the whole extent of Australia for (a) historic period, (b) SSP1-2.6 mid-century, (c) SSP1-2.6 end-century, (d) SSP2-4.5 mid-century, (e) SSP2-4.5 end-century, (f) SSP3-7.0 mid-century, (g) SSP3-7.0 end-century, (h) SSP5-8.5 mid-century and (i) SSP5-8.5 end-century. The shift towards drier indices in comparison to historic median are noticeable in all panels.
Download figure:
Standard image High-resolution imageChanges are more pronounced under scenarios SSP3-7.0 (figures 1(f) and (g)) SSP5-8.5 (figures 1(h) and (i)). Although the mid-century responses are similar for all scenarios, in these last two scenarios, the CDFs revealed a steep increase in frequency of severe and extreme drought indices towards the end of the century. This behavior is unanimous among the GCMs and, even though the magnitudes of change vary, they are always larger than the stochastic uncertainty represented by the spread of the models around the normal distribution in the historical period. The median frequency of extreme indices during the mid-century is ∼5% (∼3%–7%) for SSP3-7.0, ∼6% (∼3%–7%) for SSP5-8.5 and increases towards the end of the century to ∼10% (∼6%–20%) and ∼15% (∼5%–25%) respectively.
A drying behavior was also observed for SPI (figure S1) indicating an increase in the number of events of abnormally low precipitation, although the magnitude of the changes in the indices is higher for the former, which highlights the effects of PET in the SPEI estimates.
3.2. Changes in drought spatial extent
Figure 2 shows the evolution of the decadal average of DAR for different drought severity classes based on SPEI and GCM outputs, and the average DAR from ERA5-Land data (dashed lines). The portion of Australia under drought is consistently increasing towards the end of the 21st century in descending order of magnitude under SSP5-8.5 (red color in figure 2), SSP3-7.0 (blue color in figure 2), and SSP2-4.5 (yellow color in figure 2) while it increases and stabilizes after mid-century under SSP1-2.6 (green lines and shaded area figures 2(a)–(d)). More specifically, under SSP1-2.6 the multi-model median values increase until near 2060, then remain almost steady around 0.50 towards the end of the century. On the other hand, all the other three scenarios present a continuous increase in DAR, especially towards the end of the century. SSP5-8.5 increases continuously for mid- to end-century, while SSP2-4.5 and SSP3-7.0 have a stabilization period between 2050 and 2070 and then start to increase again. This behavior is also observed in the different classes of drought severity (figures 2(b)–(d)), with more pronounced changes in extreme droughts (figure 2(d)). At mid-century, the values of multi-model median DAR for all drought classes are above the average of the historic period (figure 2(a), dashed line at 0.35) for all four scenarios. The inter-model variability ranges from values below to more than double the historic mean (∼0.25–0.75), illustrating a large variability in model's projections, which nevertheless agree with the drying trend in the studied scenarios. The models' response for the end of the century shows diverging trends between SSP1-2.6 and the other scenarios. Under SSP1-2.6, the multi-model median DAR stabilizes around 0.50 after 2060, while it steadily rises to almost 0.70, 0.65 and 0.55 under SSP5-8.5, SSP3-7.0 and SSP2-4.5 respectively. Inter model variability is larger at the end-century period, ranging from near historic conditions (0.35) to almost three times higher than historic average (0.88). The response of severe (figure 2(c)) and extreme (figure 2(d)) droughts presents similar trends to the total drought, although the magnitudes and inter model variability differ for each class. For the moderate class, the historic average is ∼0.28 (figure 2(b), dashed line), which is nearly the same as the SSP5-8.5 value at 2100, while it is smaller than the SSP1-2.6, SSP2-4.5 and SSP3-7.0 values (∼0.40, 0.40 and 0.35). The historic average DAR for the severe class is ∼0.04, while the DAR is ∼0.06, ∼0.09, ∼0.095 and ∼0.11 for end of century projections for scenario SSP1-2.6, SSP2-4.5, SSP3-7.0 and SSP5-8.5 respectively. The DAR of extreme droughts presents larger relative variations with respect to the historic average (figure 2(d), dashed line at 0.02). By the end of the century, the SSP5-8.5 scenario projects a tenfold increase of the area subject to extreme drought, a nearly fivefold increase for SSP2-4.5 and SSP3-7.0, and the SSP1-2.6 a twofold increase.
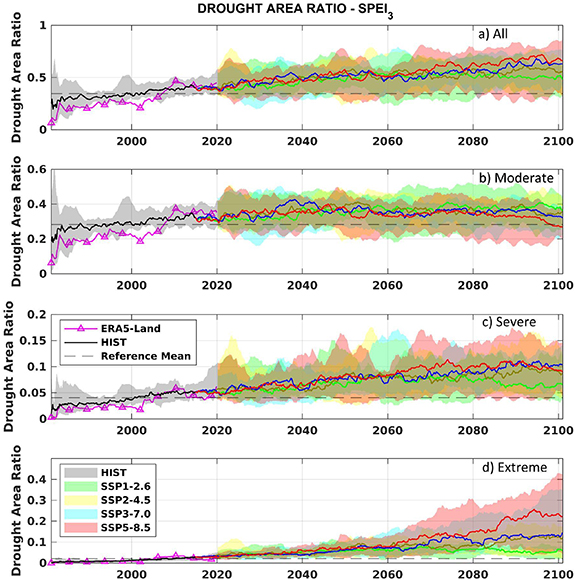
Figure 2. Decadal average of drought area ratio from SPEI under (a) all, (b) moderate, (c) severe and (d) extreme droughts. Green shaded area represents model variability of projections under SSP1-2.6 scenario, the red represents scenario SSP5-8.5, yellow SSP2-4.5 and blue SSP3-7.0. Thicker lines represent the multi-model median. Dashed line represents the average drought area ratio based on ERA5-Land data. The pink thicker line represents ERA5-Land decadal average while the black is related to median of the models during historic run.
Download figure:
Standard image High-resolution imageThe dynamics of drought trends found for each emission scenario follow the overall projected trends in precipitation and temperature for each scenario respectively [44]. Future projections for the SPI (figure S2 in the supporting information) exhibit also higher values of DAR when compared to the historic period, however the magnitudes of changes are smaller than the SPEI results. This indicates that the overall projected change in precipitation is less significant than the combined changes in precipitation and PET combined, highlighting the important control of temperature on future drought characteristics.
3.3. Changes in drought SDF curves
SDF curves synthesize three of the most important drought characteristics. Figure 3 shows SDF curves for fixed 12 month duration droughts in the state of South Australia, derived from SPEI based on spatially averaged precipitation and temperatures. In this region, extreme droughts are becoming more frequent under all studied scenarios, considering the multi-model median. Figures 3(a), (c), (e) and (g) show respectively the SDF for SSP1-2.6, SSP2-4.5, SSP3-7.0 and SSP5-8.5. There is a clear increasing trend in severity towards the end of the century, illustrated by the vertical shift between curves, with a more pronounced increase in SSP3-7.0 and SSP5-8.5. Analysis of the SDF curves allows us to directly quantify changes in drought risk. For example, considering SSP5-8.5, the present 100 year drought—that is, a drought severity which in current climate is expected to occur on average once in 100 years—is expected to be exceeded on average once every 30 years by the mid of the century, and once every 3 years by the end of the century. This corresponds to an increase in drought risk from 1% to 3.3% in the mid-century and to approximately 33% towards 2100. Scenarios SSP3-7.0 and SSP2-4.5 exhibit the same response for mid-century (30 years exceedance period, risk increase from 1% to 3.3%), but slightly smaller return periods at the end of century, respectively eight and ten years (risk increase to 12.5% and 10%). A smaller but still alarming increase is projected under the SSP1-2.6 scenario, in which a historic 100 year severity is expected to be exceeded on average once every 40 years by mid-century and once every 20 years by the end of the century. This corresponds to an increase in drought risk from 1% to 2.5% and 5% in the mid- and end-century, respectively. Figures 3(b), (d), (f) and (h) display the relative change in drought severity at mid- and end-century compared to the historic period for three return periods: 10, 50 and 100 years. Figure 3(b) shows a positive range of values for the three return periods and both mid- and end-century, indicating an increase in severity compared with current conditions. There is no significant difference, based on the Wilcoxon rank sum test at the 5% significance level, in the median for mid- and end-century under SSP2-4.5 and SSP1-2.6, confirming the previous indication of a stabilization behavior. On the other hand, figures 3(f) and (h) show a pronounced increase in severity from mid- to end-century as well as in comparison to the historic period for SSP3-7.0 and SSP5-8.5. Despite considerable variability among GCM's the median response in the end-century relative change is ranging from 100% to 150%, while the midcentury values range from 0% to 50%.
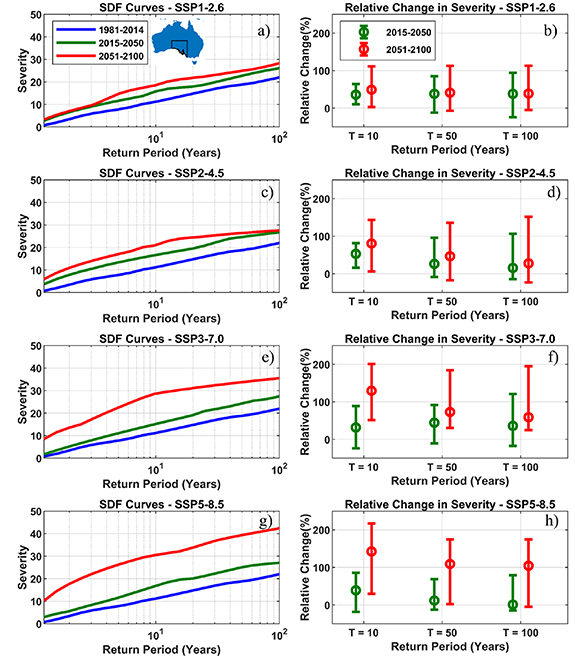
Figure 3. Median SDF curves from SPEI for South Australia state (highlighted in first panel). SDF obtained from SPEI for a 12 month duration drought under (a) SSP1-2.6, (c) SSP2-4.5, (e) SSP3-7.0 and (g) SSP5-8.5. The relative change of GCM's 10 year (10% annual exceedance probability), 50 year (2%) and 100 year (1%) severity for mid- and end-century compared with historic period is shown in panel (b) for SSP1-2.6, (d) for SSP2-4.5, (f) for SSP3-7.0 and (h) for SSP5-8.5.
Download figure:
Standard image High-resolution imageOverall, both SPEI and SPI (see figure S3 and relevant discussion in section S1 in supplementary material) present drying trends towards the end of the century for high emission scenarios, with results more pronounced for SPEI. For South Australia, all scenarios lead to an increasing risk of extreme droughts towards the end of the century. The ability to quantify, through SDF analysis, the expected increase in risk, provides important information for climate adaptation strategies. For example, exposure to future climate risks can be incorporated in monitoring and management plans that identify compounding hazards for at-risk species across Australia, which can be used to prioritize government funding [45, 46].
3.4. Changes in 100 year drought return period
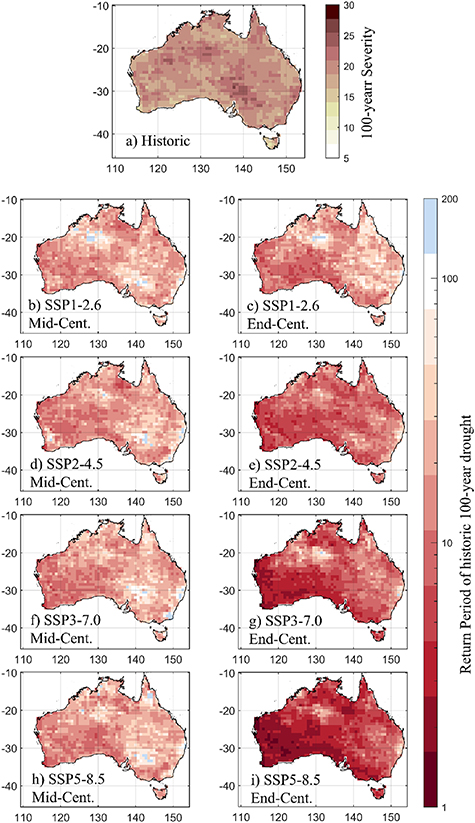
The analysis of changes in the current 100 year drought towards mid- and end-century revealed significant influence of greenhouse gases emissions. Figure 4 shows the return periods of severity associated with the historic 100 year drought of 12 month duration (multi-model median). Figure 4(a) shows the spatial pattern of SPEI3 drought severity over a 12 month duration corresponding to a current return period of 100 years. It is possible to observe multiple hotspots of high severity along the Australian territory, e.g. darker areas on central-east and northwestern portions. Figures 4(b) and (c) show respectively the mid- and end-century return periods of today's 100 year droughts under SSP1-2.6. Red colors indicate that the occurrence probability is increasing, while blue colors indicate decreases. Large areas in Australia will experience an increase in extreme drought frequency, with a few exceptions in the Northwest and Central-East regions. There is no significant change in the spatial patterns of mid- and end-century of SSP1-2.6, however a slightly stronger increase in frequency in western and southern regions is observed. Figures 4(d)–(i) present the mid- and end-century return periods of today's 100 year droughts under SSP2-4.5, SSP3-7.0 and SSP5-8.5. Although the pattern for mid-century is very similar for all scenarios, the end-century presents a significant hazard increase in the three scenarios with higher emissions, with SSP5-8.5 standing out for its pronounced increase in frequency. Significantly larger areas in the western and southern Australia present a corresponding return period of almost one year, i.e. under SSP5-8.5, what is now an extreme drought would correspond to normal conditions by the end of the century. Despite the difference in magnitude, all scenarios agree on the drying pattern. Results for SPI (see figure S4 and relevant discussion in section S.1.) also present drying patterns for some regions of Australia, although, as stated previously, changes are significantly larger considering SPEI. An important finding from our analysis (see section S.2.3) is that despite the differences between the PET method used (HS) and the more physically robust method (PM), the increase in drought risk remains in the same order of magnitude.
Figure 4. (a) Median 100 year severity of 12 month duration drought of the model's historic run (1981–2014). Changes in the return period associated to the historic 100 year drought of 12 month duration for (b) mid-century (2015–2050) under SSP1-2.6, (c) end-century (2051–2100) under SSP1-2.6, (d) mid-century under SSP2-4.5, (e) end-century under SSP2-4.5, (f) mid-century under SSP3-7.0, (g) end-century under SSP3-7.0, (h) mid-century under SSP5-8.5 and (i) end-century under SSP5-8.5. Droughts identified through SPEI.
Download figure:
Standard image High-resolution image
4. Conclusions
This study presents a novel framework for future drought risk assessment that is used to quantify changes in drought risk in Australia for different climate projections. This framework utilizes the concept of SDF curves combined with a novel statistical framework that enables robust estimation of extremes. Under the SSP1-2.6 emission scenario, the GCMs showed an increase in comparison to the historic median across Australia but did not present significant changes from mid- to end-century. On the other hand, the other three scenarios projected differences towards the end of the century, with SSP5-8.5 showing an unanimously drying response, presenting an increase in the frequency of extreme indices from 6% to 15%, according to the multi-model median. SPEI and SPI results indicated changes of different intensities, with SPI magnitudes being smaller, highlighting the impact of PET increase on future drought events and the importance of utilizing drought indices that can account for projected temperature increase [47].
Analysis of future droughts' spatial extent showed a continuously increasing area under drought for SSP5-8.5 with ∼70% of the area under drought towards the end of the century. For SSP2-4.5 and SSP3-7.0 the value is ∼65% and 55% respectively. Considering the low emission scenario, SSP1-2.6, DAR peaks at ∼50% around 2060 and remains steady towards 2100. Even for the milder emission scenario the projected area under extreme drought conditions is doubled while it is five times higher for SSP2-4.5 and SSP3-7.0, and it is ten times higher for SSP5-8.5 according to the multi-model median. Inter-model variability is significant, but the overall trends are consistent across models.
Analysis of the relative changes in the SPEI-based 100 year drought event of 12 month duration, revealed striking features. According to the multi-model median examined, for SSP5-8.5 and SSP3-7.0 the current climate 100 year drought could become a 1–3 year drought for Southern and Western regions in Australia. For SSP2-4.5, the new return periods range around the ten year drought. For SSP1-2.6, results are less severe but still alarming since the projected return period is decreasing by almost 30% in most areas. This suggests that even with a lower emission scenario, the frequency of extreme droughts will increase by almost 40%. Examination of changes based only on precipitation (i.e. based on SPI) confirm the increase in drought risk but with lower magnitudes in southern and western areas, while it projects decrease in frequency for northern and eastern regions. This is an indication about the significant role that increasing atmospheric demand of water will have in drought occurrence, even in areas that are projected to receive more precipitation. This highlights the importance of joint assessment of climate model outputs for assessing changes in future hydrologic conditions [48].
Comparison of SSP5-8.5, SSP3-7.0, SSP2-4.5 and SSP1-2.6 results highlight the impact of greenhouse gases emissions in the increasing drought risk towards the end century in Australia and provide alarming projections for mid-century even for the mildest emission scenario. While uncertainty in the results due to the choice of PET estimation method can be considerable, it was not found to alter the overall findings on the expected order of magnitude of increasing drought risk in Australia (see section S.2.3). However, it should be noted that results in this work are drawn primarily based (a) on SPEI, which is assumed to better capture future drought conditions and (b) on nice GCM model outputs. These can be considered, to certain extent, limitations of current work and therefore future extension of this analysis should focus on inclusion of more drought indices and a larger ensemble of GCM projections. The proposed framework can be adopted and applied for other climate extremes and can therefore serve as a valuable method for future climate risk assessments.
Acknowledgments
This work was supported by the National Science Foundation under Grant No. 1934712. We would like to acknowledge high-performance computing support from Cheyenne (doi: https://doi.org/10.5065/D6RX99HX) provided by NCAR's Computational and Information Systems Laboratory, sponsored by the National Science Foundation.
Data availability statement
The data that support the findings of this study are available upon reasonable request from the authors.