

Abstract
Increases in climate hazards and their impacts mark one of the major challenges of climate change. Situations in which hazards occur close enough to one another to result in amplified impacts, because systems are insufficiently resilient or because hazards themselves are made more severe, are of special concern. We consider projected changes in such compounding hazards using the Max Planck Institute Grand Ensemble under a moderate (RCP4.5) emissions scenario, which produces warming of about 2.25 °C between pre-industrial (1851–1880) and 2100. We find that extreme heat events occurring on three or more consecutive days increase in frequency by 100%–300%, and consecutive extreme precipitation events increase in most regions, nearly doubling for some. The chance of concurrent heat and drought leading to simultaneous maize failures in three or more breadbasket regions approximately doubles, while interannual wet-dry oscillations become at least 20% more likely across much of the subtropics. Our results highlight the importance of taking compounding climate extremes into account when looking at possible tipping points of socio-environmental systems.
Export citation and abstract BibTeX RIS

Original content from this work may be used under the terms of the Creative Commons Attribution 4.0 license. Any further distribution of this work must maintain attribution to the author(s) and the title of the work, journal citation and DOI.
1. Introduction
As climate hazards—such as heat, drought, and precipitation extremes—occur more closely in space and/or time, they increasingly pose far-reaching challenges to societal and ecological resilience. A variety of systems characteristics, both physical (e.g. atmospheric flow patterns or land-surface properties) and societal (e.g. political jurisdictions or supply chains), combine to make certain hazard combinations especially impactful (Puma et al 2015, AghaKouchak et al 2020, Raymond et al 2020, Kuhla et al 2021, Wunderling et al 2021). In exceptional cases, where systems are altered in ways that persist beyond typical recovery timescales, the impacts can be considered as evidence of crossing a tipping point. Among examples are heat and drought that can make forests more vulnerable to wildfire or insect damage, resulting in permanently altered ecology (Yiou and Viovy 2021); heavy precipitation across a wide area that leads to major flooding at downstream river confluences (He et al 2015); and oscillation between extreme dry and wet conditions that can amplify the impacts of both (Swain et al 2018, Balch et al 2020).
The additive effects of hazards occurring in proximity to one another, termed compounding, can thus lead to impacts beyond or different from those of the hazards individually (Zscheischler et al 2020). These impacts can affect natural or societal systems, and act over spatial or temporal dimensions. Recent advances in theories of compounding (Raymond et al 2020, Thonicke et al 2020, Rusca et al 2021, Simpson et al 2021), in the statistics and dynamics of specific hazards (Bevacqua et al 2021), and in the analysis of co-occurrence of different hazard types (particularly drought and heatwaves; Rogers et al 2021, Singh et al 2021), have enabled an ever wider array of risk scenarios to be considered with sophistication. However, there remains a lack of systematic and cross-scale overviews of potential hazard interaction. We argue that a broad view is necessary to obtain a more intuitive grasp of how global trends in precipitation and temperature affect regional changes in spatial and temporal compounding; how these changes then affect societal risks; and how the relative uncertainty around these relationships may vary. Large ensembles of Earth-system model simulations are a critical tool because observational catalogues of these events are too short for meaningful statistics, and especially so in parts of the world historically underserved by in-situ observing systems. Additionally, compared to studies with small numbers of simulations, large ensembles are better able to accurately sample rare co-occurrences of extreme conditions, and can address questions around the role of climate-system internal variability (Poschlod et al 2020, Wood et al 2021).
To address these issues, our study centers on considering how increasing heat and precipitation shape the likelihood of four impactful combinations of hazards: (a) multi-day extreme heat that affects human health (Baldwin et al 2019); (b) multi-day extreme precipitation that heightens flood risk and strains infrastructure; (c) interannual volatility between drought and pluvial years that complicate water management and accentuate the risk of wildfires and fire-following mudslides (AghaKouchak et al 2020); and (d) simultaneous heat and drought in breadbasket regions that limit food availability or accessibility (Puma et al 2015, Anderson et al 2019). We do so using a large model ensemble to robustly characterize spatial and temporal interaction of hazards, globally and in particular regions, and consider the implications for socio-environmental resilience, including possible disaster-management tipping points. Our principal objective is to discern where increases in risk are the likeliest, for which types of hazards, and whether these increases are robust across the model ensemble.
2. Data and methods
2.1. Temperature and precipitation data
Model data come from the Max Planck Institute Grand Ensemble (MPI-GE), consisting of 100 fully-coupled simulations of the Max Planck Institute for Meteorology Earth System Model, version 1.1 (MPI-ESM; Maher et al 2019). We use data representing daily precipitation and daily-maximum near-surface (2 m) temperature for two 30 year periods: 1991–2020 (current) and 2070–2099 (RCP4.5 forcing scenario). Under RCP4.5, MPI-GE exhibits approximately 2.25 °C of global mean warming above pre-industrial levels by 2100 (Suarez-Gutierrez et al 2020). Our results focus on global land areas between 60° N and 60° S, analyzed using regions slightly adapted from those in the IPCC SREX report (figure S1 available online at stacks.iop.org/ERL/17/035005/mmedia; IPCC 2012).
2.2. Extreme-event definitions: temporal compounding
We analyze several types of extreme events, whose definitions are designed around characteristics shown to be important for potential compounding impacts (Swain et al 2018, Vant-Hull et al 2018, Anderson et al 2019, Ralph et al 2019). We primarily consider temporal compounding—events whose impacts are exacerbated by temporal clustering or by the sequence in which they occur. Extreme-heat and extreme-precipitation days are defined at the gridcell level as those exceeding the 95th percentile of daily values (considering all seasons together) of daily-maximum temperature and daily-total precipitation. We consider compounding to be three consecutive extreme days, following approaches in the heatwave literature (Perkins-Kirkpatrick and Lewis 2020); we calculate compounding at each gridcell and then compute regional sums. Baseline compounding frequency therefore varies among regions. Our results are broadly insensitive to the selected definitions (figures S2 and S3). For precipitation, we additionally evaluate compounding over an interannual timescale: we define drought years (pluvial years) as water years that fall below (exceed) the 10th (90th) percentile of total precipitation. Volatility is defined as the probability that, given a drought year, there is a pluvial year either one year before or after (Swain et al 2018).
2.3. Extreme-event definitions: spatial compounding
We also consider spatial compounding, using the example of maize-breadbasket failures based on empirical temperature and precipitation thresholds that capture major negative crop effects (generally, from heat and drought) (Gaupp et al 2019, 2020). Compounding occurs when multiple breadbaskets experience failures (defined as yields being in the lowest quartile) in the same growing season, with the Southern Hemisphere summer considered simultaneous with the subsequent Northern Hemisphere summer (Gaupp et al 2020). This compounding is often proximately caused by a common dynamical driver such as Rossby wavetrains of particular wavelength and phase (Kornhuber et al 2020). To account for model biases when applying empirical thresholds to modeled values, we use equivalent quantiles to the observations, rather than equivalent numerical thresholds. We define Central North America, Northeast Brazil, Southern South America, Central Europe, East Asia, and South Asia as maize-breadbasket regions; these represent about 55% of global maize production, and contain the six smaller provincial or national regions used by Gaupp et al (2020). As a result, an assumption of our analysis is that the Gaupp et al provincial-scale anomalies for which the thresholds were defined are represented well by the model's temperature and precipitation anomalies at subcontinental scale. Based on CO2-fertilization effects (Deryng et al 2014), we additionally incorporate two hypothetical scenarios where crop failure occurs at levels 0.5 °C warmer and 5% drier (1.0 °C warmer and 10% drier) than in observed data. This exercise is intended primarily to demonstrate the sensitivity of potential changes in multiple breadbasket failure to possible plant-physiological responses.
2.4. Change analysis and model-bias evaluation
For each event type (multi-day compounding of extreme heat and extreme precipitation; interannual precipitation volatility; and heat-drought spatial compounding), we calculate its occurrences for all land grid cells in each ensemble member. Both current (1991–2020) and future (2070–2099) periods are evaluated against thresholds defined using current data, and percent changes are given as the difference between the period means. Note that this choice of reference makes our reported changes somewhat smaller than in literature based on earlier periods. To quantify the warming-only contribution to the changes, we compare the compounding frequency when evaluating future data against the current 95th percentile versus against the future 95th percentile. The remainder we then call the nonlinear contribution, reflecting the combined effects of changes in circulation, land-surface feedbacks, and any other processes that alter the likelihood of compounding (not the likelihood of extremes per se).
Although we focus on projected changes, for a greater understanding of model realism we also evaluate temperature biases using the Modern-Era Retrospective Analysis for Research and Applications, Version 2 (MERRA2; Gelaro et al 2017), and precipitation biases using the Climate Hazards group Infrared Precipitation with Stations (CHIRPS; Funk et al 2015). These evaluations are included alongside the main results in each figure. (Note that CHIRPS is available only between 50° N and 50° S.) Among single-model large ensembles, MPI-GE offers one of the most adequate representations of the observed historical interannual variability, forced changes, and extremes in temperature (Baehr et al 2015, Suarez-Gutierrez et al 2021) and precipitation (Wood et al 2021). The large ensemble size is a key ingredient in this adequacy, with modeled interannual variability being much less likely to include the observed value when a smaller ensemble is used (Wood et al 2021). Considering the novelty and breadth of our topic, we thus argue that MPI-GE is a useful tool for producing initial conclusions which warrant refinement in future studies using other large ensembles and multi-model ensembles.
3. Results
We find that in the current baseline (1991–2020), 0%–3% of days are part of an extreme-heat sequence (i.e. three or more such days consecutively). Such compounding occurs most often in tropical regions with distinct dry seasons, such as Northeast Brazil, and in mid-latitude regions subject to long-lasting anticyclones, such as Central Europe (Suarez-Gutierrez et al 2020) (figure 1(a)). The model is able to capture inter-regional differences from reanalysis, but overestimates compounding frequency in regions including tropical South America.
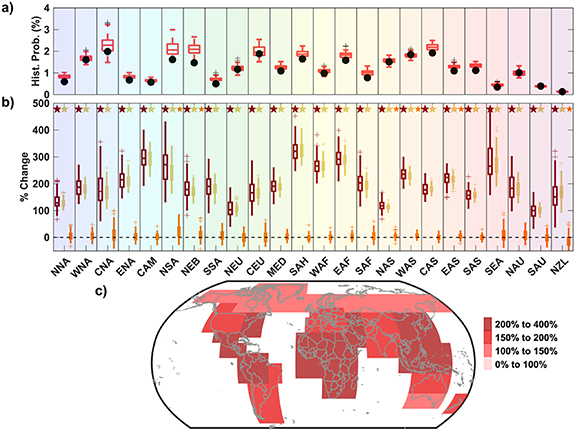
Figure 1. Temporally compound extreme heat and its projected changes. (a) Current probability of an extreme-heat day being part of a sequence of three or more consecutive extreme-heat days, from MPI-ESM (boxplots) and MERRA2 (circles). (b) Percent change between 1991–2020 and 2070–2099 in compound extreme-heat occurrence for each region (dark red), evaluated over 100 ensemble members. Warming-only (light brown) and nonlinear (orange) contributions are also shown. Large (small) stars indicate if >95% (67%) of ensemble members agree on the sign of the change. Background colors for each region match those in figure S1, where full region names are provided. (c) Median percent change in compound extreme heat. In regions without hatching, at least 67% of ensemble members agree on the sign of the change.
Download figure:
Standard image High-resolution imageLooking to the future, we find large projected changes between 1991–2020 and 2070–2099 in the occurrence of temporally compound extreme heat, with all regions at least doubling in frequency (figures 1(b) and (c)). These multi-day extreme-heat increases are greatest in the tropics, consistent with their low day-to-day variability, while relatively smaller increases are expected at higher latitudes . Across regions, a large majority of changes in the frequency of temporally compound extreme heat can be explained by the overall increase in the number of extreme-heat days, with a slight enhancement by nonlinear effects (see Methods) in northern South America (figure 1(c)).
Current temporally compound extreme precipitation varies in frequency from almost zero near storm tracks (Eastern North America and New Zealand) to about 0.5% of all days in subtropical regions such as Southern Africa and Northern Australia (figure 2(a)). MPI-GE deviates considerably more from observations for compound extreme precipitation than for compound extreme heat, with its entire ensemble-member spread being above the reanalysis value for arid regions across Africa and Asia, and below the reanalysis value in several others.
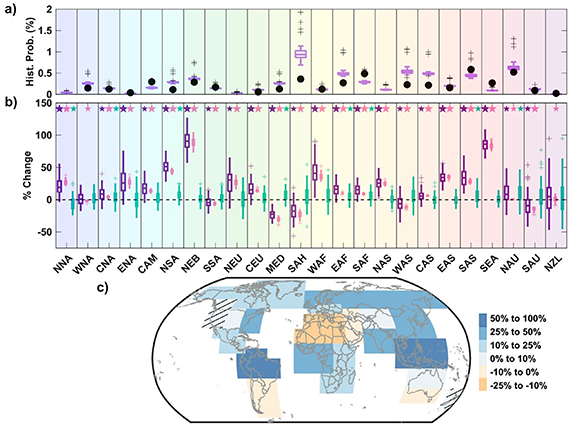
Figure 2. Temporally compound extreme precipitation and its projected changes. (a) Current probability of an extreme-precipitation day being part of a sequence of three or more consecutive extreme-precipitation days, from MPI-ESM (boxplots) and CHIRPS (circles), the latter spanning only 50° N–50° S. (b) As in figure 1(b) but for compound extreme precipitation (purple), with warming-only (pink) and nonlinear (teal) contributions also shown. Large (small) stars indicate if >95% (67%) of ensemble members agree on the sign of the change. (c) Median percent change in compound extreme precipitation. In regions without hatching, at least 67% of ensemble members agree on the sign of the change.
Download figure:
Standard image High-resolution imageIn future projections, three-day extreme wet periods are expected to increase sharply, although the magnitude of the change is less than for extreme heat (figure 2(b)). The largest increases (>25%) and the highest likelihoods of enhancement by nonlinear effects are concentrated in tropical wet/dry climates, including Northeast Brazil, West Africa, and Southeast Asia (figure 2(a)), agreeing broadly with findings from multi-model ensembles (Knutti and Sedláček 2013, Tabari et al 2021) and previous regional studies (Ali et al 2019). Arid and semi-arid regions in the subtropics will likely experience little change or decreases (figure 2(a); Seneviratne et al 2012). Nearly all of the regional changes are significant across ensemble members. The changes in compounding are again largely explained by the shifting distribution of single-day precipitation, but are enhanced by nonlinear effects in certain semi-arid regions, among them the Central US, the Mediterranean basin, Southern Africa, and South Asia.
Drought-pluvial volatility occurs with a frequency of 1%–2% when aggregated across all years and grid cells within a region (figure 3(a)). Frequencies tend to be slightly lower in arid subtropical regions, with MPI-ESM not capturing this pattern well.
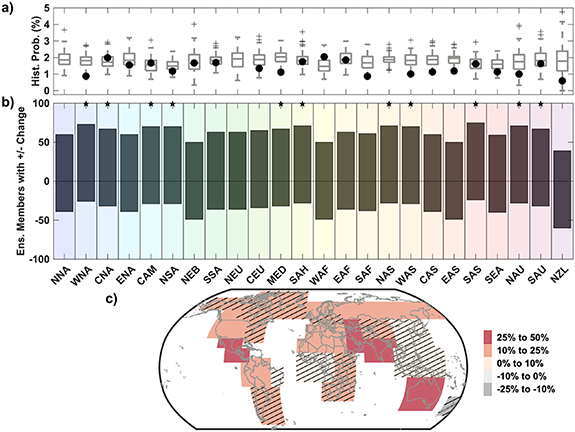
Figure 3. Drought-pluvial volatility and its projected changes. (a) Current probability of drought and pluvial conditions in consecutive water years, from MPI-ESM (boxplots) and CHIRPS (circles), the latter spanning only 50° N–50° S. (b) Number of ensemble members (n = 100) projecting increases (height of bar above 0) and decreases in drought-pluvial volatility between 1991–2020 and 2070–2099 for each region. Stars indicate that >67% of ensemble members agree on the sign of the change. (c) Projected median percent change in drought-pluvial volatility. In regions without hatching, at least 67% of ensemble members agree on the sign of the change.
Download figure:
Standard image High-resolution imageEnsemble-member agreement on changes in drought-pluvial volatility is much more limited than for day-to-day temporally compound extremes; where significant, frequency increases of 10%–25% are expected (figures 3(b) and (c)). In several predominantly subtropical regions, the frequency of drought-pluvial volatility is projected to increase more than 25% and with the agreement of more than two-thirds of ensemble members (figure 3). These regions are Central America, Western Asia, South Asia, and northern and southern Australia, in addition to Western North America (+ ∼20%), which was highlighted by Swain et al (2018).
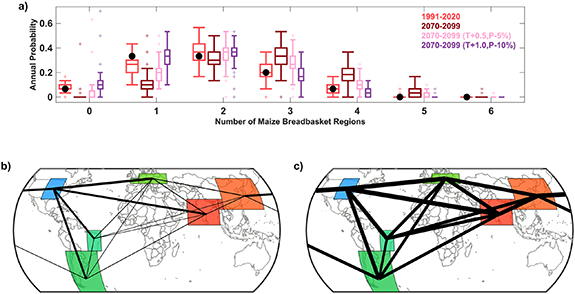
Considering spatial compounding via multiple-breadbasket failure, we find that the probability distributions associated with this outcome are well-represented in the model, with the reanalysis near the center of the ensemble-member spread for high-impact events (figure 4(a)). In the future scenario there is a distinct upward shift in the probability of three or more maize breadbaskets simultaneously experiencing conditions historically associated with crop failure (figure 4(a)). Across ensemble members, the chance of a year having ⩾3 breadbasket failures doubles from 28.7% to 57.3%, while 5-breadbasket-failure years increase in frequency from 0.6% to 5.4%. The currently unprecedented 6-breadbasket-failure scenario has a future occurrence probability of 0.5%. A CO2-fertilization effect whereby crop failures occur at 0.5 °C warmer and 5% drier conditions would substantially, although not entirely, alleviate these increases in risk. Under the no-fertilization future scenario, the Central US is the region most likely to be included in years with 3 breadbasket failures; cross-regional comparisons connect it most closely to Central Europe (figure 4(b)). In years with five breadbasket failures, probabilities of inclusion are similar across regions because most are included by definition (figure 4(c)).
Figure 4. Changing risk of multiple-breadbasket failure for maize. (a) Probability, evaluated over the 100-member MPI-GE, of a year having the stated number of breadbaskets experiencing a failure. Scenarios are current (light red), future (crimson), and two representing potential future CO2-fertilization effects: one in which crop failure occurs at levels 0.5 °C warmer and 5% drier than current (pink), and another at 1.0 °C warmer and 10% drier (purple). Circles show equivalent probabilities using reanalysis. (b) For years with three breadbasket failures, line widths are proportional to the probability (varying here from 9% to 44%) that the two regions connected are among those experiencing failures. Region colors are as in figure S1. See figure S4 for equivalent using reanalysis. (c) As in (b) but for years with five breadbasket failures (probabilities here vary from 45% to 86%).
Download figure:
Standard image High-resolution image
4. Discussion
Societal resilience can be challenged through intensification of hazards or an increase in their spatiotemporal proximity, which degrades the ability of human and natural systems to endure and recover (Balch et al 2020, Thonicke et al 2020). Hence, our results consist of two flavors: firstly, we show that rising levels of extreme heat and precipitation in a warmer world will nearly everywhere lead to a greatly increased likelihood of persistent and concurrent extremes, mainly driven by background warming; secondly, we provide evidence of enhanced interannual hydrological volatility in a number of regions. In this section we consider the context, uncertainties, and implications of these findings in greater detail.
For both extreme heat and precipitation, our results largely stem from the thermodynamic effects of global-mean warming (Vogel et al 2019, Robinson et al 2021). We find the nonlinear contribution is small and regionally varying; however, this remainder may be substantially model-dependent and to some degree affected by the regional aggregation. One of the few previous studies on temporal compounding of extreme heat, using a different model, found that warming alone can mostly explain future compounding, but that there is less compounding than expected in regions including Central Europe and northern South America, and more than expected in Southeast Asia (Baldwin et al 2019). Our results agree for Southeast Asia but differ elsewhere, highlighting a need for examining model-specific processes to resolve such discrepancies. We also identify northern South America as a hotspot where both compound heat and precipitation extremes are enhanced beyond thermodynamic expectations. The considerable uncertainty among ensemble members showcases the large effect of internal variability, underscoring the value of large ensembles (which sample this internal variability) for analyzing changes in extreme events and robustly judging their significance. Although recent work has found observed increases in simultaneous extreme heat in the Northern Hemisphere mid-latitudes which are in part attributable to circulation changes, the thermodynamic effect remains the dominant factor in such trends (Rogers et al 2021).
The increases we find in the probability of interannual drought-pluvial volatility extend well beyond the Western US, where the phenomenon was first identified, presenting a major risk for natural systems and human infrastructure (Swain et al 2018). Our results can largely be understood by reference to studies showing increasing interannual precipitation variability, in regions including monsoonal Asia and much of the mid- and high latitudes in the Northern Hemisphere (Wood et al 2021). Drought-pluvial volatility frequency in the Western US varies substantially due to internal variability (McKinnon and Deser 2021), and observed trends are also highly variable across the globe (He and Sheffield 2020), factors which likely explain the lack of ensemble-member agreement on the sign of the change in the majority of regions. In these findings, we build on studies that separately consider drought and flood risk (Tabari et al 2021). Including the evapotranspirative effects of increasing global temperatures would be an important extension of our analysis.
Heat and drought conspire to substantially affect crop health and food security (Lesk et al 2016). Simultaneous extreme weather in breadbaskets is a particularly high-impact scenario, as this can trigger global food shortages and humanitarian crises (Bren d'Amour et al 2016, Anderson et al 2019). We find that the empirical physical thresholds developed by Gaupp et al (2020) indicate a major expected increase in maize failures (Tigchelaar et al 2018), with the ensemble spread providing a refined sense of the uncertainty accompanying this result. Just two ensemble members exhibit five or more breadbasket failures in a single year in the current period, while by 2100 under RCP4.5 warming more than half indicate a non-zero probability for this outcome. Intensifying concurrent heat and drought are a major driver of this virtually-assured increase in risk (Yuan et al 2019); only in South and East Asia does precipitation increase sufficiently to counteract some of the heat effects (figure 2(b); Gaupp et al 2019). We also highlight that, for maize, the Central US is the most failure-prone region, and that Northeast Brazil is the region with which it is least correlated—potentially informative insights for risk reduction, particularly if our approach is repeated for other crop types. Our results indicate a most-likely annual outcome of three breadbasket failures by 2070–99, while Gaupp et al (2019) using the HadAM3P atmosphere-only model and similar evaluation periods, found a 54% likelihood of five annual breadbasket failures and only a 3% likelihood of three or fewer. However, MPI-ESM shows lower likelihoods also in the historical period. The discrepancy between models is likely due to a combination of (a) HadAM3P's neglect of ocean-related processes, which tends to result in high-biased and overconfident changes in extremes (Fischer et al 2018); (b) differences in temperature-precipitation interactions; and (c) differences in the behavior of climate extremes between Gaupp et al (2019)'s subnational regions and the larger ones used in this study.
A portion of our study's value comes from its usage of a large ensemble of a fully-coupled earth-system model. The earth-system part means that it has a comprehensive representation of vegetation cycles and biogeochemistry, and the fully-coupled part means that it captures long-memory effects in the climate system, unlike atmosphere-only models. As a result, information from oceans or soils can affect weather and climate in the model even in distant regions (as it does in reality); having this contribution included is especially important here because we look at processes that may occur separately but whose effects come together in time or space to produce a hazard.
While our approach builds upon previous work, it also has several caveats. Perhaps most notably, the calculated changes rely on the timing of extremes in a single model, which hinges on the representation of the general circulation and of processes in subsystems such as the atmospheric boundary layer and the land surface; these are particularly uncertain when considering projections. A comprehensive uncertainty analysis would incorporate multiple different models, parameterizations, and sensitivity tests, and could well result in a larger spread than described here. We also consider only three-day cumulative events for extreme heat and precipitation, although both floods and droughts can be related to conditions integrated over weeks or months (Cao et al 2020). Furthermore, we aggregate variables across large regions to increase the interpretability of our results, but this also limits the applicability of our narrative to any one location and presents another opportunity for refinement.
Future work on variables other than temperature and precipitation, and on multivariate events such as storms or humid heat, would fill in major gaps for holistic risk assessments. At subseasonal and longer timescales, multi-member ensemble prediction systems exist that may help to anticipate periods of increased likelihood of compound events, particularly for heat and precipitation/drought (Mariotti et al 2020). To be truly useful for extremes, these require the development of improved methods to predict widespread or persistent mesoscale anomalies rather than period-mean values.
Previous studies on future extreme weather risks often highlight statistical changes without addressing spatiotemporal characteristics such as concurrence and sequences. Our work examines several different types of hazards related to high-end impacts, highlighting how changes in the climate system may lead to much greater compound effects. Such outcomes can prompt the crossing of system tipping points, a risk often heightened at the regional scale by social, political, and economic crises (Wunderling et al 2021). Interactions across an array of connected elements, from physical hazards to exposure and vulnerability characteristics, thus warrant close attention in future studies.
5. Conclusions
The spatiotemporal proximity of climate hazards can amplify their joint impacts. Such compounding interaction, via both physical and societal mechanisms, is often missed in traditional extreme-event analysis and projections. However, for the design of effective disaster-response plans and adaptation measures to future extreme weather events, it is crucial to account for the temporal and spatial aspects of extremes and the implications of their co-occurrence.
In this study, we show that high-impact extreme temperature and precipitation events are expected to occur more closely together nearly everywhere. This means that the spatial co-occurrence and temporal sequences of these extremes will likely intensify, respectively putting pressure on the global food system and on ecosystems and populations across a range of climate regimes. Our approach of using a large ensemble of fully-coupled model simulations to investigate the statistics of compound events allows us to study confluences of rare events represented dynamically rather than statistically, and to isolate uncertainty related to internal climate variability. As a result, we can more confidently identify significant changes, relative to previous studies.
In broadly considering precipitation and temperature extremes that are likely to have societally important ramifications, we aim to provide a basis for several strands of continuing work. These include integrated sociophysical model development, comparative regional assessment of key processes, and identification of chokepoints in the global economy and hotspots of human vulnerability. In all of these areas, a clear understanding of tail-end risks to societal resilience is essential for properly incorporating them into operational systems that truly reflect climate-aware adaptation.
Acknowledgments
C R's, M P-C's, and D E W's portion of the work was carried out at the Jet Propulsion Laboratory, California Institute of Technology, under a contract with the National Aeronautics and Space Administration (80NM0018D0004). L S-G was supported by the Max Planck Society for the Advancement of Science and by the German Ministry of Education and Research (BMBF) under the ClimXtreme project DecHeat (Grant No. 01LP1901F). We acknowledge Sebastian Brune, Mikhail Dobrynin, and Johanna Baehr for producing and processing the current and RCP4.5 MPI-ESM Grand Ensemble simulations used here, and the German Climate Computing Center (DKRZ) for providing the necessary computational resources.
Data availability statement
The data that support the findings of this study are openly available at the following URL/DOI: https://esgf-data.dkrz.de/projects/mpi-ge/. Further information on the simulation details and how to download MPI-GE output can be found here: www.mpimet.mpg.de/en/grand-ensemble/. MERRA2 reanalysis is available at https://disc.gsfc.nasa.gov/datasets?project=MERRA-2, and CHIRPS data can be found at www.chc.ucsb.edu/data/chirps.
Conflict of interest
The authors declare no conflicts of interest.