

Abstract
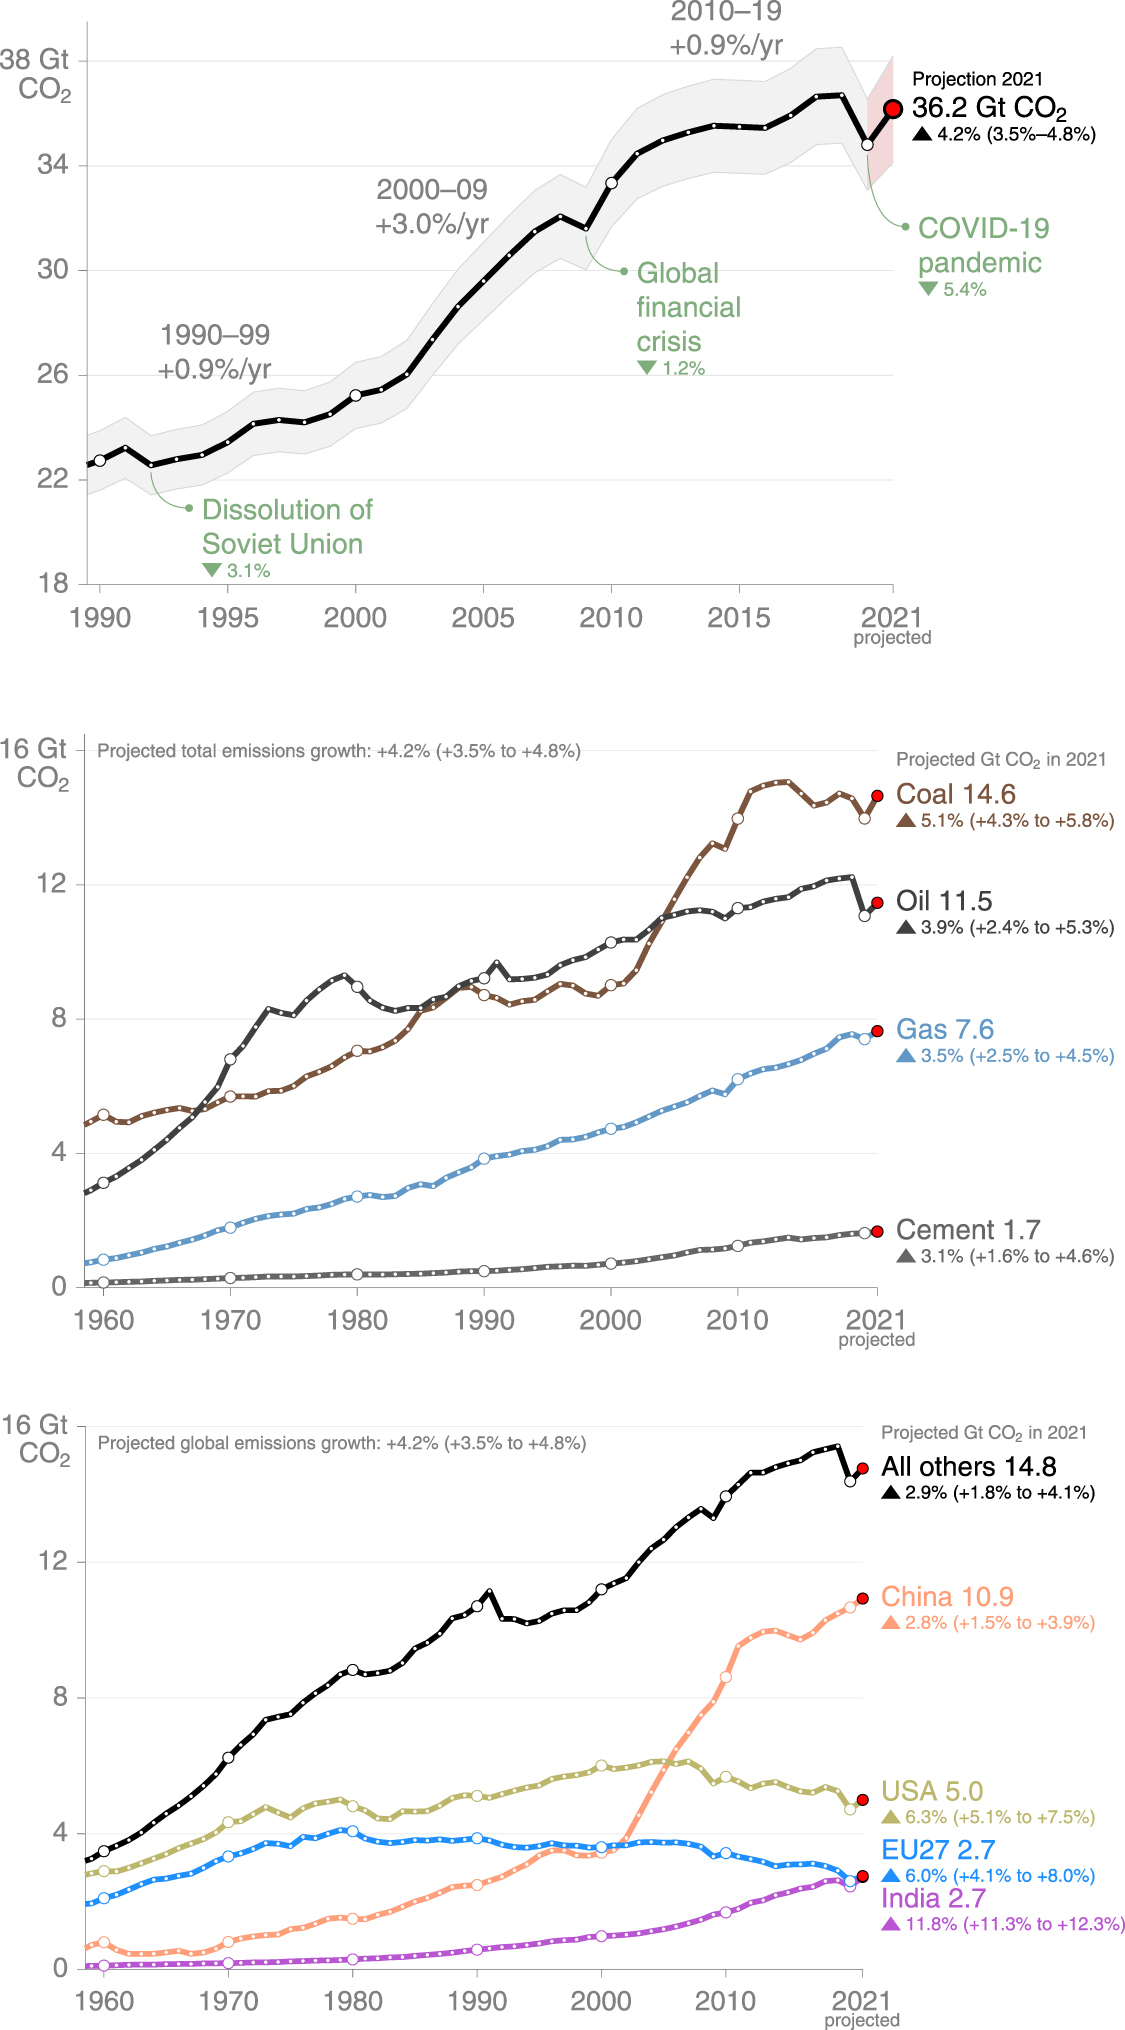
Fossil CO2 emissions in 2021 grew an estimated 4.2% (3.5%–4.8%) to 36.2 billion metric tons compared with 2020, pushing global emissions back close to 2019 levels (36.7 Gt CO2).
Export citation and abstract BibTeX RIS

Original content from this work may be used under the terms of the Creative Commons Attribution 4.0 license. Any further distribution of this work must maintain attribution to the author(s) and the title of the work, journal citation and DOI.
1. Introduction
Prior to the emergence of COVID-19, average global growth in fossil CO2 emissions had slowed to 0.9% annually during the 2010s (2010–2019), with global emissions in 2019 about the same as those in 2018 (∼37.7 Gt CO2 in both years; Jackson et al 2018, Friedlingstein et al 2020, 2022). Much of the decadal slowdown in emissions growth was attributable to the substitution of coal with gas and renewables in the electricity sector (Jackson et al 2016, 2019, Friedlingstein et al 2019, Peters et al 2020), and induced in part by the growing numbers of climate change laws worldwide (Eskander and Fankhauser 2020). Compared to the 2010s, average annual growth of global fossil CO2 emissions was 3.0% in the 2000s, 0.9% in the 1990s, 1.6% in the 1980s, and 3.2% in the 1970s (Friedlingstein et al 2020, 2022).
The years 2020 and 2021 revealed unprecedented disruptions to global economic activity and fossil carbon dioxide (CO2) emissions attributable to the world's responses to the COVID-19 pandemic. Based on data and methods in Friedlingstein et al (2022), we estimate that global fossil CO2 emissions in 2020 decreased 5.4%, from 36.7 Gt CO2 in 2019 to 34.8 Gt CO2 in 2020, an unprecedented decline of ∼1.9 Gt CO2. Global fossil CO2 emissions in 2021 rebounded an estimated 4.2% (3.5%–4.8%, all ranges ±1 std. dev.) compared to 2020 to 36.2 (35.9–36.4) Gt CO2, returning close to 2019 emission levels of 36.7 Gt CO2. Emissions in China were 4.2% higher in 2021 than in 2019 (reaching 10.9 Gt CO2) and similarly higher in India (a 3.8% increase in 2021 relative to 2019, reaching 2.7 Gt CO2). In contrast, projected 2021 emissions in the United States (5.0 Gt CO2), European Union (2.7 Gt CO2), and rest of the world (14.8 Gt CO2, in aggregate) remained below 2019 levels. For fossil fuels, we estimate CO2 emissions from coal in 2021 rebounded above 2019 levels to 14.6 Gt CO2, primarily because of increased coal use in India and China, and will remain only slightly (2.8%) below their previous peak in 2014. Emissions from natural gas use also rose above 2019 levels in 2021 to 7.6 Gt CO2, continuing a steady trend of rising gas use that dates back at least 60 years. Only CO2 emissions from oil remained well below 2019 levels in 2021 (11.5 Gt CO2). Emissions in the power and industry sectors increased global fossil CO2 emissions the most in 2021, with emissions from surface transport and aviation still below 2019 levels. The rapid rebound in global fossil CO2 emissions as economies recover from the COVID-19 pandemic reinforces the need for immediate and global coherence in the world's response to climate change.
2. Fossil carbon emissions in 2020
Confinement measures in response to the COVID-19 pandemic reduced social and global economic activity and CO2 emissions substantially (Diffenbaugh et al 2020, Forster et al 2020, Friedlingstein et al 2020, Le Quéré et al 2020, Liu et al 2020, 2021, IEA 2021a). At the time of peak confinement in a given country, emissions decreased by one quarter (26%) on average (Le Quéré et al 2020). Daily global fossil CO2 emissions decreased 17% at peak confinement in April of 2020 (compared to 2019), and daily emissions decreased up to 75% in aviation, 50% in road transportation, and 35% in industry (Le Quéré et al 2020). Almost half of the decline in total annual fossil CO2 emissions in 2020 was attributable to reductions in transport activity (Le Quéré et al 2020, Liu et al 2020). This large decrease in economic activity and global emissions also reduced aerosol amounts (particularly over southern and eastern Asia) and increased surface shortwave radiation levels but apparently did not affect near-surface temperatures or rainfall globally (Jones et al 2021).
The economic disruption of COVID-19 in 2020 altered emissions in ways that varied by country, sector, and fuel type and that may have accelerated the transition to renewables. Global fossil CO2 emissions in 2020 decreased from 36.7 Gt CO2 in 2019 to 34.8 Gt CO2 in 2020, a decline of 5.4% (and comparable to the International Energy Administration's estimate of a 5.8% decline in 2020; IEA 2021a). China was among the few large countries whose emissions increased in 2020 compared with 2019 (figure 1), despite a large but brief drop attributable to COVID-19. The increase in China's total emissions was attributable primarily to its power and industry sectors, where emissions increased by ∼55 and 157 Mt CO2, respectively, in 2020 compared to 2019, according to preliminary estimates (Liu et al 2020). Most of this increase took place after April 2020 in the more industrialized coastal provinces of China (Zheng et al 2020), coinciding with the reopening of factories after the initial COVID-19 lockdown. Most other sectors and large countries or regions (figure 1) showed substantial reductions in CO2 emissions from 2019 to 2020 (Friedlingstein et al 2022).
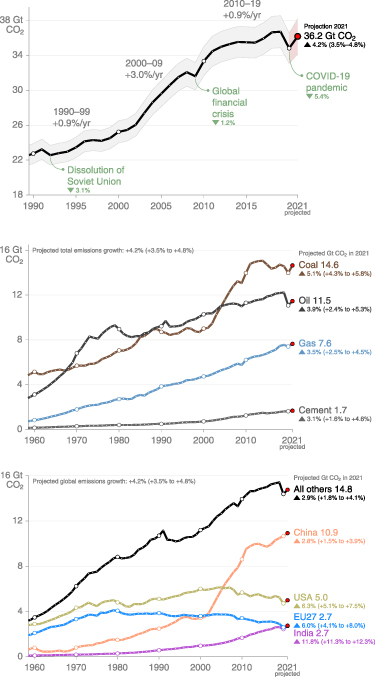
Figure 1. Fossil CO2 emissions globally for 1990 through 2020 (top panel), with projections for 2021 shown in red in each panel, and fossil CO2 emissions by fuel type (middle panel) and country or region (bottom panel) for 1959 through 2020 (based on data in Friedlingstein et al 2021 and 2022). Percentage ranges are ±1 std. dev.
Download figure:
Standard image High-resolution imageFor fuels globally in 2020, coal use fell 6.2 EJ to 151.4 EJ yr−1, a 4% decline compared to consumption in 2019 (figure 2). Petroleum consumption decreased even more (9.6%) in 2020—an 18.2 EJ drop to 173.7 EJ yr−1. Gas consumption fell a modest 2.1% to 137.6 EJ. In contrast, wind, solar, and other renewable sources jumped 10% in 2020 to 31.7 EJ, despite a substantial 25 EJ decline in global energy demand attributable to COVID-19 (figure 2).
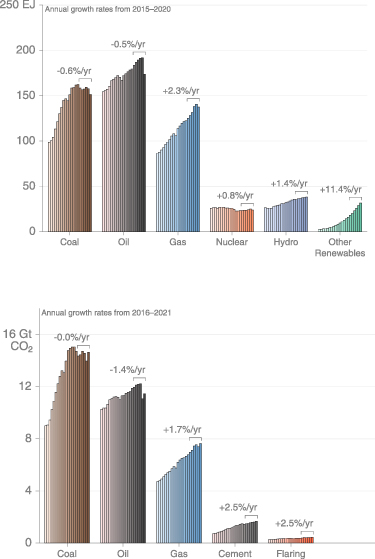
Figure 2. Top panel: annual global energy consumption (EJ) by fuel source from 2000 through 2020 (BP 2021), with average annual growth rates for each fuel shown under brackets for the period 2015 through 2020. Bottom panel: fossil CO2 emissions by fuel type (coal, oil, and natural gas) plus emissions from cement production and flaring; note that these emissions estimates do not include methane leakage during extraction and use. Average annual growth rates for each fuel shown under brackets for the period 2016 through 2021.
Download figure:
Standard image High-resolution image3. Fossil carbon emissions in 2021
For 2021, our preliminary estimates are that global fossil CO2 emissions compared with 2020 levels rebounded by 4.2% (3.5%–4.8%) to 36.2 Gt CO2, nearly reaching 2019 emission levels of 36.7 Gt CO2 (figure 1) (Friedlingstein et al 2022). CO2 emissions in 2021 are expected to have risen compared to 2020 in every country and region. Our 2021 fossil CO2 emissions projections are based on energy data for coal, oil and gas for the first 9 to 12 months of the year for China, USA, EU27 + UK, and India, and a gross domestic product (GDP)-based projection for the Rest of the World. Full details are provided in Friedlingstein et al (2022).
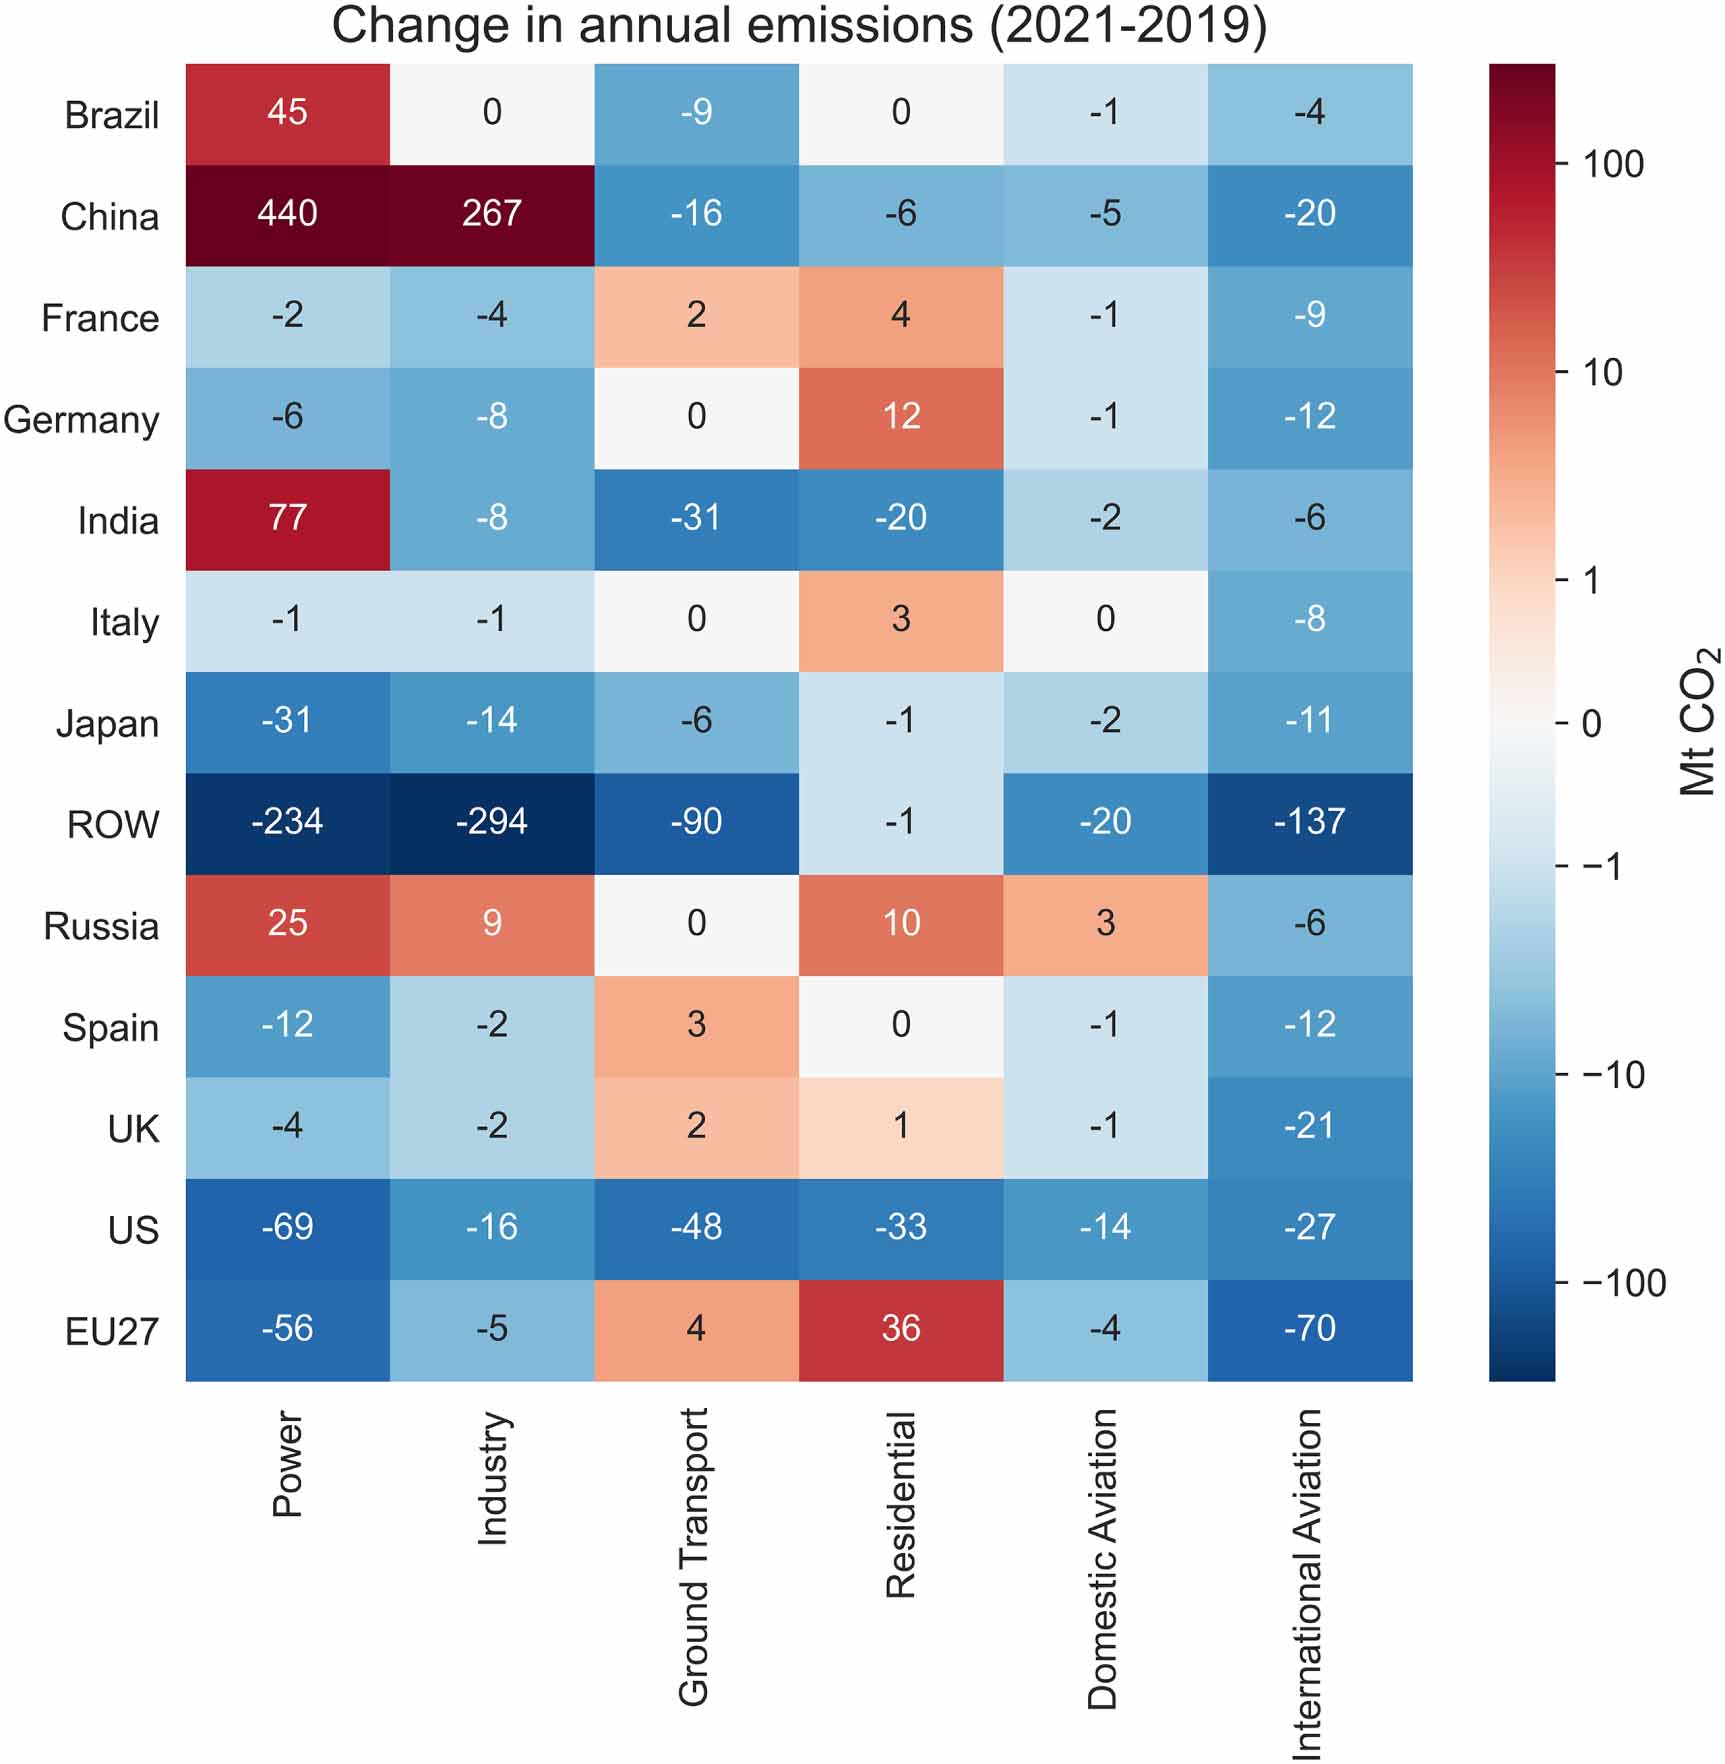
Fossil emissions for China in 2021 are estimated to have been 10.9 Gt CO2, an increase of 2.8% (range 1.5%–3.9%) compared with 2020 emissions and 4% higher than in 2019 (figure 1). The largest increases across sectors and countries in 2021 compared with 2019 are found in China's power and industrial sectors (440 and 267 Mt CO2, respectively; figure 3). For India, estimated fossil CO2 emissions in 2021 are 2.7 Gt CO2, a substantial rebound of 11.8% (11.3%–12.3%) compared with 2020, and also ∼4% above its 2019 emissions (figure 1). In contrast, fossil CO2 emissions for the United States and European Union in 2021 remain below 2019 levels, despite substantial increases relative to 2020 of 6.3% (5.1%–7.5%) and 6.0% (4.1%–8.0%), respectively (figure 1). Our 2021 estimates reflect long-term background trends of increasing CO2 emissions for India and decreasing CO2 emissions for the United States and European Union. For China, in contrast, COVID-19 recovery may have sparked growth in CO2 emissions, whereas for the Rest of the World (in aggregate), it may act to dampen the recent growth in emissions (figure 1).
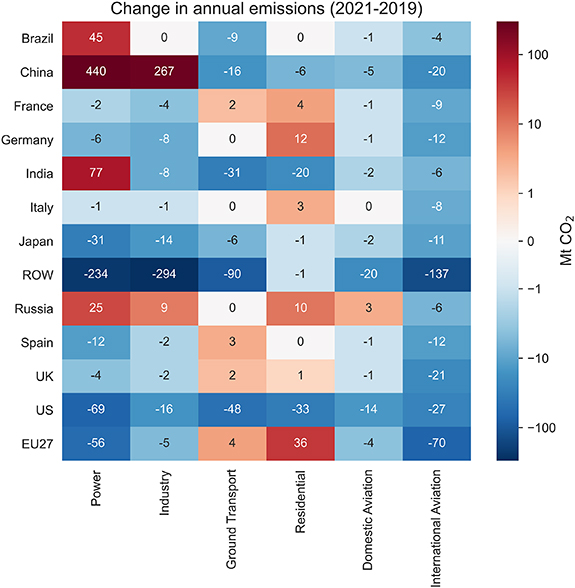
Figure 3. Change in fossil CO2 emissions (Mt CO2) by sector and country for the difference between year-end 2021 and 2019 emissions (Mt CO2) (data from Carbon Monitor, as described in Liu et al 2020).
Download figure:
Standard image High-resolution imageFor fuels in 2021, global CO2 emissions from coal rebounded above 2019 levels to 14.6 Gt CO2 (figure 1), primarily because of increased coal use in India and China (figure 4) and will remain only slightly (2.8%) below the global peak in 2014 (figure 1). Coal-based emissions in the EU and US rose about 1% in 2021 compared to 2020 but remained well below 2019 levels (figure 4). Global CO2 emissions from natural gas use in 2021 (7.6 Gt CO2) rebounded above 2019 levels (figure 1). Only CO2 emissions from oil remained well below 2019 levels in 2021 at an estimated 11.5 Gt CO2 (figures 1 and 2).

Figure 4. Annual fossil emissions (Gt CO2) in China, India, EU27, and United States by fuel type and industry (i.e. cement production). The projected emissions growth numbers for 2021 (in %, ±1 std. dev.) are presented relative to 2020 emissions.
Download figure:
Standard image High-resolution imageThe distribution of the 2021 rebound in fossil CO2 emissions was heterogenous across countries and sectors (figures 3 and 4). Beyond the increases in China's power and industrial sectors in 2021 discussed above, other sectors that also surpassed 2019 levels included power in India and Brazil (77 and 45 Mt CO2 higher, respectively), residential emissions in the European Union (36 Mt CO2 higher), and all sectors in Russia other than ground transport and international aviation (41 Mt CO2 higher in total) (figure 3). These increases are balanced by sustained reductions in many other sectors, primarily international aviation emissions, which are still well below 2019 levels in all major countries and regions (figure 3). The rebound was also heterogeneous across time, with a sharp reduction in growth in China during the second half of 2021.
4. The clean energy transition
Rapidly increased market penetration of renewables that displace fossil fuels is critical for limiting climate change in the 1.5 °C–2 °C range (figure 2). Although most 1.5 °C mitigation scenarios (e.g. van Vuuren et al 2018) require the substitution to no- or low-carbon sources for almost all energy infrastructure by 2050, this transition is not currently occurring quickly enough to limit warming to 1.5 °C (IPCC 2018). Global gas use is rising particularly quickly. Despite the temporary effects of COVID-19 to suppress energy demand and supply, gas use and its associated CO2 emissions rose almost 2% a year on average for the 5 years period of 2016–2021 (figures 1 and 2). If past trends continue, fossil CO2 emissions associated with gas use over the next few years are likely to surpass 8 Gt CO2 yr−1. The continuing rise in natural gas use is also problematic for climate because methane leakage associated with greater extraction and use rises, too (e.g. Hmiel et al 2020, IEA 2021b), emissions that are unaccounted for when examining only fossil CO2. Just as for coal and oil (figures 1 and 2), carbon emissions from global gas use must drop quickly if global temperatures are to stabilize below increased thresholds of 1.5 °C or 2 °C (Davis et al 2019).
Climate change was revealed in many ways in 2021. The average global surface temperature in 2021 was about 1.11 (± 0.13) °C above average pre-industrial (1850–1900) levels (WMO 2022). Human-induced climate change is already increasing the frequency and intensity of weather and climate extremes in virtually every region of the globe (IPCC 2021); the United States, for instance, experienced 20 billion-dollar weather disasters in 2021, costing an estimated $145 billion in damages and ∼688 lives (NOAA 2022). Five years after the Paris Agreement, the emissions gap continues to grow: global emissions need to be 15 billion tons CO2e lower (for all greenhouse gases, not just CO2) than current nationally determined contributions for a 2 °C goal, and 32 billion tons CO2e lower for the 1.5 °C goal (WMO 2022). Progress in reducing emissions is occurring, albeit slowly (Le Quéré et al 2019, Eskander and Fankhauser 2020, 2021). Fossil CO2 emissions significantly decreased in 23 countries during the decade 2010 through 2019; for the 5 years period of 2015 through 2019, fossil CO2 emissions decreased in 64 countries globally (Friedlingstein et al 2022).
The rapid rebound in global fossil CO2 emissions in 2021 (returning close to 2019 levels) we estimated to be 4.2% (similar to the 4.8% increase estimated by IEA (2021a)) was driven primarily by emissions in the power and industry sectors (figures 3 and 5). Fossil-based investments in economic stimulus packages in post-COVID recovery plans around the world appear to have overwhelmed substantial investments in green infrastructure (Hepburn et al 2020), resulting in a 'fossil-based recovery' that may cause the 'unaffordable delay to climate action' described by Rochedo et al (2021). Indeed, the jump in fossil carbon emissions in 2021 and the data available on global stimulus packages suggest that the world is tracking the 'fossil-fueled recovery' scenario outlined in Forster et al (2020). The full effect of responses to the COVID-19 pandemic on CO2 emissions remains uncertain, but a further rise in emissions in 2022 cannot be ruled out—given that surface transport and aviation sectors have yet to fully recover (figures 3 and 5). Green investments could still work to alter underlying emissions trends, as many will take years before showing their full effects (Andrijevic et al 2020, Kikstra et al 2021). These trends reinforce the need for strong and globally concerted actions to slow fossil-based investments (that continue to push CO2 emissions up) and to set global emissions on a trajectory consistent with the temperature limits set in the Paris Agreement.
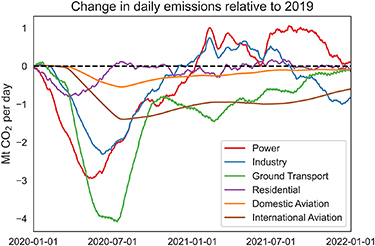
Figure 5. Changes in daily global fossil CO2 emissions (1 January 2020 through 31 December 2021) for the power, industry, residential, transport and aviation sectors relative to the same day in 2019 (smoothed to a rolling 4-month window, from the data source described in Liu et al 2020).
Download figure:
Standard image High-resolution image
Acknowledgments
The data that support the findings of this study are openly available at globalcarbonproject.org. The authors acknowledge support from the Gordon and Betty Moore Foundation (RBJ and JGC), the Australian National Environmental Science Programme's Climate Systems Hub (JGC), the European Commission Horizon 2020 projects VERIFY (#776810) (GPP, RMA, and CLQ) 4C (#821003) (PF, GPP, RMA, CLQ), and CoCO2 (#958927) (GPA and RMA), the National Science and Engineering Research Council of Canada, the Stanford Data Science Scholars program, and the Stanford Woods Institute for the Environment (SA), and Future Earth. CLQ acknowledges support from the Royal Society (Project No. RP\R1\191063). We thank the many scientists and funding agencies whose efforts and support contributed to the Global Carbon Budget 2021 released by the Global Carbon Project (globalcarbonproject.org).
Data availability statement
The data that support the findings of this study are openly available at the following URL/DOI: (https://doi.org/10.18160/gcp-2021).