

Abstract
Climate change is expected to lead to changes in seasonal temperature-related mortality. However, this impact on health risk does not necessarily scale linearly with increasing temperature. By examining changes in risk relative to degrees of global warming, we show that there is a delayed emergence of the increase in summer mean mortality risk in England and Wales. Due to the relatively mild summer mean temperatures under the current climate and the non-linearity of the exposure–response relationships, minimal changes in summer mean risk are expected at lower levels of warming and an escalation in risk is projected beyond 2.5 °C of global warming relative to pre-industrial levels. In contrast, a 42% increase in mortality risk during summer heat extremes is already expected by 2 °C global warming. Winter attributable mortalities, on the other hand, are projected to decrease largely linearly with global warming in England and Wales.
Export citation and abstract BibTeX RIS

Original content from this work may be used under the terms of the Creative Commons Attribution 4.0 license. Any further distribution of this work must maintain attribution to the author(s) and the title of the work, journal citation and DOI.
1. Introduction
Cold and warm weather are associated with increased mortality risks [1–4]. In the United Kingdom (UK), ambient temperature is associated with approximately 9% of total population mortality, the majority of which is related to cold weather [1]. Like many developed countries with a moderate climate, as the UK climate warms due to climate change, however, increases in the population health risks associated with warm and hot weather are expected.
A number of studies have examined potential future changes in temperature-related mortality associated with climate change [4–12]. Of those that provide specific projections at the national scale for the UK, the most recent studies [7, 12] date back to 2014 and use an earlier version of UK climate projections (UKCP09) [13] that considers future emission scenarios from IPCC's Special Report on Emissions Scenarios (SRES) [14], which have since been superseded by the representative concentration pathway (RCP) [15] scenarios. A more recent multi-country study, which includes analysis for the UK, provides projections based on RCP scenarios but focuses on regional meta-analyses across multiple countries [5].
Most studies examining the potential impact of climate change on heat and cold risk present future changes as projections for specific decades following fixed emission scenarios or pathways. Given the significant divergence of temperature trends under different emission scenarios, this approach results in a wide range of possible future health risks for specific decades [5, 12]. At the same time, climate policy is often framed in terms of mitigation aimed at preventing global mean temperatures exceeding specific thresholds such as those in the Paris Agreement. This disconnect between scenario- and threshold-based perspectives has led in recent years to a shift in appraising local climate risks through the frame of the global mean surface temperature [16].
In line with this shift, we present projected changes in temperature-related mortality relative to degrees of global mean climate change (as opposed to scenario-based decadal projections) using the updated 2018 version of UK Climate Projections (UKCP18) [17] and current temperature–mortality relationships. By focusing on the relationship between degrees of global warming and projected regional associated mortality, rather than the timing of these temperatures being reached and the associated impacts, we allow for a more policy relevant interpretation of the potential impact of climate change.
The aim of this study is to examine the impact of climate change on temperature-associated mortality in England and Wales. Temperature is one of the more direct pathways through which climate change affects health, amidst a broad array of wider risks and impacts [18], and is already responsible for an estimated 37% of warm-season heat-related deaths globally [19]. To isolate the climate change-related risk associated with projected temperature changes, changes in population vulnerability are excluded from the analyses, and recent England and Wales temperature–mortality relationships are applied throughout. The potential additive and interacting effects of demographic change, acclimatisation, economic and social development, and adaptation strategies—all of which are also important influences on the overall temperature-related mortality burden in practice—are discussed separately in section 5.4.
2. Data
Observed daily maximum and minimum temperatures are obtained from HadUK-Grid, available as regional averages of the 1 km resolution gridded dataset from 1960 to 2018 [20]. HadUK-Grid is currently the best available estimate of daily temperature at a UK regional scale, incorporating extensive quality control and validation [20]. Wales and nine administrative regions in England are considered, as defined by the Nomenclature of Territorial Units for Statistics level 1 (NUTS 1). Data on total (all-cause) daily mortality for the same regions are obtained from the Office of National Statistics and data from 1991 to 2018 are used.
Modelled daily mean near surface (2 m above ground level) temperatures from 28 climate model simulations (a 15-member perturbed ensemble of simulations using the HadGEM3-GC3.05 climate model [21] and a 13-member subset of the CMIP5 climate models) are obtained from 60 km resolution global projections from the 2018 UK Climate Projections (UKCP18) dataset for RCP2.6 and RCP8.5 scenarios [17, 22]. Regionally averaged temperatures for the ten NUTS 1 regions in England and Wales are used for the majority of the analyses, except for the calculation of global annual mean temperatures, where the global 60 km resolution gridded data is used.
3. Methods
A two-step process adapted from previous publications [5, 23] is employed for projecting the mortality attributable to non-optimal temperature (MANOT) in England and Wales in the future, where optimal temperature is defined as the minimum mortality temperature. First, regional temperature–mortality exposure–response relationships are established based on observed daily temperature and mortality data from 1991 to 2018 using quasi-Poisson time series regression with distributed lag nonlinear models [24] (more details in supplementary section 1.1 available online at stacks.iop.org/ERL/17/034017/mmedia). This describes the present-day temperature–lag–mortality relationship for each of the ten regions considered. Second, the relationships are applied [25] to the bias corrected (supplementary section 1.2) UKCP18 daily regional mean temperatures from 2000 to 2099 to predict the future MANOT for each region (more details in supplementary section 1.1). Log-linear extrapolation of the exposure–response relationships is applied for temperatures falling outside of the present-day observed range. The 'backward perspective' [25] is employed for all seasonal analyses. This represents the deaths on a given day that are associated with present and past temperature exposures, and can thus capture the accumulation of lagged responses associated with extended exposure. For supplementary analysis separating annual heat and cold mortality burdens (supplementary section 2.6), the 'forward perspective' is applied to account for the cumulative MANOT associated with each exposure day. Overall risk for England and Wales is calculated by summing the attributable mortality across the ten regions. This allows for consideration of differences in climate and population vulnerability between different regions.
Climate model simulations assuming the low-emission RCP2.6 scenario and high-emission RCP8.5 scenario are considered to give an indication of the range of possible climate futures. We focus on only the climate change aspect of future changes in temperature-related mortality, meaning that other relevant factors such as population growth, ageing, changes in health status, acclimatisation, infrastructure changes, and preventative interventions, are not incorporated into these projections. Accordingly, the exposure–response relationship is assumed to be unchanging over time, and a fixed annual all-cause mortality cycle (supplementary section 1.3) is assumed for each region when quantifying future MANOT in step two of the analysis (supplementary section 1.1). These estimates should be considered as predictions of how the current population of England and Wales would respond to climate conditions representative of different levels of mean global warming [26].
To relate different degrees of global climate change to regional health risk, changes in MANOT in England and Wales are presented relative to degrees of global warming, expressed as the global mean temperature change relative to the 1850–1900 pre-industrial average (supplementary section 1.4). Analyses focus on winter and summer seasons, defined as December to March and June to September, respectively, to capture changes in the warmest and coldest months of the year separately. These extended seasonal definitions are used to reflect the monthly likelihood of observing summer- and winter-like temperatures that affect mortality in England and Wales (supplementary section 1.5). For seasonal mean analyses, mortality associated with both warm and cold ambient temperatures are considered for both seasons, since significant cold-related mortality risks are also observed during present-day summer in England and Wales [27]. In the analysis of seasonal extremes, only heat extremes are considered for summer and only cold extremes for winter, since these are the events most likely to lead to significant, acute disruption to the healthcare system. Heat and cold are defined as days with England and Wales average temperatures warmer/colder than the average optimal temperature across all ten regions (16.9 °C). The ten highest MANOT days per season per year that satisfy the temperature constraint above are taken as the seasonal extreme. For multi-model averages, two measures of uncertainty are presented: the 95% bootstrap confidence interval (CI), which provides a measure of the uncertainty in the mean estimate, and the interquartile range (IQR), which is indicative of the uncertainty in the climate response (i.e. spread of the climate simulations).
Lastly, an idealised example is presented to illustrate the mechanism behind the projected changes in summer mean MANOT associated with global warming. For this simplified setup, temperatures under present day and future summer conditions are approximated using gaussian distributions, and as an example, distribution means are selected to reflect the projected temperature range for South East England and standard deviations are fixed at 2.5 °C.
4. Results
4.1. Temperature
As the global climate warms, corresponding warming in England and Wales is expected. Averaged across the UKCP18 RCP8.5 (high emissions) projections, summer average temperature is projected to increase at a slightly faster rate than the global annual mean, while the winter average warms at a slightly lower rate (figure 1). Temperatures associated with the highest mortality days in winter increase at a rate similar to the global mean, which warms slightly faster than the England and Wales winter average. Summer warm extreme temperatures in England and Wales increase at a slightly faster rate per degree of global warming than the seasonal mean. At lower levels of global warming, the degree of regional warming is similar between the seasonal warm extreme and seasonal mean. However, it diverges at higher levels of warming, with slightly greater increases expected in the warmest summer days compared to the seasonal mean.

Figure 1. Decadal mean warming in England and Wales for summer and winter compared to the full-year decadal mean global warming, from the 2000s (left-most marker) to the 2090s (right-most marker), averaged across 28 UKCP18 RCP8.5 climate simulations. Seasonal averages are shown in solid lines; averages of the ten deadliest warm/cold days in summer/winter are plotted in dashed lines. Temperatures quoted in the legend are the England and Wales mean from the 1960–2018 period. As an example of the spread across model simulations, the scatter plots show the 2050s decadal average for each individual climate simulation.
Download figure:
Standard image High-resolution imageThere is an approximately linear relationship between changes in global mean temperature and England and Wales temperature. This does not however result in a linear change of summer mortality risk, due to the highly non-linear exposure–response relationship, as shown below.
4.2. Mortality
Associated with the modelled temperature changes, average MANOT (considering the net mortality impact of heat and cold) in England and Wales is projected to increase in summer and decrease in winter (figure 2). Notably, RCP2.6 and RCP8.5 scenarios lead to identical relationships between changes in England and Wales temperature-related mortality relative to degrees of global warming (figure 2, blue and orange plots fit on top of each other). This indicates that the relationship between global and regional mean temperatures is independent of the emissions pathway. Implications for England and Wales mean temperature-related mortality can therefore be drawn directly from the global mean temperature increase.
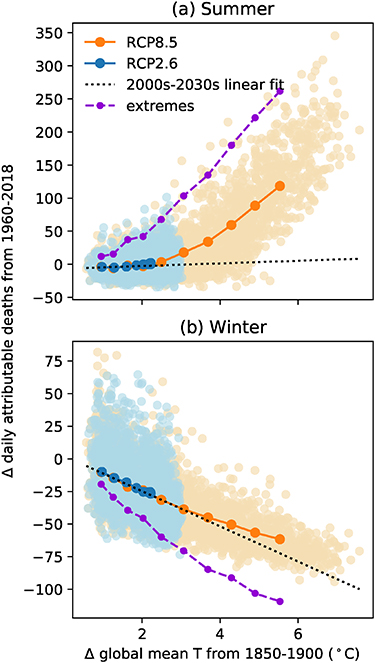
Figure 2. Change in seasonal average daily attributed deaths for England and Wales from the 1960–2018 average under RCP8.5 (blue) and RCP2.6 (orange) scenarios, plotted against the degrees of global warming from the 1850–1900 pre-industrial average. Faded scatter plots show an individual year from each climate simulation. Markered line plots show the decadal average across 28 UKCP18 climate simulations, from the 2000s to the 2090s. In purple is the decadal average of the ten highest mortality warm/cold summer/winter days in a year under RCP8.5. The dotted black lines are the linear fits of the seasonal average for the first four decades under the RCP8.5 scenario. Note that summer cold days are excluded from the extremes analysis but included in the seasonal average.
Download figure:
Standard image High-resolution imageFor all model years within ±0.1 °C of fixed global warming levels relative to the 1850–1900 pre-industrial average (table 1), the change in summer daily mean MANOT compared to the present day average ranges from little net change (mean: −2; CI: −3–0.2; IQR: −11–5; for further discussion on model uncertainty see supplementary section 2.1) in a 2 °C warmer world, to 34 additional daily attributable deaths on average (CI: 28–41; IQR: 9–54) at 4 °C global warming, and to 157 (CI: 139–172; IQR: 119–193) by 6 °C. Given the present-day summer average MANOT of 57 per day, this is equivalent to a relative change of −3% (CI: −6%–0%; IQR: −20%–9%), 60% (CI: 50%–72%; IQR: 15%–92%), and 275% (CI: 245%–300%; IQR: 218%–332%), at 2, 4, and 6 °C of global warming respectively. The rate of increase in summer mean attributed deaths accelerates at higher levels of global warming, such that a unit increase in global mean temperature in a 4 °C warmer world leads to a significantly greater increase in temperature-related deaths than a unit increase in the present day (figure 2(a)). This results in significantly greater changes in summer mean attributed mortality at the end of the century following the RCP8.5 scenario (mean change: 207%; CI: 189%–226%; IQR: 90%–302%, by the 2090s, compared to the 1960–2018 average of approximately 7000 attributed deaths per summer) than for the RCP2.6 scenario (mean change: 1%; CI: −3%–4%; IQR: −7%–5%), under which the global mean temperature does not exceed 3 °C above pre-industrial levels in any modelled year (figure 2(a) and supplementary table S1).
Table 1. Absolute and relative change in average daily MANOT compared to the 1960–2018 present day (PD) average: at 1 ± 0.1 °C to 6 ± 0.1 °C global warming relative to the 1850–1900 pre-industrial average.
| PD avg | 1 °C | 2 °C | 3 °C | 4 °C | 5 °C | 6 °C | ||
|---|---|---|---|---|---|---|---|---|
| Summer | 57 | Δ avg | −4 | −2 | 10 | 34 | 100 | 157 |
| Δ % | −7 | −3 | 17 | 60 | 174 | 275 | ||
| Winter | 217 | Δ avg | −12 | −26 | −36 | −50 | −57 | −70 |
| Δ % | −5 | −12 | −17 | −23 | −26 | −32 |
When considering the attributed mortality during the warmest summer days, the risk increases at a faster rate starting at lower levels of global warming, resulting in a more linear relationship than the summer mean and significantly greater increases in risk during heatwaves (figure 2(a) and table 2). At 2 °C global warming, an average increase of 49 daily deaths attributable to heat (CI: 45–56; IQR: 12–79; a 42% increase compared to the present day) during the ten warmest summer days per year is already expected. This rises to an average increase of 145 (CI: 130–157; IQR: 90–192; a 126% increase) at 4 °C global warming, and to 327 (CI: 296–347; IQR: 281–367, a 290% increase) at 6 °C. Further increases may also occur due to population growth and ageing, which are excluded from the current analysis.
Table 2. As table 1 but for average attributable mortality over the ten highest mortality warm/cold days per year in summer/winter. Note that cold extremes in summer are excluded.
| PD avg | 1 °C | 2 °C | 3 °C | 4 °C | 5 °C | 6 °C | ||
|---|---|---|---|---|---|---|---|---|
| Summer heat extreme | 117 | Δ avg | 12 | 49 | 86 | 145 | 248 | 327 |
| Δ % | 10 | 42 | 75 | 126 | 217 | 290 | ||
| Winter cold extreme | 316 | Δ avg | −23 | −49 | −66 | −93 | −102 | −127 |
| Δ % | −7 | −15 | −21 | −30 | −32 | −40 |
Over the whole year, present-day MANOT in England and Wales is dominated by cold-related risks in winter months, as shown by the winter daily average of 217 per day (around 3.8 times the summer daily average). However, the decrease in winter daily average MANOT scales roughly linearly with increasing global mean temperature (figure 2(b)), with a more steady projected change of −26 (CI: −27 to −22; IQR: −40 to −14), −50 (CI: −51 to −46; IQR: −57 to −43), and −70 (CI: −73 to −68; IQR: −74 to −66), respectively at 2 °C, 4 °C, and 6 °C warming (table 1). This is equivalent to changes of −11.8% (CI: −12.3% to −10.2%; IQR: −18% to −7%), −23.0% (CI: −23.4% to −21.3%; IQR: −20% to −26%), and −32% (CI: −34% to −31%; IQR: −34 to −30%) relative to the present-day average. The rate of decrease tapers off slightly under more extreme global warming conditions (e.g. an 11% decrease from 2 °C to 4 °C warming compared to a 9% decrease from 4 °C to 6 °C warming, both relative to the present-day baseline), but the change is not as pronounced as in summer. This leads to more similar end-of-century winter projections between RCP8.5 (mean change: −28.3%; CI: −29.1% to −27.7%; IQR: −35% to −20%) and RCP2.6 (mean change: −12.1%; CI: −13.1% to −11.0%; IQR: −16% to −10%) scenarios compared to summer (supplementary table S1). However, similarly to summer, the change in the winter extreme attributed mortality is amplified compared to the change in the seasonal mean.
If the current population of England and Wales were exposed to future climate conditions, the absolute magnitude of increase in summer average MANOT would overtake the decrease in winter average at around 5 °C global warming (table 1), and the balance of MANOT in England and Wales would shift from being predominantly related to cold weather under the present-day climate to equal parts heat- and cold-related by 6 °C warming (supplementary table S2). This is despite only 39% of the days being warmer than the optimal temperature, which, together with the short lag structure of heat-related mortality risk, points at the potential for days with very high heat-related mortality risks at high levels of warming and related additional stress on the health and social care system.
All ten regions in England and Wales exhibit a similar pattern of accelerating increase in summer temperature-related mortality and roughly linear decrease in winter attributed mortality with global warming over the 21st century (supplementary figure S6). However, some variations can be observed in the relative rates of change, as discussed in supplementary section 2.3.
4.3. Why is the response non-linear in summer?
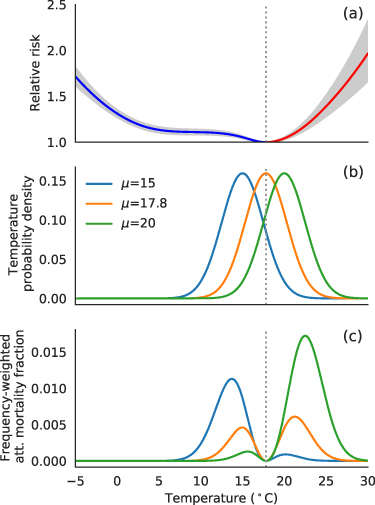
The non-linear response of summer MANOT to climate change can be explained by the shape of the exposure–response relationships in England and Wales and the fact that current summer mean temperatures lie slightly below the regional optimal temperatures. We demonstrate this in an idealised example by using gaussian distributions to represent summer temperatures in the present day and future (figure 3(b)) and show that over time, summer MANOT shifts from being predominantly associated with cold (below the optimal temperature) to being largely associated with heat (figure 3(c), blue versus green curves; supplementary figure S7). A similar trend can be found in the climate model projections, where until global warming reaches approximately 2.5 °C, more than half of the summer days in England and Wales are expected to be milder than the present-day regional optimal temperature (supplementary figure S8). For an equivalent shift in mean temperature above and below the optimal, however, greater resultant MANOT is expected in a warmer climate (figure 3(c), green versus blue curves). This is due to the asymmetry of the exposure–response curve around the optimal temperature, with a sharper slope on the heat side than the cold side. It results in significant increases in summertime MANOT when the temperature distribution surpasses the optimal range and indicates that increases in summer heat-related mortality in the future are unlikely to be offset by decreases in summer cold-related mortality. When the temperature distribution is centred around the optimal temperature, which lies between present day and RCP8.5 end-of-century averages, a lower seasonal mean MANOT is observed (figures 3(b) and (c), orange curve). This leads to the initial slight decrease and delayed emergence of climate change impact on summer attributed mortality noted in section 4.2.
Figure 3. (a) Exposure–response relationship for South East England shown as an example with (b) idealised Gaussian temperature distributions that reflect an approximate range of summer average temperatures observed in present day (blue) and near the end of the century (green). The orange curve shows a temperature distribution centred at the optimal temperature (dotted grey line). Panel (c) shows the frequency-weighted attributable mortality fraction, obtained by multiplying the upper two panels (with the relative risk subtracted by one). The total area under each curve in panel (c) indicates the mean attributable fraction. The grey shaded area in panel (a) indicates the 95% CI.
Download figure:
Standard image High-resolution image
5. Discussion
5.1. Summary of findings
We quantify the potential changes in temperature-related mortality associated with different global warming levels for summer and winter seasons in England and Wales using the UKCP18 RCP2.6 and RCP8.5 climate projections and assuming fixed regional exposure–response relationships. A slight initial decrease in summer mean attributed mortality is projected under low warming levels as summer temperatures in England and Wales shift toward optimal temperatures where the mortality risk is minimised. At 2 °C global warming, this results in a modest change in summer average attributed mortality of −3% (CI: −6%–0%) from a present-day baseline summer daily average of around 60 MANOT. The impact on the warmest summer days, however, is already substantial, with an increase of 42% (CI: 38%–48%) from a baseline of around 120.
Global warming levels beyond around 2.5 °C are projected to lead to a non-linear, accelerating increase in summer average mortality over time, reaching a 60% (CI: 50%–72%) increase by 4 °C global warming and 275% (CI: 245%–300%) by 6 °C. This non-linearity results from mild average summer temperatures in England and Wales under the current climate and the non-linear relationship between ambient temperatures and mortality risk. It is further amplified for the summer warm extremes, which increases by 126% (CI: 113%–137%) and 290% (CI: 265%–304%), respectively.
Winter cold-related mortality is projected to decrease roughly linearly with warming temperatures, from a significantly greater baseline of around 220 average MANOT per winter day, with 11.8% (CI: 10.2%–12.3%) reduction at 2 °C global warming, 23.0% (CI: 21.3%–23.4%) reduction at 4 °C, and 32% (CI: 34%–31%) reduction at 6 °C. Mortality risks during winter extremes are projected to decrease at a faster rate than the seasonal mean, but the difference is less pronounced compared to summer.
Overall, the structure of MANOT in England and Wales is projected to shift from being dominated by cold-related risks under present-day conditions to having similar annual burdens of mortality attributable to heat and cold by 6 °C global warming or around end of the century under RCP8.5. Days with extreme peaks of mortality risk in summer is projected to partially replace prolonged periods of elevated risk in winter under high warming conditions.
5.2. Applicability to other countries
While this study focusses on England and Wales, the exposure–response relationship between temperature and mortality, especially for heat, is similar to many other countries in the mid-latitudes [1], and a similar strong relationship between global mean and local temperature changes is expected for many such countries [16]. The same arguments around non-linearity at higher degrees of warming would therefore similarly apply. Significant impacts even at low levels of warming, however, would be expected for many countries with warmer present-day climates and therefore greater heat-related health risks. Examination of the exposure–response relationship and the position of the present-day seasonal mean temperature relative to the optimal temperature (whether below or above the optimal) would give a first order indication of the potential pathway of future changes in health risk due to global warming.
5.3. Comparison to previous studies
For ease of comparison to previous studies, analyses showing the annual total MANOT and annual mortality separately attributable to heat and cold are shown in supplementary section 2.6. Our quantification of present-day and future attributable mortalities aligns well with previous studies, though it falls on the higher end for both heat and cold. Early century burdens are estimated at around 44 000 deaths attributable to cold and around 2000 attributable to heat per year in the 2000s under RCP8.5, compared to previous findings of around 32 000–46 000 deaths per year attributable to cold and around 2000 attributable to heat [1, 5, 7, 12] between the 1990s to 2010s. Cold mortality burden for 2050 conditions is projected to be around 35 000 per year under RCP8.5, compared to previous projections of around 26 000–31 000 deaths per year without consideration for population change [5, 7, 12] and 36 000–40 000 per year including demographic projections [7, 12]. Mortality attributable to heat is projected to be around 7000 per year in the 2050s under RCP8.5 in our study, compared to previous projections of around 4000–7000 per year based on the A1B medium emission scenario from SRES and including projections for demographic changes [7, 12], and around 6000 per year in a more recent study assuming RCP8.5 and no population change [5].
When compared to the last study above [5] which most closely aligns with our methodological setup, we find slightly higher estimates in our study for both heat and cold and for all decadal averages. The relative percent changes between time periods, however, are in good agreement (around 270%/−20% for heat/cold from 2010s to 2050s and around −40% for cold from 2010s to 2090s), except for a higher increase at the end of the century for heat in our study (around 1000% compared to 770% as found by the earlier study [5]). This indicates largely similar shapes of the exposure–response curves between the studies, though possibly a steeper slope for heat extremes in our analysis. Notable differences in study setup that may have contributed to the difference in attributable mortality include the use of different observational temperature datasets and an additional meta-regression analysis performed in the earlier study. The increased prevalence of heat extremes in the observational record from recent years may also improve the confidence in the exposure–response relationship at high temperatures in our study.
5.4. Limitations
A key assumption in this study is the log-linear extrapolation of the exposure–response relationship beyond the present-day observed temperature range. Given the sharp increase in risk at high temperatures and the greater uncertainty in risk estimation near temperature extremes due to fewer observations, details of the extrapolation can be a source of significant uncertainty for projected mortality risk associated with heat beyond the present-day temperature range.
Related to this are the assumptions of fixed demographics and exposure–response relationships. While these other sources of change are excluded from the current study to isolate and quantify the climate change-related risk specifically, they may also significantly alter future MANOT [18]. Future MANOT is likely to be enhanced by population growth and ageing, with larger populations exposed in the future and since older people are more vulnerable to the negative health impacts of both heat and cold [28]. In particular, previous projections for the UK have noted significant reductions in (or even a reversal of) the decrease in cold-attributable mortality burden associated with climate change when demographic projections are considered [7, 12]. It is also possible that reduced wintertime MANOT could result in a more heat-susceptible population remaining in future summers [29–31], but our model is not able to capture such dynamic effects on susceptibility.
On the other hand, physiological and behavioural acclimatisation, preventative interventions, improvements in infrastructure, and advances in medical science may all contribute to reductions in mortality risk in the future, resulting in changes in the shape of the exposure–response curve. While the direction of impact of these various factors can be anticipated, these changes—and their corresponding impacts—are hard to predict quantitatively. For example, a comparative study of adaptation modelling methods found that the impact of different approaches to modelling adaptation resulted in changes to their future mortality estimates of between 28% and 103%, relative to the projected impacts assuming no adaptation [32]. Overall, the rate of adaptation relative to the rate of climate change, which may differ in the future compared to recent decades, will also play an important role in determining the net impact.
Other limitations of the current study include the lack of consideration for temporal variations in risk to the same temperature exposure. For instance, an early season heatwave may have a stronger impact than one occurring later in the season [33, 34]. Though lagged responses are included, the potential additional effect associated with event duration (e.g. heatwaves) [34, 35] is not explicitly considered. Furthermore, while changes in temperature variability in the future are captured by the modelled daily mean time series, the associated impact on risk (e.g. greater risk associated with greater variability) [36, 37] is not represented in the statistical model.
Additionally, regional average temperatures in this study are not population weighted. This allows for a more consistent measure of temperature between the higher-resolution observational dataset used to construct the exposure–response relationship and the coarser-resolution modelled temperature projections used to quantify future MANOT. However, the actual temperature experienced by the population may be underestimated due to urban effects (which is not well represented in global climate models [38, 39]). Findings from a recent study suggest minimal impact of population weighting on risk estimates at fixed percentiles of the temperature distribution for most regions of England and Wales (with an exception for London, where lower risk estimate for heat is found for unweighted high-resolution gridded climate data) [40], though any differences may be amplified following extrapolation of the risk curve.
6. Conclusions
As an alternative to decadal projections, which have a high range of uncertainty tied to climate policy, we present climate change impact on future temperature-associated mortality relative to degrees of global warming. This allows for interpretation in line with global climate policies which are often framed as strategies to limit increases in global mean temperatures below certain thresholds, such as those in the Paris Agreement.
We find a positive relationship between the degree of global warming and the magnitude of the impact on local temperature-related mortality risk. However, this relationship is not linear. The impact on summer mortality risk in England and Wales per degree of global warming is projected to be significantly greater when global mean warming increases beyond 2.5 °C than under the current climate. In contrast, a steadier decrease in winter attributable mortality is expected. For both seasons, a more pronounced impact is projected for seasonal extremes, and significant increases in mortality risk during extreme heat events are already expected under lower levels of global warming.
The non-linear response of summer MANOT to climate change emphasises the importance of keeping global warming to low levels in order to limit the impact on public health and highlights the importance of not allowing the buffering effect at lower levels of warming to give a false sense of security regarding the potential impact of climate change on mortality risk. The amplified impact during seasonal extremes also has important implications for public health preparedness efforts, since such extreme events may pose additional challenges due to multi-sectoral and potentially cascading impacts. The significant potential influence of other susceptibility factors in influencing temperature-related mortality risk indicates an opportunity for interventions across multiple sectors to mitigate projected increases in heat-related mortality as well as to reduce existing cold-related risks, with particular relevance for building design and retrofit policy, urban planning and green space provision, and in the social care sector.
Acknowledgments
W T K H and A C P were funded by the UK Climate Resilience programme, supported by the UKRI Strategic Priorities Fund. The programme was co-delivered by the Met Office and NERC on behalf of UKRI partners AHRC, EPSRC, and ESRC. I B was supported by a National Institute for Health Research Academic Clinical Fellowship. CS was funded by the Met Office. T S was funded by NERC Independent Research Fellowship (NE/P018637/1). We would like to thank the two anonymous reviewers for their valuable feedback which led to improvement of the paper.
All raw data used in this study were obtained from public institutions. Temperature data were from the Met Office and available on the CEDA Archive (http://dx.doi.org/10.5285/e4d28cddec7b4e1ab50eae189070f7dc, https://catalogue.ceda.acuk/uuid/7ebab0df1a794d1fae245256af7de633, https://catalogue.ceda.acuk/uuid/97bc0c622a24489aa105f5b8a8efa3f0). Daily mortality data was purchased from the Office for National Statistics (www.ons.gov.uk). Open-source R codes provided by Antonio Gasparrini via his website (www.agmyresearch.com) were used for modelling the exposure-response relationships and for mortality attribution.
Data availability statement
The data that support the findings of this study are openly available at the following URL/DOI: https://doi.org/10.5281/zenodo.6092601.
Conflict of interest
We declare no conflicts of interest.