

Abstract
Climate change has been described as the main threat for the cultivation and growth of truffles, but hydroclimate variability and model uncertainty challenge regional projections and adaptation strategies of the emerging sector. Here, we conduct a literature review to define the main Périgord truffle growing regions around the world and use 20 global climate models to assess the impact of future trends and extremes in temperature, precipitation and soil moisture on truffle production rates and price levels in all cultivation regions in the Americas, Europe, South Africa, and Australasia. Climate model simulations project 2.3 million km2 of suitable land for truffle growth will experience 50% faster aridification than the rests of the global land surface, with significantly more heat waves between 2070 and 2099 CE. Overall, truffle production rates will decrease by ∼15%, while associated price levels will increase by ∼36%. At the same time, a predicted increase in summer precipitation and less intense warming over Australasia will likely alleviate water scarcity and support higher yields of more affordable truffles. Our findings are relevant for truffle farmers and businesses to adapt their irrigation systems and management strategies to future climate change.
Export citation and abstract BibTeX RIS

Original content from this work may be used under the terms of the Creative Commons Attribution 4.0 license. Any further distribution of this work must maintain attribution to the author(s) and the title of the work, journal citation and DOI.
1. Introduction
Increasing temperature means and changes in precipitation totals are likely to affect the productivity and functioning of ecosystems and agriculture in the 21st century (Gornall et al 2010, Challinor et al 2014, Ray et al 2015). Regions with a Mediterranean climate, such as southern Europe, the western United States, central Chile, South Africa, and parts of Australasia are particularly vulnerable to anthropogenic warming (Mann and Gleick 2015, Cramer et al 2018, Rojas et al 2019). The projected drying in many of those regions poses an unprecedented economic threat to specialized high-value crops (Zhang and Delworth 2018, Rojas et al 2019), such as grapes (Cook and Wolkovich 2016, Morales-Castilla et al 2020), olives (Ponti et al 2015) and truffles (Büntgen et al 2012, le Tacon et al 2014, Thomas and Büntgen 2019). The cultivation of Périgord (Tuber melanosporum Vittad.) truffles and, to a lesser extent also the Burgundy (Tuber aestivum Vitt.) truffles, benefits the primary, tertiary and quaternary economic sectors at different geographical scales. To date, the emerging truffle 'industry' generates hundreds of millions of Euros annually (Oliach et al 2020a), increases land and property value, promotes myco-tourism (Büntgen et al 2017), and stimulates interdisciplinary research (Büntgen and Egli 2014). An ever-growing number of plantations of this most sought-after ectomycorrhizal ascomycete, i.e. the black truffle, can strengthen local economies and may even enhance ecological stability, not only in the traditional trufficulture areas of southern Europe (Büntgen et al 2017), but also in Mediterranean parts of the Americas, South Africa and Australasia (Hall et al 2003, Reyna and Garcia-Barreda 2014). Under current and projected climate change, the truffle sector, however, requires advanced irrigation systems to reduce the risk of drought-induced fluctuations in the quantity and quality of their annual harvests (Büntgen et al 2012, Thomas and Büntgen 2019). Understanding the direct and indirect effects of a warmer and drier climate on the intertwined global truffle sector is fundamental to refine adaptation strategies and inform decision-making at a wide range of relevant ecological, socio-political and economic scales.
Here, we present a literature review of biogeographical, ecophysiological and climatological information about the Périgord black truffle. We conduct a meta-analysis of all previously published truffle data to define the main truffle growing regions around the world (hereinafter TGRs). We apply different scenarios from 20 state-of-the-art global climate models (GCMs) to quantify trends and extremes in seasonal temperature means, precipitation totals and soil moisture levels of the TGR until 2100 CE and compare those data against projections for the rest of the global land surface. To estimate the impacts of projected climate change on truffle production, we combine model projections with historical truffle market observations to estimate future changes in truffle production rates and price levels.
2. Data and methods
2.1. Truffle growing regions
To date, no global database of TGRs has been compiled, primarily because of the secrecy of the location of truffle plantations, which reflects the reluctance of sharing specific information by truffle farmers and hunters. In order to define the global distribution of the main Périgord TGRs that substantially contribute to international markets, we reviewed peer-reviewed scientific articles, monographs, technical notes and conference proceedings (table S1 available online at stacks.iop.org/ERL/17/024001/mmedia). All information was published after 2010, either in indexed databases or on the truffle growers' association websites. Of the dozens of relevant publications that included the search words 'truffle' or 'truffle plantation' or 'truffle cultivation' in conjunction with toponyms, only ten articles contained useful information about specific TGRs. While we restricted our focus to those regions in which production has been reported (table S1), we excluded all regions with established plantations lacking any recent harvest (e.g. China; C. Colinas, pers. comm.) or showing globally insignificant production rates (e.g. Morocco, Israel, the United Kingdom, eastern United States). Finally, we neglected occasional individual truffle findings and theoretically suitable areas for truffle growth (Thomas and Büntgen 2017), such as the region between Texas and Virginia (Lefevre 2012).
To delineate and digitize all TGRs, we used the QGIS ver. 3.16 (QGIS.org 2022) to produce a shapefile in which polygon features represent the TGRs. In Europe (Spain, Italy and France), Chile, South Africa and New Zealand, we defined boundaries based on 1st-level administrative subdivisions (ASs). In the United States where this administrative scale corresponds with individual states, we used 2nd-level AS instead. Shapefile data on both spatial levels are available at the 'Database of Global Administrative Areas' (see SI). While the 1st-level AS in Australia corresponds to large territories and the 2nd-level AS (small local government bodies) is too small for resolution of GCMs, we defined TGRs by temperate and Mediterranean climate zone according to Köppen. These groups sufficiently cover the spatial distribution of currently operating truffle plantations (table S1) and are considered suitable for truffle cultivation (Malajczuk and Amaranthus 2007). Data on climate zones are freely available at Australian Bureau of Meteorology (see SI). To clarify the relationship between temperate (all subtypes: Cs, Cw, Cf) and Mediterranean climate (only Cs), we provided the corresponding subtypes to each TGR (Beck et al 2018) (table S2). Data for the climate diagrams based on instrumental records ('present climate') are available at National Oceanic and Atmospheric Administration (NOAA) (see SI).
2.2. Data on truffle ecology and production, and climate variability
Périgord truffles grow at sites with an average annual temperature of around 12 °C and precipitation totals of approximately 780 mm. The optima for the warmest and coldest months (July and January) are 20.5 °C and 3.8 °C, respectively. Summer precipitation totals must not fall below 140 mm (Čejka et al 2020). Although Périgord truffles are harvested in winter from around November to March (in the northern hemisphere), fruitbody formation likely starts as early as the previous spring, after mycorrhizal colonization of the host tree roots and mycelium formation (Garcia-Barreda and Camarero 2020). Between spring and late summer, the growth and maturation (peridium and gleba development) continue. This process mainly depends on the amount of water in the soil and host plants, although excess precipitation in the cooler autumn season may affect truffle harvests negatively (Büntgen et al 2019). By the same token, the increased frequency of climatic extremes, such as drought spells and sub-zero temperatures, often impair future harvests. In addition to reduced truffle yields, prolonged summer drought can affect fruitbody maturation, while winter frosts may cause peridium rupture, especially if the truffle contains large amounts of water (Thomas and Büntgen 2019).
Since growth and ripening of Périgord truffles, which are mostly found in the topsoil layer, depend on natural summer rainfall and temperature (Büntgen et al 2019), we selected three modeled climate variables for the summer season: temperature (Kelvin), precipitation flux (kg m−2 s−1), and moisture in the upper ∼10 cm of the soil column (kg m−2). This last variable was preferred over column-wide moisture because GCMs vary in soil depth. That, in addition to the non-uniform vertical distribution of soil water, makes GCMs not comparable (Berg et al 2016). While climate estimates of temperature and precipitation were derived from a set of 20 GCMs, soil moisture was limited by the availability of only 17 models (table S3). All GCMs used in this study contributed to Coupled Model Intercomparison Project – Phase 5 (CMIP5) as part of the Intergovernmental Panel on Climate Change (IPCC) Assessment Report 5 (Flato et al 2013), and are available from the World Data Center for Climate (see SI). Our preference for GCMs over regional climate models is described in the online SI. To estimate a wide range of climate change impacts on TGRs throughout the 21st century (2006–2100 CE), we used both a 'moderate' and 'severe' climate scenario represented by the Representative Concentration Pathways (RCP)4.5 and RCP8.5, respectively. In ensuring consistency and avoiding over-representing the forced responses of GCMs that submitted more realizations to the CMIP5 dataset, we employed only the first ensemble member from each model (r1i1p1). To process the GCMs, as well as any other climate data (NetCDF format), we used the Climate Data Operator (CDO) 2.0.0 software (Schulzweida 2021). For a detailed description of the processing and bias correction of the data using CDO, see the online SI.
Using the QGIS ver. 3.16 (QGIS.org 2022) we exported vertices' coordinates of all shapefile's polygons into a delimited text file, which was then imported into the CDO to extract future projections of climate variables in TGRs. To remove oceanic regions from all variables, we applied a similar procedure to the global landmass shapefile (see SI) and created a mask over which we computed the area average, which we hereafter considered to be the global mean. Since the Climatic Research Unit (CRU) and Global Land Data Assimilation System (GLDAS-2.1) baseline datasets do not spatially cover high-latitudes in the Southern Hemisphere, preventing local bias-correction, Antarctica was excluded from the global landmass. When calculating a mean of each timestep (summer season) for TGRs and the globe, we accounted for grid-specific weights derived from the cell area of the Gaussian grid. Finally, with summer data being related to June–August (JJA) and December–February (DJF) in the Northern and Southern Hemispheres, respectively, we computed estimates of seasonal means from monthly temperature and soil moisture data, and seasonal sums from daily precipitation totals/fluxes (see SI). Since the austral summer data for 2100 terminate by the end of the year, we excluded 2100 from our analysis.
We examined the direct response of the truffle sector in each TGR to projected climate change using the impact analysis. We estimated Périgord truffle price levels for each TGR for the late 21st century based on historical data from the world's two most important truffle exporting countries in Europe (see Statistical analysis and modeling). We used historical prices from wholesale markets in France (1995–2020/2021) provided by Agrimer, France (https://rnm.franceagrimer.fr), and Spain (1997/1998–2020/2021) compiled in 2021 from multiple sources including Reyna (2012), Oliach et al (2020b) and Teruel Truffle Growers Association (https://trufadeteruel.com/atruter/). Similarly, we estimated Périgord truffle production rates in each TGR for the late 21st century based on historical records from Spain, France, and Italy (Groupement Européen Truffe et Trufficulture; Spanish Federation of Truffle Growers Associations; French Federation of Truffle Growers; Oliach et al 2021). Therefore, we were also able to provide estimates of future price levels and production rates for each TGR (see Statistical analysis and modeling and Results). However, we did not include historical records from non-traditional TGRs, because local truffle cultivation has only recently begun in some regions. That, in addition to exponential truffle growth reflecting the number of plantations rather than natural variability in precipitation, makes reliable predictions difficult. Estimating future parameters in non-traditional TGRs is further problematic due to the lack of official and homogenized records. To the best of our knowledge, the only existing truffle harvest data are limited to personal inventories and biased towards a small number of plantations.
2.3. Statistical analysis and modeling
To detect long-term trends in the climate projections, we applied a non-seasonal Mann–Kendall test on the bias-corrected 2006–2099 anomalies relative to the 2006–2020 baseline mean (Mann 1945). This non-parametric statistical test is commonly used to detect increasing or decreasing trends over time for many types of data, including groundwater, water quality, streamflow, lake levels, temperature, and precipitation. In terms of functionality, the Mann–Kendall statistics were determined by the ranks of the original values and do not require homoscedasticity and normal distribution (Wang et al 2020).
Moreover, we observed if climate parameters are likely to get significantly more or less variable until the end of 21st century by testing heteroscedasticity of the bias-corrected area-average of TGRs and the remaining global land surface between 2010 and 2039 and the distant future from 2070 to 2099 CE. We used prior-ANOVA non-parametric Levene's test (Levene 1960; table S4), after inspecting (non-)normality via the Shapiro–Wilk test (Shapiro and Wilk 1965; table S5). We used the Shapiro–Wilk test because it is not as affected by ties as the Anderson–Darling test, and we chose Levene's test over Bartlett test because it is less sensitive to departures from the mean. To understand spatial climatic extremes, we developed plots showing the distribution of standard deviation differences of annual variability between the early (2010–2039) and late (2070–2099) period for each grid cell in each TGR.
Based on a strong dependency of winter Périgord truffle production on previous summer precipitation (p < 0.00001; Büntgen et al 2019), and the adverse effect of heatwaves on truffle growth (Garcia-Barreda and Camarero 2020), we developed multiple linear regression (MLR) models with two independent variables. These were represented by summer precipitation and the heat index of the warmest months (July and January). The latter is a physiological parameter combing the effect of air temperature and relative humidity. However, since the heat index is not usually measured, we used the July/January temperature and relative humidity to calculate this parameter according to the conventional equation (see SI). Historical and projected relative humidity data were obtained from European Centre for Medium-Range Weather Forecasts Re-analysis (ERA5) and World Data Center for Climate (GCMs), respectively (see SI). Using a common period of 24 years from 1997/1998 to 2020/2021, we developed five MLR models (tables S6–10) between historical climate (CRU TS4.05 or ERA5) and national price levels (Spain and France) and production rates (including Italy). We applied three models for production rates and two models for price levels on bias-corrected future climate data to estimate these parameters in each TGR for a three successive 24 year periods: 1997–2020, 2021–2044 and 2076–2099. Both independent variables were used in all five MLR models except for the association between Spanish production and the heat index, which lacked correlation (r = −0.01) and showed multicollinearity. We then used the sum of the three and the average of the two sets of modeled production and price values, respectively. We did not standardize any of the data used.
3. Results
Seven TGRs on both hemispheres cover ∼2.3 million km2 of arable land (figure 1, table S11). With ∼970 000 km2, almost half of the suitable land for global truffle cultivation is located in southern Europe between ∼35.8° and 47.7° N. Based on the 1981–2010 climatology, the mean summer temperature and total precipitation in this area (20.4 °C and 137 mm) are similar to Australia (20.3 °C and 162 mm) and South Africa (21.2 °C and 186 mm), which represent the second and third largest TGRs (∼800 000 and 230 000 km2) (figure 1). With an average summer temperature between ∼15 ℃ and 19 °C, and a wide range of precipitation totals from ∼60 to 250 mm, the remaining 14% of TGRs are distributed across Chile (∼150 000 km2), New Zealand (∼110 000 km2), and the western United States (∼60 000 km2) (figure 1, table S11).
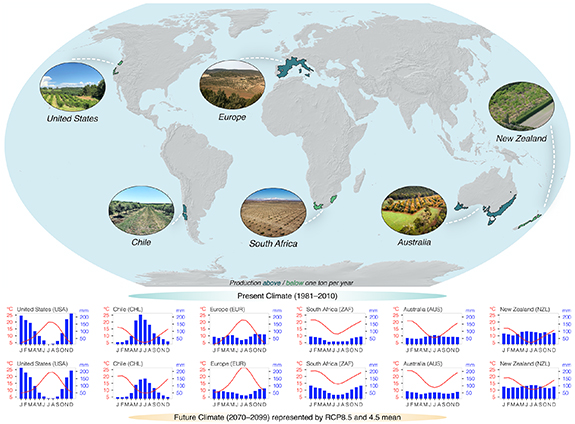
Figure 1. Truffle regions and climate conditions. Global distribution of truffle growing regions and their corresponding climate diagrams of monthly temperature means and precipitation totals for 'present' (1981–2010; upper row) and 'future' climate (2070–2099; lower row). Photo courtesy of G Booth (Australia), W Tewnion (New Zealand), S O'Toole (California), R Ramírez (Chile), P Miros (South Africa), and D Oliach (Europe). Reproduced with permission from G Booth, W Tewnion, S O'Toole, R Ramírez, P Miros, and D Oliach.
Download figure:
Standard image High-resolution imageAll TGRs are almost certain to undergo changes in summer temperature means, precipitation totals and the availability of moisture in the topsoil during the 21st century (figure 2). Averaging over all TGRs trajectories, summer temperatures under RCP8.5 will increase at a rate comparable to the global land average (∼0.6 °C decade−1). However, significant differences exist between regions. Europe is the fastest warming region, where decadal temperature means rise at ∼0.7 °C (RCP8.5) (figure 2). Other regions are warming comparably or more slowly than the rest of the global land surface (∼0.4 °C decade−1 under RCP8.5), excluding Antarctica. In contrast to the global precipitation increase (+4% by the end of 21st century), most TGRs are projected to experience long-term drying under the high-emission scenario, especially Europe (−31%), the United States (−25%) and Chile (−62%). Only eastern South Africa (both RCPs) and southeastern Australasia (RCP8.5) are likely to mitigate water shortage due to future precipitation increases (+8% and 9% under RCP8.5) (figure 2). Projections for Australasia are also not exhibiting any significant trends (RCP8.5) for the moisture content in the upper soil layer. The upper soil moisture content in all other TGRs, however, is expected to decline ∼50% faster compared to the rest of the global land surface (RCP8.5).
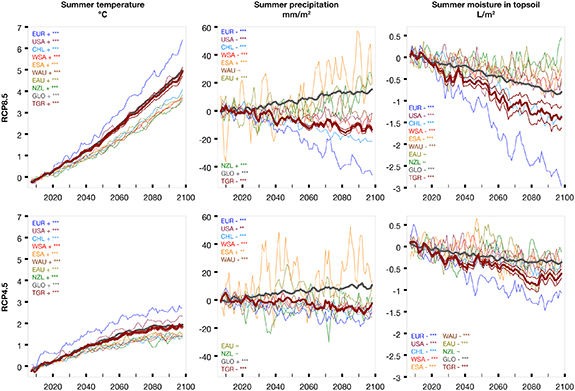
Figure 2. Climate projections. Bias-corrected predicted summer temperature (°C), precipitation (mm) and moisture in upper portion (∼10 cm) of soil column (l m−2) under RCP4.5 and RCP8.5. The 2006–2099 data (X-axis: smoothed by three-year running average) are presented as anomalies relative to the 2006–2020 baseline mean. While colored thin lines symbolize the individual truffle regions, the bold-transparent red and gray contours represent the truffle (TGR = all truffle growing regions combined) and the remaining global land surface (GLO), respectively. The GLO for soil moisture excludes Antarctica and TGR is accompanied by confidence intervals (95%) to show the variability between GCMs. Statistically significant increasing (+) or decreasing (−) trend is symbolized with an asterisk (** = 95%, *** = 99%) of a non-seasonal Mann–Kendall trend test (applied for 2006–2099).
Download figure:
Standard image High-resolution imageProjected trends for RCP8.5 associated with distribution shifts in climate parameters are likely to increase the frequency of extreme summer temperatures in all TGRs (p < 0.05; figure 3). This trend will be particularly pronounced in north-eastern Australia (figure 3(g)), where year-to-year variability in precipitation totals between the early and late periods (2020–2039 versus 2070–2099) rises substantially (SD + 15 mm m−2). A less distinct but still positive SD difference is apparent in Europe (SD + 5 mm m−2 in Spain and France), the United States (SD +5 mm m−2), western Australia (SD + 5 mm m−2) and New Zealand (SD + 10 mm m−2; figures 3(c)–(g)). The interannual variability in topsoil moisture is expected to be more stable in all TGRs (figure 3(b)), but specific regions such as central Spain, eastern South Africa, south-eastern Australia and New Zealand will be subject to greater variability at the end of this century (SD + 0.2–0.4 l m−2 on average).

Figure 3. Temporal changes in climate variability. Expected change in interannual variability (RCP8.5) of summer temperature, precipitation, and moisture in the upper ∼10 cm of the soil column, expressed as the difference in standard deviation between the early (2010–2039) and late (2070–2099) periods. (a), (b): distribution functions (adjusted for bias) are calculated from the mean and standard deviation for each period after calculating the area-average of all truffle-growing regions (TGR) and the remaining global land surface (GLO). Statistically significant difference in variance (non-parametric Levene's test) is symbolized with an asterisk (** = 95%). (c)–(g): spatial distribution of climate extremes expressed as the positive (increasing) or negative (decreasing) difference in standard deviation between two periods for all grid cells in each truffle-growing region.
Download figure:
Standard image High-resolution imageOur MLR models estimate that truffle prices will increase by an average of 10% between 2021 and 2044, with only Chile experiencing a 6% decline (figure 4). By the end of the 21st century (2076–2099), truffles are projected to become on average 36% more expensive, except for those coming from Chile and New Zealand, where prices could decrease by ∼7% and 75%, respectively. Although production rates are projected to decline by only ∼5% (TGR average) from 2021 to 2044, by the end of the 21st century this parameter will decrease by 14%. With projected production losses of 39%, 56% and 81%, respectively, plantations in Europe, the United States and Chile are likely to be most affected in the last quarter of this century. On the other hand, estimates in Australasia will be comparable to current rates (1997–2020). Moreover, given the projected climate extremes, price levels and production rates by the end of the 21st century are projected to be more variable and therefore uncertain in many TGRs than in the 2021–2044 period (figure 4).
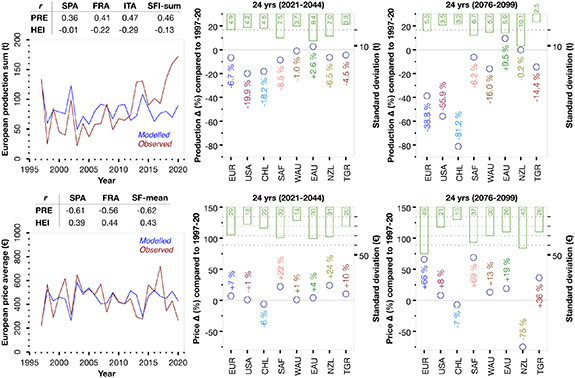
Figure 4. Truffle market. (Left) Agreement between observed and modeled truffle production rates in Europe (sum of Spanish, French and Italian data) and price levels (average of Spanish and French records) for the period 1997–2020 (24 years). The individual correlations between national datasets (SPA, FRA, ITA), European aggregates (SFI-sum and SF-mean), summer precipitation totals (PRE) and heat index (HI) are shown above the graphs. (Middle) The blue circles are the estimated differences (in %) in production rates (top) and price levels (bottom) for the near future (2021–2044) compared to the period 1997–2020. The green bars represent the standard deviation calculated over 24 years for this period. (Right) Similar to (middle) but targeting the end of the 21st century (2076–2099).
Download figure:
Standard image High-resolution image4. Discussion
4.1. Climate risk
A subtropical high-pressure ridge between spring and autumn forms the Mediterranean climate of all TGRs, and most of the annual precipitation supply depends on mid-latitude westerly winds in winter. With a warming-induced strengthening of the mid-latitude jet stream and a reduction of land–sea temperature gradients that maintain subtropical anticyclonic blocking and prolong summer droughts (Tuel and Eltahir 2020), the winters are likely to shorten, and precipitation totals are expected to decline in many TGRs (Cramer et al 2018). Exceeding previous calculations by about ∼15%–20% (Jacob et al 2014), JJA precipitation totals in southern Europe are predicted to decrease by almost ∼30%. That, in addition to a predicted increase of JJA temperatures ∼20% faster than the global average (figure 2 and Cramer et al 2018), will significantly accelerate soil drying by the end of the 21st century. Similar stressors will exacerbate future drought in the United States' TGRs (Mann and Gleick 2015), and increasing temperatures, decreasing precipitation, and soil aridification in central Chile will likely lead to ∼40% drier summer conditions from DJF by the end of the 21st century (Araya‐Osses et al 2020).
Future summer warming is projected for the whole of South Africa, although hydroclimatic conditions differ between the west and the east of the country (Roffe et al 2019). At the western coast (Western Cape), where the climate is usually drier (Roffe et al 2019), soil moisture content and precipitation totals in the austral summer and winter are expected to decrease over the 21st century (figure 2 and Pascale et al 2020). This, as well as the observed decline in winter precipitation across eastern South Africa in the past century (Net 2009), is in principle due to the drying and shifting of subtropical high-pressure ridge towards the pole (Rojas et al 2019, Pascale et al 2020). In contrast, summer precipitation in eastern South Africa (KwaZulu-Natal) exhibits a positive trend under the influence of the 'warm' Agulhas current bringing more air moisture (Beal et al 2011; figure 2). This is comparable with downscaled climate projections indicating increasing summer precipitation in parts of east-central South Africa (Hewitson and Crane 2006, Almazroui et al 2020), probably caused by intensified short-term heavy precipitation (Dosio et al 2019).
With future warming, high-emission projection for summer precipitation based on our GCMs' ensemble mean reveal non-significant trend for western Australia over the 21st century (figure 2), probably because of low agreement between the existing GCMs (Raut et al 2017). Some of these climate models, however, project a slight increase in summer precipitation in eastern Australia, which is consistent with the ensemble mean used in this study (figure 2 and Timbal et al 2017). In contrast, comparison between historical (1986–2005 CE) and future (2080–2099 CE) periods suggests that summer precipitation totals will increase by only 1% (Timbal et al 2017). Positive trends in summer precipitation have been suggested to originate from the intensification of short-term heavy rainfall events at timescales of hours to days (Dey et al 2019). Either way, decreasing water content in soil during summer in both Australian TGRs (RCP4.5; figure 2) corresponds with an annual decline in precipitation, particularly in winter (JJA), when most precipitation occurs (Delworth and Zeng 2014, Dey et al 2019). A decrease of winter precipitation is also projected for New Zealand's TGRs in the lowland east, as opposed to those plantations at higher elevations in the west, where precipitation is predicted to increase. However, summer precipitation under high-emission scenario is projected to increase in New Zealand, but decrease in the western part of this country. Fluctuating projected precipitation across New Zealand and a projected stability of soil moisture content are associated with a decreasing pace of westerly winds (Mullan et al 2018), and an increase in the frequency rather than the intensity of precipitation (Sansom and Renwick 2007).
Future warming will increase the frequency and intensity of extreme summer temperatures in most of the TGRs (figure 3). Comparison of measured and predicted climate data from Europe (1961–1990 versus 2071–2100 CE) shows that heatwaves are likely to become twice to five times as long, and their frequency will increase from one every three to five summers to about two to three heatwaves per season (Fischer and Schär 2010). In the United States, the frequency of heatwaves associated with longer drought episodes will double after 2050 CE, compared to the earlier period 1950–2000 (Cook et al 2015). In the Southern Hemisphere, increasing extremes of summer temperature and soil moisture content associated with intensified El Niño Southern Oscillation (ENSO) in the 21st century will cause more frequent heatwaves and longer drought spells in central Chile (Cai et al 2020), South Africa (Pascale et al 2020), and western Australia (Andrys et al 2017). Even where the influence of ENSO is relatively minor, extreme summer temperatures in eastern Australia are expected to rise (King et al 2017), and heatwaves in late-21st century are predicted to be common for New Zealand, likely due to low wind speeds associated with unusually positive phases of the South Annual Mode (Salinger et al 2019). While a more detailed discussion of possible drivers behind projected climate conditions is beyond the scope of this study, the uncertainty associated with the GCMs appears crucial for further research (see our expansion on GCMs uncertainty in SI).
4.2. Climate adaptation
As with other fungal species (Kauserud et al 2012, Diez et al 2013, Karavani et al 2018), anthropogenic climate change will exert regionally disproportionate effects on the quantity and quality of truffle yields in the 21st century. With the warm period largely stimulating truffle maturation, the subsequent winter harvest depends on the amount of the preceding summer precipitation (Büntgen et al 2019). Therefore, rapid summer warming, and a long-term precipitation decline in southern Europe will reduce the local truffle winter harvest by 39% and in turn increase prices by 66% (figure 4). Although there will be a 56% and 81% decline in truffle production in the western United States and Chile, our MLR models project a price change of only +8% and −7%, most likely due to slower warming. Disparity between production rates and the price levels is related to the fact that estimates of both variables depend only on climate, while lacking any economic behavior. Moreover, estimates in our models cannot reflect daily climate variability and short-term tolerance of truffles to heat stress (Garcia-Barreda et al 2019) via drought-resistant strains (Mello et al 2006). Due to the opposing relationship between October and November precipitation totals and Mediterranean truffle winter yields (Büntgen et al 2019), we suggest that the harvest in some TGRs, including those in the Southern Hemisphere (Rojas et al 2019), could be enhanced by a future decrease of precipitation in late autumn/early winter. This would be 'good news' for truffle industries in eastern Australia and New Zealand, where a weaker rate of evaporation from soil, coupled with positive precipitation anomalies are likely to mitigate shrinking water resources. That, combined with slower temperature increase in summer will maintain winter truffle production at a level comparable to 1997–2020 (+9.5% and −0.2%). With a price increase (decrease) of only 19% (75%), eastern Australia (New Zealand) is likely to provide more affordable truffles (figure 4).
All TGRs will require intensive irrigation to mitigate the negative effects of the predicted trends and extremes of anthropogenic climate change. Although current irrigation rates are estimated to buffer some future moisture losses in some TGRs (Cook et al 2020), sustaining such rates will likely not be possible under the gradual warming-induced decline in (sub)surface and ground water reserves (Trnka et al 2018). This, added to enhanced water conflict from other socio-economic factors and the expansion of plantations associated with changes in agricultural land-use for other crops will challenge the additional water supplies, particularly in the fast-warming TGRs in Europe, the United States, Chile and western South Africa, where summer precipitation is projected to decline until 2100 CE. However, a surplus of water from irrigation, not based on adequate knowledge of the truffle's lifecycle combined with ineffective cultivation techniques, might reduce the harvest through enhanced microbial decay (Eslick 2013). Furthermore, even without high-intensity irrigation, spatially variable extreme precipitation events in a warmer climate (figure 3) could super-saturate plantation soils, causing surface erosion, reduced soil oxygen content, and alternation of the physiochemical properties of soil associated with a decrease in the diversity and abundance of truffles (Barnes et al 2018, Yan et al 2019). Therefore, the extent, frequency and intensity of irrigation in truffle plantations should not only compensate for future summer precipitation deficits (e.g. estimated ∼430 m3 ha−1 in Europe under RCP8.5), but also incorporate understanding of edaphic factors and ecophysiological adaptations of associated host partners, such as drought-controlled rhizogenesis and hydraulic redistribution (Büntgen et al 2019). We emphasize the necessity of increasing knowledge of fungus-host interaction under future ecological range shifts and phenological widening (Kauserud et al 2012), as well as for changes in resource availability. Nutrients for mycelial development, which starts earlier under warmer conditions, are depleted over a longer period, limiting subsequent fruiting body growth, and reducing fungal abundance and diversity (Gange et al 2013, Damialis et al 2015). Moreover, truffle growers should account for potential indirect effects associated with pathogens (Leiodes cinnamomea) (Büntgen et al 2019), especially for the cultivation of truffles in the conditions of rapid warming. On the other hand, adaptation of the truffle industry should take advantage of existing measures, such as the use of drought-tolerant host species. The sector should further benefit from elevational shifts in suitable climatic conditions that have already been observed in other fungal species (Diez et al 2020).
In addition to implications for agriculture and ecology, climate-induced changes of the global truffle sector will have wide-ranging economic consequences (figure 5). While the truffle sector is vulnerable to global challenges such as the financial crash in 2007/2008 or the current COVID-19 pandemic that resulted in both lower demands due to closures of businesses, and harvest declines associated with less workforce (Büntgen et al 2021), region-specific future climate developments are likely to lead to large-scale shifts in global truffle production and trade. In particular, the stability of the truffle sector will worsen in fast-warming regions with an estimated precipitation and thus production decline such as in southern Europe, where plantations expand each year by ∼2220 ha and harvesting employs over ∼210 000 people together with an even higher number of truffle-searching dogs (Reyna and Garcia-Barreda 2014). Conversely, expanding TGRs such as those in eastern Australia and New Zealand will profit from increased (or at least stable) production, while new suitable regions in Turkey and the greater Caucasus region may benefit from starting cultivation interest, though further educational support is required to encourage development in areas without a history of truffle culture.

Figure 5. Risk and reward of the emerging truffle sector. Global (long-term) and local (short-term) challenges and opportunities under social, management, and scientific perspective of truffle hunting and cultivation.
Download figure:
Standard image High-resolution image
With increased human involvement in cultivation and eco- or myco-tourism, the prestige and exclusivity of the truffle sector is expected to rise, regardless of the impacts of climate change. This trend, however, requires careful management, as unlawful harvesting and trading, together with the introduction of competitive truffle species and the reduction of genetic diversity, could become serious threats to sustainable truffle production and product quality protection, and will need robust legal regulation in both established and emerging TGRs worldwide. With regional support being pivotal in coping and capitalizing on the predicted changes yet to come, our findings offer a tool to inform future policy, investment and decision-making in the development sustainable, optimized, global cultivation truffle management.
5. Conclusion
By the end of the 21st century, all TGRs are expected to experience significant climate change. State-of-the-art model simulations project that 2.3 million km2 of suitable land for truffle growth will experience 50% faster aridification than the rest of the global land surface, with significantly more heat waves between 2070 and 2099 CE. Global truffle production rates will decrease by ∼15%, while associated price levels will increase by ∼36%. At the same time, a predicted increase in summer precipitation and less intense warming over Australasia will likely alleviate water scarcity and support higher yields of more affordable truffles. Our findings are relevant for truffle farmers and businesses to adapt their irrigation systems and management strategies to a warmer and drier future.
Acknowledgments
This study was supported by the projects 'SustES – Adaptation strategies for sustainable ecosystem services and food security under adverse environmental conditions' (CZ.02.1.01/0.0/0.0/16_019/0000797) and 'Geografický výzkum dynamiky přírodních a společenských prostorových procesů (GEODYN)' (MUNI/A/1570/2020). UB received additional funding from the ERC Advanced project Monostar (AdG 882727).
Data availability statement
All data used in this study are included in the article and its online supplementary materials.
Author contributions
U B conceived the main idea and T Č designed and carried out the analyses. T Č wrote the manuscript with input from E L I, D O, S E, F M P, M T, P T and U B. All authors contributed critically to the discussion and interpretation of the results, and approved submission.
Conflict of interest
The authors declare no competing interest.