


Abstract
Climate change and human activities have drastically altered the natural wildfire balance in the Western US and increased population health risks due to exposure to pollutants from fire smoke. Using dynamically downscaled climate model projections, we estimated additional asthma emergency room visits and hospitalizations due to exposure to smoke fine particulate matter (PM2.5) in the Western US in the 2050s. Isolating the amount of PM2.5 from wildfire smoke is both difficult to estimate and, thus, utilized by relatively few studies. In this study, we use a sophisticated modeling approach to estimate future increase in wildfire smoke exposure over the reference period (2003–2010) and subsequent health care burden due to asthma exacerbation. Average increases in smoke PM2.5 during future fire season ranged from 0.05 to 9.5 µg m−3 with the highest increases seen in Idaho, Montana, and Oregon. Using the Integrated Climate and Land-Use Scenarios (ICLUS) A2 scenario, we estimated the smoke-related asthma events could increase at a rate of 15.1 visits per 10 000 persons in the Western US, with the highest rates of increased asthma (25.7–41.9 per 10 000) in Idaho, Montana, Oregon, and Washington. Finally, we estimated healthcare costs of smoke-induced asthma exacerbation to be over $1.5 billion during a single future fire season. Here we show the potential future health impact of climate-induced wildfire activity, which may serve as a key tool in future climate change mitigation and adaptation planning.
Export citation and abstract BibTeX RIS

Original content from this work may be used under the terms of the Creative Commons Attribution 4.0 license. Any further distribution of this work must maintain attribution to the author(s) and the title of the work, journal citation and DOI.
1. Introduction
Over the past 40 years, wildland fires have increased significantly, especially in regions like Australia and the Western US, with the past several fire seasons ranking among the most devastating in history. This heightened activity is characterized by increases in severity, frequency, size and longer fire seasons [1, 2]. Smoke plumes from these fires can affect large areas, extending across county, state/province, and country borders. It has been suggested that climate change may explain some of these recent fire anomalies due to conditions that increase the likelihood of a wildfire occurrence, including higher temperatures, high winds, low soil moisture or drought, fuel load and urban development of forested areas [3–9]. Additionally, fires are most often started either by lightning or human error [10]. Hence, the chance of a fire event is heightened and complicated by human encroachment of fuel-rich areas and continued favorable fire conditions due to changes in weather and long-term climate shifts.
One of the most significant threats to health from fire smoke exposure comes from airborne particles less than 2.5 µm in aerodynamic diameter, or PM2.5. Early research suggested that the particulate constituents of wildfire smoke may be more toxic than ambient PM2.5 [11, 12]. This could be due to the higher concentrations of harmful substances in smoke-related PM2.5 such as organic compounds like formaldehyde and methanol. Therefore, it is important to differentiate smoke PM2.5 from concentrations to enhance our understanding of the potential mechanisms affecting health outcomes.
Previous work exploring the effects of wildfire on human health has established associations between smoke exposure and multiple health outcomes and much of this research relies on the characterization of smoke as total PM2.5 concentrations on smoke days compared to non-smoke days [13–17]. Additionally, some previous research has used chemical transport models and unique fire contributions to model past fire episodes and predict exposure levels in the surrounding areas. For example, Koman et al uses chemical transport model simulations with and without wildfire emissions to create a gridded smoke PM2.5 surface for the state of California [18]. While multiple approaches were used to estimate population exposure, an analysis of health outcomes was not included and further work is needed to enhance our understanding of the future public health impacts of smoke PM2.5. Additionally, the approach in Fann et al also utilizes differences in CMAQ simulations with fire emissions supplied by both EPA and Sonoma Technology SMARTFIRE systems in 2008–2012 [19]. Health endpoints in this study include mortality and respiratory hospital emissions, with 5200–8500 additional annual hospitalizations and a total excess mortality count of 1500–2500 over the entire study period. These excess outcomes were estimated to cost anywhere from $11 and $20 billion dollars per year in the US.
Given the potential effects of wildland fire under continuing climate change, it is important to understand the human health and economic tolls that may be expected in the future. To date, few studies have focused on quantifying this future impact, largely due to the complexity of methods and modeling systems required to do so. Liu et al [20] used methods to identify 'smoke wave' events and then projected the health impact of these future events on elderly populations in 561 Western US counties. Authors estimate that 178 additional respiratory admissions in the elderly could result from climate-induced changes in wildfire PM2.5 [20]. In another study, Neumann et al 2021, authors use the GEOS-Chem chemical transport model to estimate future wildfire PM2.5 concentrations on a 0.5 × 0.625 degree spatial scale and use the Benefits Mapping and Analysis Program (BenMAP) system from the US Environmental Protection Agency (USEPA) to predict future impacts of wildfire smoke exposure on human health. Results from this study indicate that significant increases in respiratory outcomes could result from wildfire smoke exposure [21]. Both studies, while similar in purpose, have certain limitations that must be considered. Liu et al [20] focuses on an elderly subset of the population and, hence, does not provide key details concerning individuals at other stages of the lifespan. Neumann et al [21] includes estimations for all ages, but is limited by the use of relatively coarse wildfire PM2.5 estimates, utilization of present rather than future meteorological conditions, and population exposure based on annual average concentrations of smoke PM2.5—all of which could potentially lead to an underestimation of the impact of smoke PM2.5.
Our current study investigates the asthma health impacts of increased future wildland fire activities due to climate change in the Western US. We adopted a differences in CMAQ simulations approach to estimate increases in smoke PM2.5 at 12 km resolution based on baseline and future year chemical transport model simulations driven by dynamically downscaled regional climate conditions. We then estimated the excess asthma incidents in the Western US due to exposure to smoke PM2.5 in the 2050s based on a concentration-response relationship developed in Colorado as well as projected county-level population distribution. Finally, we characterized spatial characteristics of the additional health care costs associated with these asthma incidents.
2. Materials and methods
2.1. Study domain
Our study domain includes the Western US states of Washington, Oregon, California, Nevada, Arizona, Idaho, Montana, Wyoming, Utah, Colorado, and New Mexico. Much of the Western US is made up of coastal lowlands, desert plains, and mountainous regions with low-lying valleys. The region receives less annual rainfall than states on the East Coast, and arid conditions prevail in many areas [22]. The large mountain ranges that run from north to south (Rocky Mountain and Sierra Nevada Ranges) greatly affect both the climate and weather, as well as patterns of development and urbanization.
2.2. Dynamical downscaling framework for exposure assessment
In order to characterize the impact of climate change on wildfire-specific PM2.5, we established our baseline years as 2003–2010 and future years as 2050–2059. A dynamical downscaling approach similar to Gao et al [23, 24] with updated regional chemistry and emission inputs was adopted to estimate baseline and future wildfire smoke PM2.5 [23, 24]. The global climate model simulations under IIASA (International Institute for Applied Systems Analysis) RCP8.5 scenario used the Community Earth System Model v1.04 (CESM) with the Community Atmosphere Model v4 (CAM4), the Community Land Model (CLM4), the Parallel Ocean Program v2, and the Los Alamos National Laboratory Sea Ice Model v4 [25]. Global chemistry was incorporated using the Community Atmosphere Model with Chemistry (CAM-Chem)[26]
We used the CESM outputs generated previously and found in the Coupled Model Intercomparison Project (CMIP5) archive on the Earth System Grid Federation. The outputs from the CESM supplied the initial and boundary conditions for the regional climate models and were used to dynamically downscale meteorology from the Weather Research and Forecasting Model v3.2.1 (WRF) [27]. WRF outputs were then processed through the Meteorology Chemistry Interface Processor that provides the initial and boundary conditions for meteorological inputs in the Community Multiscale Air Quality Modeling System (CMAQv5.2) [28]. Chemistry inputs for CMAQ were downscaled from the CAM-Chem model embedded in CESM and more details on the CAM-Chem model and validation can be found in Gao et al [23, 24]. The CMAQ baseline year simulations incorporate updated anthropogenic emissions from the United States Environmental Protection Agency (USEPA), and fire emissions from the Fire Inventory from NCAR (FINN v1.5), and the Global Fire Emissions Database (GFED4.1s) temporal profiles [29, 30]. Future CMAQ simulations used projected WRF-Chem meteorology for 2050–2059 and future year anthropogenic emissions were based on the IIASA's emission projections from the baseline level [31]. Our CESM-WRF-CMAQ system was run four times with fire emissions toggled on (referred to as 'all-emissions' simulation) and off (referred to as 'no-fire' simulation) in the present and future years, respectively.
2.3. Isolation of smoke PM2.5 and calculation of climate-related increase for 2050–2059
We used a difference-of-differences approach to isolate smoke PM2.5 as illustrated in supplemental figure 1 (available online at stacks.iop.org/ERL/17/014023/mmedia). We first estimated smoke PM2.5 in the baseline years and future years by subtracting PM2.5 concentrations of the no-fire simulation from the outputs of the corresponding all-emissions simulation. We then took the difference between the simulated smoke PM2.5 in the future years and baseline years to estimate the increase in smoke PM2.5 concentrations that we might expect under RCP8.5 conditions in the 2050s. Finally, we aggregated the smoke PM2.5 data to the county level using population-weighted methods based on US Census tract-level data in order to estimate the health impacts of additional smoke PM2.5 due to climate change.
2.4. Health impact assessment
We estimate the change in emergency department visits (ED) and hospitalizations for asthma that would result from the estimated change in wildfire smoke PM2.5. In a previous study, we calculated the concentration response functions (CRFs) for asthma in the state of Colorado (OR per 1 μg m−3 increase in smoke PM2.5 = 1.081, 95% CI = 1.058, 1.105) [32]. Additionally, we calculated a statewide average asthma incidence rate (10.47 per 10 000) [32]. In this current analysis, we applied these metrics to all states in the Western US in order to model future asthma burden.
To better understand the potential future impact of smoke exposure on human health, we elected to use emissions and population scenarios that are aimed at estimating the upper bounds of increased health events. To calculate the baseline incidence of future asthma events, we used the average daily incidence from the Colorado study and applied it to the Integrated Climate and Land Use (ICLUS) A2 population scenario, which matches closely to the RCP8.5 emissions scenario [33]. Other ICLUS population scenarios are tested in sensitivity analyses. We estimated changes in asthma events for the years 2050–2059 at the county level using the following equation:
where ΔED represents the future change in county asthma events visits due to future increase in smoke PM2.5 concentrations; yo is the daily asthma incidence taken from the Colorado wildfire analysis, ΔsmokePM is the calculated average increase in smoke PM2.5 concentrations from the difference calculations described above; β is the effect estimate (on the log odds scale), also from the Colorado wildfire study; and popA2 is the projected county population. This formula is derived from the general logistic formula found in Greene (1997) and can be found in the supporting information for the USEPA's BenMAP program [34, 35].
We also estimated the additional healthcare costs associated with increased smoke-induced asthma events in the 2050s. The CRF derived from the Colorado study was calculated for combined asthma ED and hospitalization events. Thus, a multi-year, multi-state database from the Western US was used to calculate the average ratio of ED vs hospital visits. The methods used in calculating total costs is illustrated by the following equation:
where TotalCost is the state-specific cost of combined asthma hospitalizations and ED visits; P1 is the state-specific estimated proportion of events attributed to ED visits; Asthmatotal is the total expected number of combined asthma ED and hospitalization events; EDstate is the state-specific average cost of an ED visit; P2 is the state-specific estimated proportion of events attributed to hospitalizations; Asthmatotal is the total expected number of combined asthma ED and hospitalization events; Coststate is the state-specific average cost of a hospitalization; Staystate is the state-specific average length of a hospital stay in days; and Asthma_hospdays is the average length of asthma-specific hospital stay in days. Information on the average cost of an asthma ED visit was obtained at the state level from the Health Care Cost Institute (HCCI) for 2015 and amounts are in 2015 US dollars [36]. Average hospital visit costs were calculated using published data on average asthma hospital stay (3.8 d) and drawn from material published by the Healthcare Cost and Utilization Project (HCUP) for 2015 [37, 38]. Two states, Montana and Idaho, do not report data to HCUP and state-specific data was unavailable for hospital stay in those states. Instead, we approximated hospital charges by averaging charges from multiple states with similar ED visit charges (WY, OR, UT & NM). We make the conservative assumption that healthcare costs do not increase in real terms over time. To put the economic burden into context, we compared estimated healthcare charges with other commonly reported economic impacts from wildfire activity, including cost of wildfire and structural damage from the United States Forest Service, Department of the Interior, and the National Centers for Environmental Information [39, 40].
3. Results
3.1. Spatial patterns of smoke PM2.5
Figure 1 shows the distribution of mean smoke PM2.5 concentrations from 180 fire season (May–October) days each year on the CMAQ 12 km grid during baseline years, future years, and their difference. Historical mean smoke PM2.5 concentrations range from >0.01 to 12.2 µg m−3. Future mean PM2.5 smoke concentrations range from 0.03 to 11.6 µg m−3. Areas with larger increases are evident in Northern Idaho (8.0 µg m−3), Southwest Montana (9.5 µg m−3), southwest Washington (8.5 µg m−3), the Oregon coast (7.5 µg m−3), and widespread minor increases over much of the state of Nevada (1.9 µg m−3). Besides Nevada, these areas carry some of the highest fuel loads (i.e. forests and grasslands).
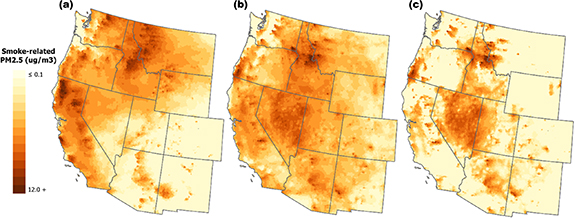
Figure 1. Gridded and county-level daily increases in fire PM2.5. (a) depicts the past daily mean smoke PM2.5 for the 2000s on a 12 km CMAQ grid. (b) shows the future predicted daily mean smoke PM2.5 for the 2050s, and (c) shows the increase in smoke PM2.5 (i.e. difference between (b) and (a).
Download figure:
Standard image High-resolution imageFigure 2(a) plots gridded average smoke contribution to total PM2.5 concentrations for the baseline years. During a given fire season, smoke PM2.5 may represent 50% or more of the total PM2.5 exposure at a specific location with higher concentrations found in northern California (up to 77%), northern Washington (up to 76%), western Montana (up to 68%), and Idaho (up to 60%). Lower past concentrations are evident along the coastline and in New Mexico and Colorado. Figure 2(b) shows the projected smoke contribution in the 2050s. Highest ratios of smoke to total PM2.5 are located in western Montana (up to 84%), Idaho (up to 82%), southeastern Washington (up to 81%), and southwestern Oregon (up to 76%). Future patterns of smoke exposure indicate a potential shift in spatial distribution as well as increases in smoke contribution to total PM2.5. For example, past areas of high concentration in northern California do not appear as prominent in the 2050s, while areas demonstrating moderate baseline concentrations show higher future concentrations such as those seen on the coast of Oregon (34% baseline versus 76% future).
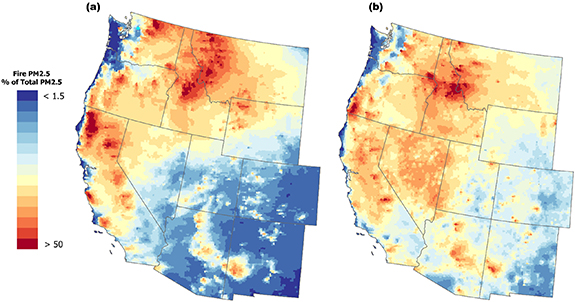
Figure 2. Gridded and county-level daily increases in future fire PM2.5 as a percentage of future total PM2.5. (a) depicts the gridded past years (2003–2010) daily smoke PM2.5 as a percentage of total PM2.5 on a 12 km CMAQ grid. (b) plots the gridded future daily smoke PM2.5 as a percentage of total PM2.5 on a 12 km CMAQ grid.
Download figure:
Standard image High-resolution image3.2. Increased smoke impact on asthma events
The count of wildfire smoke-related excess asthma events by county due to increased wildfire activity is shown in figure 3(a). Across the region, we estimated an increased rate of fire-related asthma event at 15.1 ED visits per 10 000 persons (figure 3(b)). The counties with the highest daily number of excess asthma events are found in California, Arizona and Washington (19 090; 5163; and 3996; respectively). Figure 3(b) presents the results normalized by population, which changes the burden distribution to reflect number of events compared to population size, though the overall trends remain. Some key differences baseline and future burdens are evident in central California, Washington, Montana and Nevada, but several of the 'hotspots' remain such as those seen in Northern Idaho and the coast of Oregon.
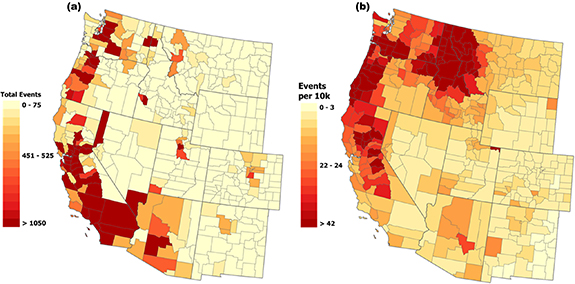
Figure 3. Excess Fire Season Increase in Asthma Events. (a) shows the plotted mean total # of excess events in a given fire season and (b) shows mean excess events per 10 000 persons.
Download figure:
Standard image High-resolution imageResults for additional ICLUS scenarios A1, B1, and B2 can be found in supplemental table 1. Across all Western states, there were ∼150 000 excess asthma events per wildfire season (see table 1, total asthma events among population scenarios range from 137 325 to 155 181). Total asthma counts were highest in California, but rates were highest in Oregon. Under the ICLUS A2 scenario, the populations of most states will increase except for Montana and Wyoming. States with declining populations may have less capacity to handle increased health burdens.
Table 1. Statewide increases in smoke PM2.5 asthma ED visits compared to increases in population.
| State | ICLUS A2 population 2050 | Population % change | Excess fire-related asthma events (2050s) | Excess asthma events (per 10 000) |
|---|---|---|---|---|
| Western US | 102 960 267 | 70% | 155 181 (112 693, 198 713) | 15.1 (9.3, 19.3) |
| Arizona | 9292 890 | 81% | 8386 (6082, 10 753) | 9.0 (6.5, 11.6) |
| California | 55 926 148 | 69% | 87 214 (63 306, 111 733) | 15.6 (11.3, 20.0) |
| Colorado | 9716 598 | 126% | 3794 (2750, 4867) | 3.9 (2.8, 5.0) |
| Idaho | 1599 933 | 24% | 5170 (3758, 6613) | 29.4 (23.5, 41.3) |
| Montana | 760 541 | −16% | 2528 (1842, 3226) | 33.2 (24.2, 42.4) |
| Nevada | 5239 125 | 162% | 3470 (2517, 4451) | 6.6 (4.8, 8.5) |
| New Mexico | 3009 620 | 66% | 1359 (985, 1743) | 4.5 (3.3, 5.8) |
| Oregon | 3927 810 | 15% | 16 449 (11 979, 21 003) | 41.9 (30.1, 53.5) |
| Utah | 4472 174 | 100% | 4264 (3092, 5467) | 9.5 (6.9, 12.2) |
| Washington | 8714 575 | 49% | 22 383 (16 263, 28 645) | 25.7 (18.7, 32.9) |
| Wyoming | 300 853 | −39% | 166 (120, 212) | 5.5 (4.0, 7.1) |
3.3. Future increases in health care costs
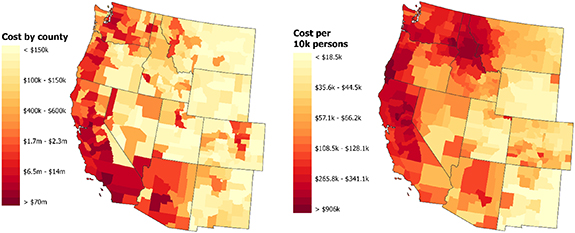
In the Western US, we estimate a total of ∼$1.5 billion in increased costs per fire season due to additional smoke-related asthma events (rate of $150 000 per 10 000 persons) in the 2050s. In figure 4 as well as table 2, we report the average increase in health care costs from the estimated increase in smoke-related asthma events per fire season. Smoke PM2.5 exposure is expected to cost California ∼$1.03 billion, followed by Washington (∼$182 million), Oregon (∼$99.7 million), Arizona (∼$73.8 million), Nevada (∼$39.1 million), Colorado (∼$38.4 million), Idaho (∼$28.1 million), Utah (∼$24.7 million), Montana (∼$13.5 million), New Mexico (∼$7.3 million), and Wyoming (∼$825 000). Fire prone and densely populated counties such as Los Angeles County, CA are expected to bear the highest total cost (Los Angeles County = ∼$226.6 million).
Figure 4. Predicted fire season total cost increase due to smoke PM2.5 exposure. Average total fire season cost of increases in smoke PM2.5 (in thousands of dollars) normalized by population.
Download figure:
Standard image High-resolution image
Table 2. Predicted statewide fire season total cost increase due to smoke PM2.5 exposure. Increase in average fire season cost for increases in smoke PM2.5 in total state burden and burden normalized by population. An expanded table, complete with confidence intervals for all values can be found in supplemental table 2.
| State | Excess fire-related asthma events (2050s) | Total hospital visit charge | Total ER visit charge | Total combined charges | Cost per 10 000 persons |
|---|---|---|---|---|---|
| Western US | 155 181 (112 693, 198 713) | $1380 311 133 | $162 808 779 | $1543 140 113 | $149 644 |
| Arizona | 8386 (6082, 10 753) | $64 433 425 | $9399 948 | $73 833 373 | $79 451 |
| California | 87 214 (63 306, 111 733) | $936 075 673 | $99 192 429 | $1035 268 102 | $185 113 |
| Colorado | 3794 (2750, 4867) | $33 211 630 | $5270 148 | $38 481 778 | $39 604 |
| Idaho | 5170 (3758, 6613) | $24 890 377 | $3196 339 | $28 086 716 | $159 519 |
| Montana | 2528 (1842, 3226) | $12 171 711 | $1382 699 | $13 554 410 | $178 221 |
| Nevada | 3470 (2517, 4451) | $34 227 380 | $4871 759 | $39 099 138 | $74 629 |
| New Mexico | 1359 (985, 1743) | $6188 762 | $1170 912 | $7359 674 | $24 454 |
| Oregon | 16 449 (11 979, 21 003) | $87 018 664 | $12 732 433 | $99 751 096 | $253 961 |
| Utah | 4264 (3092, 5467) | $21 378 813 | $3342 204 | $24 721 017 | $55 277 |
| Washington | 22 383 (16 263, 28 645) | $160 006 814 | $22 152 999 | $182 159 813 | $209 029 |
| Wyoming | 166 (120, 212) | $728 085 | $96 911 | $824 997 | $27 422 |
When normalized by population, the greatest increase in healthcare cost are found in Asotin County, Washington; Coos, Curry and Josephine counties in Oregon; Sutter and Yuba counties in California, Ravalli County in Montana, and Idaho County in Idaho. The cost distribution is affected by both smoke PM2.5 levels and regional healthcare costs. Additionally, it is evident that, in some of the identified hotspots, the burden on some states is higher when compared with the relative size of the state and potential resources. For instance, Idaho, with a much smaller population and total annual cost, has a greater burden in cost per 10 000 persons than the most populated state, California. Based on the results shown in this table, it appears that many of the states and counties that experience higher rates of increase in additional events may carry a disproportionate burden when it comes to the actual cost increase associated with these events. To give context to our estimation of increased healthcare burden, the 2015 total cost of firefighting and suppression is ∼$2 billion [39].
4. Discussion
To our knowledge, this study is the first to look at the future impact of wildfires on a regional scale using a dynamical downscaling framework. We were able to differentiate smoke PM2.5 concentrations from all other sources of PM2.5 for a baseline period (2003–2010) and a future period (2050–2059) in the Western US under the RCP8.5 scenario. By calculating the difference between the past and future levels, we estimated the increased health burdens that may be expected in the 2050s due to climate change at the county level. Additionally, we adopted region-specific health metrics, including both asthma incidence rates and OR estimates for fire season asthma risk estimates in Colorado, to tailor our approach to typical Western US conditions.
As we hypothesized, many areas in the Western US are expected to see substantial increases in adverse health impact related to smoke PM2.5 exposure due to climate change. Accounting for population growth using population normalization, we found an average seasonal increase of 15.1 asthma events for every 10 000 persons per fire season in the 2050s. Increases in expected asthma events varied by county and state, with some consistent hotspots seen in northern Idaho, Nevada, and the coast of Oregon. While the spatial distribution of burden changed somewhat, the areas with the highest additional expected asthma events were unchanged. Given evidence suggesting that fire smoke PM2.5 may be more toxic than ambient PM2.5 concentrations, and based on the results from our previous work, we also analyzed the results by the percent contribution of smoke PM2.5 to ambient PM2.5 [11, 12, 32]. While there was some loss of resolution due to aggregation, the overall pattern is informative and may be a useful tool in planning for future health impacts. This additional strain is also apparent in the increases in healthcare costs attributed to the additional asthma events related to fire smoke PM2.5. Using hospitalization and ED data from 2015, we calculated the potential monetary burden by county. Similar patterns were seen across states, with Idaho, Montana, Washington and Oregon experiencing some of the highest economic impacts. However, it is also important to look at changes in population. For example, Oregon has the highest rate of increase in total events, with a lower positive increase in population. Compared to Oregon, the state of Montana has a lower rate of increase but loses population over the same period. Hence, emphasis on states with low population growth and relatively high rates of increase in asthma events may be crucial to any action or policy decisions. The total fire-season cost for the region was ∼$1.5 billion or $150 000 per every 10 000 persons.
While little has been done to predict the health burden of future fires, one recent study has by Neumann et al estimated the health and economic burden of future fire activity [21]. The authors calculated wildfire attributable PM2.5 for the 2050s and the 2090s for two RCP scenarios, RCP4.5 and RCP8.5, using the GEOS-Chem chemical transport model system. Using a difference-of-differences modeling approach, these authors isolated climate-driven wildfire emission changes. Estimates of fire-specific asthma exacerbation for RCP4.5 are 71 000 yearly cases and 110 000 cases aged 6–18 for RCP8.5. Given that the majority of cases trends to younger populations, this quantification of asthma impact aligns with our estimation of ∼150 000 additional visits for all ages in a given fire season.
Other recent studies have also aimed to estimate contributions of fire smoke to total PM2.5 concentrations. For example, Matz et al separated smoke-related PM2.5 in Canada using the Global Environmental Multi-scale model (GEM-MACH) and FireWork [41]. Using these simulations, the authors quantified smoke related exposure by taking the difference between FireWork and GEM-MACH. This short-term fire smoke exposure calculation was then used to estimate both acute and chronic health impacts from 2013 to 2018. Similar to our analysis, authors saw increased impacts for asthma and other health outcomes. Specifically, Matz et al estimated an additional 100 000–240 000 cases during the study period. Our model also uses a calculated difference approach; however, the exposure simulations use the CESM and CMAQ outputs to estimate both past and future smoke exposure—with differing meteorology, chemistry, and wildfire inputs for the present and future years. Jiang et al used a calculated difference approach for a fire-related epidemiologic analysis in the Eastern US [42]. Similar to our approach, the authors utilized CMAQ simulations with and without fire signals. However, our analysis utilizes updated anthropogenic emissions from the USEPA and the latest fire emissions from the FINN. Their health impact analysis looked at excess respiratory hospitalizations in the eastern US in 2014 and focused on uncertainty in effect estimates and reported that, in 2014, 1397 (95% CI: (109, 7058)) excess respiratory hospitalizations were attributed to wildfire. While we can compare some of our environmental simulation approaches, it is difficult to compare the health impact analysis of Jiang et al with our results since our analysis focused on future disease burdens.
Other studies have approached smoke exposure estimation by using combinations of ambient PM2.5 and wildfire day signals in their modeling framework. For example, Liu et al estimated future wildfire-specific PM2.5 derived from GEOS-Chem model simulations based on a the SRES A1B scenario that assumes moderate growth in global emissions [20]. Using this framework, the authors estimated future (2046–2051) fire PM2.5 levels on a 0.5°× 0.67° grid, aggregating to county level to match outcomes in elderly populations (65+). In addition to calculating wildfire specific PM2.5, the study defined 'smoke wave' events as at least two consecutive days with smoke PM2.5 concentrations higher than the 98th percentile of all fire specific PM2.5. Similar to our work, they calculated the change in the number of respiratory hospital admissions by taking the difference between future and past conditions, estimating an increase of 178 (95% CI: 6.17, 361) respiratory hospitalizations due to wildfire exposure in the elderly. Given that these results were only estimated for the elderly population and in a lower spatial resolution, our estimations present much higher incidences of hospital admissions, totaling 27 932 (95% CI: (20 284, 35 768)), when accounting for all ages. While the Liu et al approach is informative, we made different choices for our projections together with the results of our previous Colorado smoke-specific PM2.5 analysis [15]. In that study, we did not find significant associations for respiratory admissions among the elderly populations for 3 day moving average smoke PM2.5 exposure. Additionally, we did not constrain our methods to any type of exposure categorization (such as smoke waves). Instead, we chose to estimate the overall and age-stratified burden for any amount of smoke-specific PM2.5 exposure using the CESM-WRF-CMAQ modeling framework. This approach advances the quantification of smoke-specific PM2.5 concentrations using region-specific CRFs and may represent a better estimate of total health burden from future wildfires.
Our analysis includes a few limitations, most of which are related to the uncertainty of predicting future fire activity and resulting health effects. First, as with all models, misclassification for future wildfire exposure may be present, but these biases be non-differential. Second, the CRFs and incidence rates used for predicting the number of future asthma events came from a state-specific study in Colorado and may not be appropriate to extend to the whole Western US domain. While these differences could also bias the results, CRFs for western states may more closely resemble the CRF estimated in our Colorado study compared to nationally-estimated CRFs and therefore, might better estimate actual burden in the Western US. Additionally, the estimated CRF is for short-term effects of acute exposure and do not include any estimation of the long-term effects of repeated exposures to wildfire-specific PM2.5. Studies concerning long-term impacts of wildfire PM2.5 are limited, but the total impact of wildfire smoke PM2.5 (short-term + long-term) may have greater impacts over 'short-term-only' estimates. Third, there is also uncertainty related to projections of future population and emissions, which could alter the results based on the numbers at risk for exposure. And, finally, the cost of healthcare in the US is likely to change over time, and will perhaps increase substantially if recent trends continue [43]. Again, this information could affect the results, however, downward trends in cost increases are highly improbable and our assessment likely represents the lower bound of actual future cost.
5. Conclusion
The results of this work suggest that substantial increases in health burdens from exposure to wildfire smoke may occur by the mid-21st century. These results point to the growing need for both adaptation and mitigation measures in response to the increasing threat of wildland fires in the Western US. With high-resolution air pollution projections, we identified counties that may shoulder more asthma ED visits and hospitalizations and substantial associated costs. When normalized by population, some areas such as Montana were identified as bearing some of the heaviest health and economic costs despite expected overall loss in population. In total, across the Western US, we found that there are likely to be ∼150 000 asthma events that may amount to $1.5 billion or more in excess healthcare costs. This finding could prove beneficial in planning both wildfire response and policy measures.
Acknowledgments and Funding
The authors would like to thank Qingyang Zhu and Lin Wang for technical assistance provided. The work of J Stowell, G Geng, and Y Liu was partially supported by the NASA Applied Sciences Program (Grants #NNX16AQ28G and 80NSSC21K0507, PI: Y Liu). This publication was developed under assistance Agreement No. 83 586 901 awarded by the U.S. Environmental Protection Agency (PI: Y Liu). It has not been formally reviewed by EPA. The views expressed in this document are solely those of the authors and do not necessarily reflect those of the Agency. EPA does not endorse any products or commercial services mentioned in this publication.
Data availability statement
The data that support the findings of this study are available upon reasonable request from the authors.
Declaration of competing financial interests
The authors declare they have no actual or potential competing financial interests.