

Abstract
Coastal areas worldwide are often densely populated and host regional agricultural and industrial hubs. Strict water quality requirements for agricultural, industrial and domestic use are regularly not satisfied by surface waters in coastal areas and consequently lead to over-exploitation of local fresh groundwater resources. Additional pressure by both climate change and population growth further intensifies the upcoming water stress and raise the urgency to search for new fresh water sources. In recent years, offshore fresh groundwater (OFG) reserves have been identified as such a potential water source. In this study, we quantify, for the first time, the global volume of OFG in unconsolidated coastal aquifers using numerical groundwater models. Our results confirm previously reported widespread presence of OFG along the global coastline. Furthermore, we find that these reserves are likely non-renewable resources mostly deposited during glacial periods when sea levels were substantially lower compared to current sea level. We estimate the total OFG volume in unconsolidated coastal aquifers to be approximately 1.06 ± 0.2 million km3, which is roughly three times more than estimated previously and about 10% of all terrestrial fresh groundwater. With extensive active and inactive offshore oil pumping present in areas of large OFG reserves, they could be considered for temporary fresh groundwater exploration as part of a transition to sustainable water use in coastal areas on the long run.
Export citation and abstract BibTeX RIS

Original content from this work may be used under the terms of the Creative Commons Attribution 4.0 license. Any further distribution of this work must maintain attribution to the author(s) and the title of the work, journal citation and DOI.
1. Introduction
During recent decades, coastal communities settled along the global coastline have been subject to rising fresh water stress caused by both natural (Oude Essink et al 2010, Faneca Sànchez et al 2012, Rasmussen et al 2013, Yu et al 2016, Yang et al 2018) and anthropogenic (Syvitski et al 2009, Yamanaka et al 2011, Giosan et al 2014, van Camp et al 2014, Tessler et al 2015, Minderhoud et al 2017) causes. It might appear that the onshore and offshore zones of the global coast are geographically clearly defined as sea level stayed relatively constant (Lambeck et al 2014) throughout human recorded history. However, this coastal boundary is in reality rather dynamic when considering a larger geologic time scale. Before around 20 000 years ago, during the Last Glacial Maximum, global mean sea level was more than 120 m lower than current sea level. As a result, extensive continental shelf areas, nowadays submerged under shallow seas, were exposed to terrestrial conditions for tens of thousands of years and hosted an environment full of rivers and fresh water lakes (Head and Gibbard 2005). Under such circumstances, vast fresh groundwater volumes developed through precipitation (i.e. meteoric water), via increased fresh groundwater inflow from inland due to greater groundwater head gradient and through extensive fresh surface water systems covering the current continental shelf areas.
Following the first global overview of offshore fresh groundwater (OFG) (Post et al 2013), which is based on numerous case studies since 1979 (Hathaway et al 1979), several regional scale studies (Levi et al 2018, Morgan et al 2018, Gustafson et al 2019, Thomas et al 2019) have been conducted in recent years. It is important to mention that some other studies (Micallef et al 2020, 2021) define OFG as offshore freshened groundwater that also includes brackish levels of salinity; in our study OFG represents offshore fresh groundwater (<1 gl l−1 TDS (total dissolved solids)). It has been documented that OFG can be found tens or even hundreds of kilometers offshore while reaching depths of up to several kilometers. One of the most thoroughly studied and documented OFG occurrence is in the continental shelf off the New Jersey coast (Meisler et al 1984, Gustafson et al 2019, Thomas et al 2019). An extensive data acquisition of both geological and geophysical data was combined with numerical groundwater flow modelling (Gustafson et al 2019, Thomas et al 2019) to quantify the OFG volume stored in the porous unconsolidated sediments deposited at the continental shelf. OFG can also be stored in fractured karstic rocks as has been documented in e.g. Western and South-eastern Australia (Varma and Michael 2011, Morgan et al 2018). The abovementioned studies show that OFG is often preserved under low permeable geological layers that limit vertical seawater infiltration. These complex heterogeneous geological systems are found in both unconsolidated and karstic systems, stressing the need for a variety of geological information sources to successfully reconstruct regional offshore groundwater conditions. In our study, we combine global thickness estimates (Zamrsky et al 2018) and geological heterogeneity assessments (Zamrsky et al 2020) of unconsolidated sediment systems with variable-density groundwater flow and coupled salt transport modelling to estimate OFG volumes of the global coast (see section 2 and supporting information (SI) figure 1 (available online at stacks.iop.org/ERL/17/014021/mmedia)). Our study is solely focused on unconsolidated sediment systems, due to the lack of globally available data and the high variation in local characteristics of karstic systems (Chen et al 2017) (e.g. their complex conduit networks). Thus, when referring to global OFG volumes we refer to those in unconsolidated coastal aquifers only.
These regional geological scenarios, alongside other hydrogeological parameters (elevation, groundwater recharge estimation), are used for quantifying regional OFG volumes and their uncertainty by means of cross-sectional 2D variable-density groundwater flow and coupled salt transport models (called 'groundwater models' hereafter; SI figure 3). The temporal resolution of our numerical models covers the sea level fluctuation over one full glacial-interglacial cycle (Grant et al 2012) (approximately 125 000 years). This allows us to simulate past fresh water infiltration into the aquifers and aquitards that make up the present-day continental shelves during sea level low stands, and the subsequent salinization of fresh groundwater resources, or their preservation under less permeable clay deposits, during fast rising sea levels in the past 20 000 years (Lambeck et al 2014). Herein, we measure salinity as total dissolved solids (g l−1 TDS) with fresh groundwater threshold defined as 1 g l−1 TDS which is the upper limit considered acceptable to consumers, as defined by World Health Organization (2017). Further details are provided in the section 2 and the SI.
2. Methods
2.1. Regional representative coastal groundwater flow models
The global analysis approach in our study consists of dividing the global coast into regions with similar geological characteristics. This is based on the assumption that coastal zones act as sinks for sediments transported downstream by rivers. These unconsolidated sediments are deposited both onshore, forming so called coastal plains, and offshore, on top of the continental shelves. Splitting up the global coast is based on the COSCAT (Meybeck et al 2006) and MARCAT (Laruelle et al 2013) datasets that define the sediment sources and sinks respectively. Combining these two datasets allows us to define regions with similar geological characteristics and to implement the geological heterogeneity quantification and geological scenario algorithm to create regional groundwater representations in each individual region. We refer to previous research (Zamrsky et al 2020) for an elaborate description of this approach and provide a summary below.
In estimating OFG volumes, we divided the global coastline into 116 regions (COSCAT regions) linking inland sediment sources with coastal and offshore sediment sinks (Meybeck et al 2006, Laruelle et al 2013) to capture global geological differences. The division into 116 regions is based on the number of coastal COSCAT regions that contain coastal unconsolidated sediment aquifer-aquitard systems (Zamrsky et al 2020). Equidistant cross-sectional profiles perpendicular to the coastline are constructed in areas formed by unconsolidated sediments in each COSCAT region (SI figure 1(A)). These regions are outlined by using the Global Lithological Map (Hartmann and Moosdorf 2012) dataset describing surficial lithology on global scale. Various attribute values are extracted along each profile (i.e. topography (Weatherall et al 2015), bathymetry (Weatherall et al 2015), long term average actual evapotranspiration and precipitation (NTSG 2019), hydraulic conductivity (Gleeson et al 2014, Huscroft et al 2018), soil type (Montzka et al 2017) and thickness (Hengl et al 2014), water table depth (Fan et al 2013). Two coastal types are defined to take into account variations in topography and aquifer-aquitard system thickness. A 'delta' coastal type represents major deltaic systems (Tessler et al 2015) which likely have a wider (and thicker) coastal plain and continental shelf than the other profiles in the same region due to higher sediment input transported by rivers. Coastal types that are located in non-deltaic regions are named 'coastal stretch' and represent the vast majority of coastal profiles considered in this study.
An average representative profile (ARP) is built for each coastal type/COSCAT region combination which delineates its average geometrical conditions (topography and sediment depth) (SI figure 1(B)). To this end, all topography and bathymetry profiles are combined first to create the upper ARPs boundary. Next, after defining the current coastline position, an average thickness of the unconsolidated groundwater system is calculated and set as depth of the ARP at the coastline. In the following step, the continental shelf edge is identified as well as the foot of continental slope using a bathymetry slope algorithm (Wu et al 2017), which requires elevation as main input. When the foot of continental slope is successfully estimated, the bottom boundary of the offshore domain is defined as a line between the unconsolidated groundwater system depth at coastline and the foot of continental slope. If the continental slope is not found (e.g. in case of shallow bathymetry stretching far offshore), the offshore extent of the ARP is limited to 200 km and the bottom boundary is set to follow the average bathymetry slope of the offshore domain. The maximum offshore extent of 200 km is based on previous studies dealing with coastal and offshore groundwater models (Michael et al 2016, Zamrsky et al 2018, 2020).
A set of variable-density groundwater flow and coupled salt transport models (referred to as 'groundwater models' hereafter) is built for each ARP (coastal type/COSCAT region combination) (SI figures 1(c) and 3) in order to estimate groundwater salinity profiles. The SEAWAT code (Langevin and Guo 2006) is used to build the groundwater models. A total of 24 groundwater models with different geological setups (scenarios) are built for each ARP in order to capture unknown geological heterogeneity of the onshore and offshore sedimentary deposits (SI figure 2). This leads to a total number of 2784 groundwater models (116 ARP regions × 24 geological scenarios). The number of geological scenarios corresponds to the number of geological parameter combinations that outline regional geological heterogeneity (Zamrsky et al 2020 and SI text 1). In these geological scenarios, which are informed by regional sediment influx and size upstream from the coast and by preservation potential of coastal sediments, we vary the thickness and number of low permeable (aquitards) and highly permeable (aquifers) sediment layers and their shape in the offshore domain (Zamrsky et al 2020). The variation in number of aquitard and aquifer layer combinations is based on literature review of unconsolidated sediment aquifer-aquitard systems worldwide (Zamrsky et al 2020) and varies between two and five aquitard-aquifer layer combinations. The thickness of individual aquitard and aquifer layers is randomly assigned while the ratio of total aquifer and aquitard thickness matches an estimated regional sediment type fraction (called 'sand/mud' ratio in Zamrsky et al (2020)). Between the 24 geological scenarios, the number of aquitard-aquifer layers, the thicknesses of aquifers and aquitards, aquifer permeability, aquitard leakiness and the thickness of the offshore capping clay layer are varied randomly. This approach is based on previous research (Zamrsky et al 2018, 2020) and further technical information is provided in SI texts 1 and 2.
2.2. OFG volume estimation
The groundwater salinity profiles of each simulation are aggregated for all ARPs' 24 groundwater models based on the associated 24 geological scenarios, see SI figure 1(C). The mean groundwater salinity concentration value is then calculated for each groundwater model cell resulting in a mean groundwater salinity profile for each time step throughout the whole simulation duration. A threshold of 1 g l−1 TDS is chosen as a boundary between fresh and brackish water which is in line with previous studies (Post et al
2013). The OFG volumes estimated for all ARP groundwater models for the same COSCAT region are aggregated to calculate the total OFG volumes  for the COSCAT region, see equation (1):
where  stands for modelled offshore distance from the coastline (km),
  represents the average unconsolidated sediment thickness at the coastline (km),
  is the coastal length (km) of each coastal type within the COSCAT region and is then matched with the corresponding ARP's mean fresh groundwater fraction (
 ) to translate the cross-sectional estimates into a 3D volume (km3), with p a constant porosity of 0.3 (−). The constant porosity value is based on several previous studies (Groen et al
2000, Oude Essink 2001, van Camp et al
2014, Zamrsky et al
2020). The final OFG volumes per COSCAT region presented in this study are the sum of all ARPs located within the COSCAT region. The shallow OFG volume is estimated as all fresh groundwater located offshore and above 300 meters below sea level (m bsl) (see SI figure 9), chosen arbitrarily as a depth when economically viable groundwater pumping is feasible (i.e. the infrastructure costs are lower than the value of extracted fresh water). Equation (1) is repeated by using
) to translate the cross-sectional estimates into a 3D volume (km3), with p a constant porosity of 0.3 (−). The constant porosity value is based on several previous studies (Groen et al
2000, Oude Essink 2001, van Camp et al
2014, Zamrsky et al
2020). The final OFG volumes per COSCAT region presented in this study are the sum of all ARPs located within the COSCAT region. The shallow OFG volume is estimated as all fresh groundwater located offshore and above 300 meters below sea level (m bsl) (see SI figure 9), chosen arbitrarily as a depth when economically viable groundwater pumping is feasible (i.e. the infrastructure costs are lower than the value of extracted fresh water). Equation (1) is repeated by using  and
and  from the 24 groundwater models of each ARP to obtain uncertainty ranges per COSCAT region as well as for the global total OFG volume. The uncertainty of the latter is inflated because it assumes that geological uncertainties between COSCAT regions are fully correlated.
Potentially, brackish offshore groundwater could also be regarded as potential future water resource (Post et al 2013, Alsarayreh et al 2021, Arico et al 2021). That is why, additionally, the volumes of brackish offshore groundwater were also estimated using equation (1) above with OFG fraction representing volume of groundwater with concentrations lower than 10 TDS g l−1. The OFG is then subtracted from the calculated brackish offshore groundwater so only groundwater with concentrations between 1 and 10 TDS g l−1 is taken into account as brackish. These brackish offshore groundwater volumes are shown in SI figure 10.
We also estimated OFG renewal time scales by fresh groundwater inflow from the landwards direction through calculating a coastal fresh groundwater discharge flux by summing up the lateral seaward flux in cells with fresh groundwater concentration at the coastline location. Since our SEAWAT models are 2D representations of the coastal groundwater flow conditions, the resulting coastal fresh groundwater discharge flux values are multiplied by the coastal length and the average unconsolidated sediment thickness at the coastline for each COSCAT region to estimate the total coastal fresh groundwater discharge flux (km3 yr−1) for given coastal region. The average renewal time for a given COSCAT region is then calculated as OFG volume divided by the total coastal fresh groundwater discharge flux based on the definition of Margat and van der Gun (2013). This yields the estimated time it would take to fill the estimated OFG volume under current groundwater flow conditions. Groundwater systems with renewal times larger than 1000 years are considered non-renewable (Margat and van der Gun 2013).
2.3. Regional water demand and onshore groundwater extractions
To assess the value of the estimated volumes of OFG as a potential water source for coastal water use, we compared OFG volume with regional onshore water demand and groundwater extractions estimated with the global hydrological model PCR-GLOBWB (Sutanudjaja et al 2018). To calculate the regional coastal water demand and groundwater extractions, we created a buffer reaching 200 km inland for each COSCAT region. The resulting buffer zones were then overlaid over the 5 arcmin PCR-GLOBWB raster output files. In such way, we were able to extract the four components of the total sectoral water demand, namely domestic, livestock, industrial and irrigation water demands. To account for climate variation and dry/wet years we averaged over 30 year time-spans to create three water demand time slices, 2020 (2005–2035), 2050 (2035–2065) and 2075 (2060–2090). The future domestic, industry and livestock water demand estimations are based on the SSP2 scenario (Kriegler et al 2014). To take into account the effects of climate change on the irrigation water demand, we forced PCR-GLOBWB with the outputs of five global climate models from the RCP 6.0 climate change scenario of CMIP5, selected and bias-corrected under the ISIMIP program (Hempel et al 2013). The resulting future irrigation water demand is then calculated as median value of all the resulting global climate model runs. Future regional water demands together with estimated OFG volumes are shown in SI figure 6.
3. Results
Summing up all regional OFG volume estimates we approximate the global OFG volume to be 1.06 ± 0.2 × 10⁶ km3 (⩽1 g l−1 TDS). However, since our groundwater models have a constant porosity value (0.3), we assess the porosity value effect on estimated OFG volume by carrying out a groundwater sensitivity study with varying porosity value (0.1, 0.2, 0.4) in a randomly selected region. We can confirm that our groundwater models with the lowest porosity (0.1) show less than half OFG fractions than the case with porosity of 0.3 (see SI figure 4). This suggests that the estimated uncertainty about the global OFG volume may be underestimated due to constant porosity considered. With that in mind, our estimated global OFG volume amounts to about 5%–10% of total fresh groundwater worldwide (estimated to be between 10.5 × 10⁶ km3 (Gleeson et al 2016) and 21.8 × 10⁶ km3 (Ferguson et al 2021)) and roughly 3% of total global fresh water (Shiklomanov 1998). The OFG volumes are most likely non-renewable as they were deposited during glacial periods when sea levels were substantially lower compared to current sea level. Indeed, when we calculate renewal times by the ratio of OFG volume and total coastal fresh groundwater discharge from the groundwater models (SI figure 11), we see that renewal rates exceed 1000 years for most of the coastal regions, rendering the OFG volumes effectively non-renewable.
The estimated OFG volumes vary considerably between the world's coastal regions (figure 1). Regions such as North-east USA, North Australia and South-east Asia accommodate substantial OFG volumes. However, due to unknown heterogeneity in geology and other hydrological factors (e.g. groundwater recharge, influence of rivers), the uncertainties in OFG volumes can be considerable for certain regions, e.g. the coasts around Arabian Peninsula, the Gulf Coast and the North Sea basin (SI figure 5). To put these OFG volume estimates into perspective, we compared them with extracted present day total water demand per year from simulations with a global hydrology and water resources model (Sutanudjaja et al 2018) for a 200 km inland buffer in each coastal region. South and South-east Asia stand out as regions with high current water demand and large OFG volumes, which calls for further investigations into more accurate quantification and potential exploration of these volumes. Water demand is projected to increase steadily during 21st century due to population growth and climate change (Prudhomme et al 2014, Wada and Bierkens 2014), and OFG could prove a vital additional fresh water source in regions such as West Africa and East South America as well (SI figure 6).
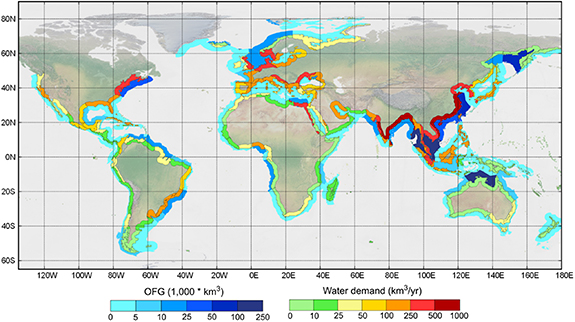
Figure 1. Estimated regional OFG volumes (in 1000 km3) plotted with regional coastal current water demand (km3 yr−1) based on the global hydrological and water resources model PCR-GLOBWB. Note that gross water demand is plotted, which includes losses and return flows. South-east and East Asia stands out as regions where OFG could provide an additional source of fresh water and therefore has most potential for OFG exploration. Reproduced from Sutanudjaja et al (2018) CC BY 4.0.
Download figure:
Standard image High-resolution imageWe compared our OFG estimates with several regional scale studies (Oteri 1988, Groen et al 2000, Person et al 2003, 2012, Varma and Michael 2011, Zhang et al 2011, Bakari et al 2012, Amir et al 2013, Geldern et al 2013, Pauw et al 2014, Jiao et al 2015, Larsen et al 2017, Haroon et al 2018, Paleologos et al 2018, Engelen et al 2019, Gustafson et al 2019, Knight et al 2019, Thomas et al 2019, Bertoni et al 2020) and a set of offshore observation wells (Micallef 2020) limited to areas with unconsolidated sediments. Unfortunately, the majority of these regional scale studies do not provide volume estimates. Therefore, OFG's distance from coastline and depth below sea level were used as proxies. Several studies only provide one of the two proxies, while few only show OFG observations without measurements (see figure 2(A)). Fifteen regional studies covering all continents are taken into account, most of which contain both depth and distance from coast information. Our estimates are in the same order of magnitude as the observed values (figure 2(B)), with only few areas showing large discrepancies. This mostly concerns estimated thickness of OFG where our study shows thinner OFG bodies offshore as compared to literature sources. The offshore observation well dataset (Micallef 2020) gives a point measurement at a certain offshore distance and also the observed top and bottom OFG elevation. The OFG extent is then extracted from the corresponding groundwater model of the same region at the same offshore distance as each observation well (figure 2(C)). While in the same order of magnitude, in several cases we observe a rather large difference (hundreds up to few thousands of meters) in estimated and observed OFG depth (wells ID 16, 20, 22, 23, 24, 27, 34). However, for 80% of the well locations our estimated OFG depth extents overlap the observed OFG depth ranges.

Figure 2. (A) OFG occurrence in unconsolidated sediments based on regional scale literature studies, see SI table 1 for more information. (B) Due to lack of OFG volume estimates in these regional studies, we selected two criteria (distance from coast (km) and depth below sea level (km)) to assess the accuracy of our estimates. (C) Additional validation comparing estimated OFG with observation wells, the ID numbers do not match with (A) nor (B), only locations in unconsolidated sediments were selected and therefore the limited number of observation wells shown (see SI table 2). Only top OFG elevation is provided for some observation wells; in those cases, only a point is plotted (e.g. observation wells 28–34). Reproduced from Micallef (2020) CC BY 4.0.
Download figure:
Standard image High-resolution image4. Discussion and conclusion
Our global OFG volume estimate is in line with a previous global OFG assessment (Post et al 2013), which considers a more generous fresh water threshold (<10 g l−1 TDS) and estimated global OFG volume along passive continental margins to be 0.3 × 10⁶ km3. However, this value may vary up to factor of two (Post et al 2013) due to uncertainty about porosity values ranging between 0.03–0.4, and explains our higher estimate which is based on a constant porosity of 0.3. Recent study by Micallef et al (2021) provides an estimate of offshore freshened groundwater with higher salinity (<10 g l−1 TDS) than considered in our study (<1 g l−1 TDS). Our modelling results show a total volume of groundwater with salinity below 10 g l−1 TDS to be 1.24 ± 0.19 × 10⁶ km3, which is approximately 6 times higher than the estimate by Micallef et al (2021) (0.2 × 10⁶ km3). However, Micallef et al (2021) note that the actual volume of offshore freshened groundwater (and therefore also the OFG volume) is very likely higher than their estimate due to their methodology only considering offshore groundwater emplaced by meteoric recharge and their measurement database often does not provide the full extent of the offshore freshened groundwater bodies. This suggests that our study possibly overestimates the OFG volume along the global coastline but nevertheless provides an estimate in the same order of magnitude as previous global studies (based mostly on qualitative analyses). This can be partly explained by simplifications made during our groundwater modelling study (24 geological scenarios per coastal region) and subsequent OFG volume calculation for each coastal region, where we assume a single cross-sectional groundwater salinity distribution over lengthy coastline stretches. Comparing regional cross-sectional OFG schematizations with our groundwater model results shows a relatively good match in terms of OFG extent and depth (figure 2(B)), but we can also observe some discrepancies presumably due to the large-scale nature of our analysis. As expected, this scale discrepancy is more pronounced when comparing top and bottom of OFG estimates with local observation wells (figure 2(C)). Furthermore, since in our study we only consider unconsolidated sediment systems, older unconsolidated sediment aquifers overlayed by rock formations (e.g. sandstone, limestone) are not accounted for in our approach. This can lead to missing OFG reserves in the deeper formations by our groundwater models as is the case for the Gippsland basin in South Australia (Varma and Michael 2011) (see figure 2(C), observation well 27). Other reasons for larger discrepancies can be caused by the scale difference between local point measurements and our average OFG estimates for regions spanning over hundreds (up to thousands) of kilometers of coastline. It is also possible that the individual observation well measurements were only conducted at a certain depth and do not provide the full extent of the actual range of OFG extent at a given location. Despite this, a satisfactory match is observed in shallower unconsolidated sediment depths (up to 500 m bsl.) which suggests that our approach can be used to estimate regional OFG volumes.
While our offshore fresh (or freshened) groundwater volume estimates are accordance with previous studies, there are a number of limitations and uncertainties that have to be addressed. First, the extent of the cross-sectional profiles is limited to up to 200 km offshore. The majority of the offshore freshened groundwater occurrences have been reported to lie within 55 km distance from the current coastline but the maximum distance has been reported to be 720 km (Micallef et al 2021). This means that in some areas our cross-sectional profiles possibly do not capture the full extent of OFG bodies. Our OFG volume calculations use a regional coastal length neglecting local and regional curvature. This simplification can lead to OFG volume overestimates as coastline curvatures (e.g. bay and lagoon areas) are not taken into account leading to artificially stretching the coastal length in our calculation. The constant porosity of 0.3 that is used in the groundwater models contributes to underestimating the uncertainty in the global OFG volume. We can deduce that from the sensitivity study with varying porosity values (see SI figure 4 and SI table 3) that shows non-linear decline in estimated OFG volume with lower porosity values. On average, the groundwater models with the lowest porosity value (0.1) show a lower estimated OFG by 11%. This means that the estimated global OFG volume would be lower by 0.11 × 10⁶ km3 than estimated by groundwater models with the constant porosity value equal to 0.3. The differences in estimated mean fresh groundwater fraction between the simulations with low porosity (0.1) and the constant porosity value considered in this study (0.3) can vary from 0.4% up to 34.5% (see SI table 3). Therefore, it is important to take this into account when conducting regional scale studies to investigate the potential impact of varying porosity on the OFG conditions in a given region.
Comparing the estimated OFG volume with current regional water demand highlights areas where OFG exploration could provide a sustainable fresh water source over long periods of time (up to millennia). South-east Asia, West Africa and most of Australia show the highest potential for OFG exploration (figures 3 and 4; SI figures 7 and 8). Exploring OFG as potential fresh water source could be especially interesting in densely populated and intensely farmed deltaic areas (SI table 4). However, more detailed regional hydrogeological and economic analyses are necessary to identify the exact potential the OFG brings to regional usage as source of fresh water. OFG volumes found in several regions could provide multiple centuries (even up to two millennia) worth of fresh groundwater under current and under future water demand rates. However, salinization of inland aquifers might occur when extracting these OFG volumes and this process should be further studied before extracting OFG. This threat is examined by previous studies showing that extracting OFG as an additional source of fresh water for coastal communities is deemed to have potential impacts (Knight et al 2018) on environmental and human conditions while its feasibility should be evaluated for each site (Haakon and Fridtjof 2012).
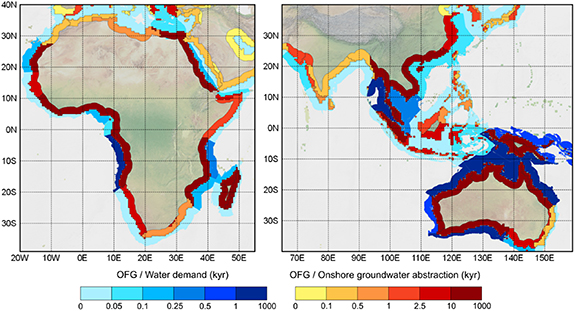
Figure 3. Ratio of estimated OFG volumes for Africa, South-east Asia and Australia with current regional water demand and onshore groundwater extraction obtained from the global hydrology and water resources model PCR-GLOBWB showing the time scale (order of magnitude in kyr) to which OFG could contribute to the fresh water demand. A global map is provided in the SI figure 7. Reproduced from Sutanudjaja et al (2018) CC BY 4.0.
Download figure:
Standard image High-resolution image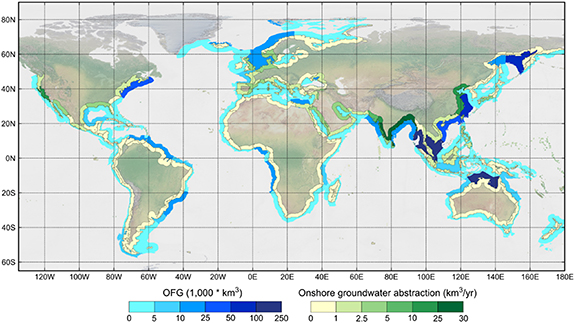
Figure 4. Estimated OFG volumes plotted with onshore groundwater extraction for coastal regions worldwide (km3 yr−1 based on PCR-GLOBWB. Reproduced from Sutanudjaja et al (2018) CC BY 4.0.
Download figure:
Standard image High-resolution image
We also evaluated total OFG volume at shallow depths (higher than 300 m below average sea level; SI figure 9). We estimate the total volume of shallow OFG to be approximately 30% of total OFG volume (∼0.31 × 10⁶ km3), showing still substantial shallow OFG volumes in e.g. South and South-east Asia. The shallow depths are of interest because pumping from deeper formations is more expensive and has a higher potential to disturb onshore groundwater heads (Yu and Michael 2019) in regions where onshore and offshore aquifer layers are interconnected. The connection of the onshore and offshore aquifers is shown to lead to larger OFG volumes via preferential pathways in heterogeneous geological systems as compared to homogeneous systems (Michael et al 2016, Knight et al 2018). Our geological scenarios take into account geological heterogeneity and simulate onshore and offshore interconnectivity (see SI figure 2). However, more local and regional geological information (e.g. boreholes, faults, geological models) is necessary to improve regional scale simulation of OFG.
To conclude, our analysis shows that there are potentially large OFG volumes of up to 10% of total fresh terrestrial groundwater deposited in unconsolidated sediment systems in many regions worldwide. Exploring these offshore resources could provide additional fresh water sources for agricultural, industrial or domestic use. In South-east and East Asia, West Africa and several regions in South America. OFG could prove to be a vital water stress mitigating factor, especially in regions facing near future increases in water demand due to population growth and climate change throughout the 21st century. Further research should investigate the effects of offshore pumping on groundwater levels inland as those could be interlinked. The OFG extraction can potentially lead to onshore groundwater level drops even in shallower aquifers (Yu and Michael 2019) which could have negative impact environmental conditions and societal fresh water needs. Moreover, searching for new hydrogeological data sources, implementing these in local to regional scale hydrogeological modelling studies would help to better understand the extent and behaviour of these offshore fresh (and brackish) groundwater reserves.
Acknowledgments
This study's calculations were performed on the Dutch national supercomputer Cartesius with the support of SURF. This research was funded by the Netherlands Organization for Scientific Research (NWO) under the STW project 'Water Nexus: Resource Analysis and Regional Water Management' (No. 14298).
Data availability statement
The data that support the findings of this study are openly available at the following URL/DOI: 10.5281/zenodo.3937204. The final groundwater salinity estimations for each COSCAT region (as 2D profiles) are provided there as well as shapefiles containing offshore fresh (and brackish) groundwater volumes together with inland water demand and groundwater extraction rates.
Author contributions
D Z, M F P B and G H P O E designed the study and wrote the manuscript. D Z performed the model calculations and data analysis. E H S and L P H (R) v B provided coastal water demand data and helped improve the manuscript.