

Abstract
Mosquito-borne diseases (MBD) threaten over 80% of the world's population, and are increasing in intensity and shifting in geographical range with land use and climate change. Mitigation hinges on understanding disease-specific risk profiles, but current risk maps are severely limited in spatial resolution. One important determinant of MBD risk is temperature, and though the relationships between temperature and risk have been extensively studied, maps are often created using sparse data that fail to capture microclimatic conditions. Here, we leverage high resolution land surface temperature (LST) measurements, in conjunction with established relationships between air temperature and MBD risk factors like mosquito biting rate and transmission probability, to produce fine resolution (70 m) maps of MBD risk components. We focus our case study on West Nile virus (WNV) in the San Joaquin Valley of California, where temperatures vary widely across the day and the diverse agricultural/urban landscape. We first use field measurements to establish a relationship between LST and air temperature, and apply it to Ecosystem Spaceborne Thermal Radiometer Experiment data (2018–2020) in peak WNV transmission months (June–September). We then use the previously derived equations to estimate spatially explicit mosquito biting and WNV transmission rates. We use these maps to uncover significant differences in risk across land cover types, and identify the times of day which contribute to high risk for different land covers. Additionally, we evaluate the value of high resolution spatial and temporal data in avoiding biased risk estimates due to Jensen's inequality, and find that using aggregate data leads to significant biases of up to 40.5% in the possible range of risk values. Through this analysis, we show that the synergy between novel remote sensing technology and fundamental principles of disease ecology can unlock new insights into the spatio-temporal dynamics of MBDs.
Export citation and abstract BibTeX RIS
1. Introduction
Mosquito-borne diseases (MBDs) represent a substantial portion of the global burden of disease, and new and existing pathogens are intensifying in prevalence and spreading to new geographic locations under environmental change (Paz 2015, Franklinos et al 2019, Ebi et al 2021). Temperature is one of the key environmental drivers of MBD risk (DeFelice et al 2017, 2018, Mordecai et al 2019, Shocket et al 2020), and climate change-associated shifts in temperature across the globe are likely to strongly influence the future distribution of disease transmission risk for myriad MBDs (Ryan et al 2015, 2019). Understanding how the risk of MBD might respond to such environmental change in space and time is therefore critical in order to better prepare for and mitigate the effects of such diseases.
Changes in MBD distribution and transmission risk are often predicted using temperature-based mechanistic models (Tjaden et al 2018, Franklinos et al 2019). Such models are derived from controlled laboratory studies on the effect of temperature on traits related to the biology of both mosquitoes and the pathogens they transmit, including mosquito survival, fecundity, larval development, as well as mosquito biting and pathogen transmission rates (Reisen et al 2006, Mordecai et al 2019, Shocket et al 2020). These relationships are used in conjunction with temperature data to elucidate the distribution of risk-relevant traits over the landscape. These can then be integrated to make spatially explicit calculations of the basic reproductive number (R0), or the expected number of new cases generated from one case in a fully susceptible population (Mordecai et al 2019). Though mechanistic models have provided valuable information relevant to MBD risk across the globe, the relatively coarse resolution temperature data on which earlier studies have relied provide limited insight into the local distribution of risk over fine spatial scales. Additionally, spatially coarse temperature data may lead to biased risk estimates, since the deeply nonlinear temperature–trait relationships cause average estimates calculated from variable air temperatures to be different from estimates obtained simply by applying the equations to average air temperature, as predicted by Jensen's inequality (Ruel and Ayres 1999, Paaijmans et al 2010, Lambrechts et al 2011, Bernhardt et al 2018). In the absence of high resolution temperature data, it is possible to downscale climate data and use it for MBD risk mapping (Yang et al 2017, Wimberly et al 2020). However, downscaling requires new inputs, such as discrete land cover maps, which limits the ability to decipher potentially important variation within a single input class.
At the local level, public health agencies and decision makers rely on risk mapping to draw inferences on where to target mosquito control and educational programs, as well as to understand and predict geographical variations in disease intensity. Localized understanding of risk often relies on programs that monitor the abundance of mosquito larvae and adults, as well as pathogen prevalence in mosquitoes, humans, and other hosts (Newsom 2020b). This results in a patchy understanding of where and when elevated risk is expected (Thiemann et al 2012), which is sometimes combined with maps of related biotic and abiotic factors that influence risk, such as temperature, to extrapolate to the rest of the landscape (Chuang et al 2012, Hess et al 2018).
However, extrapolating from spatially sparse sampling points is unable to resolve much of the valuable information that mechanistic models provide. For example, temperature is known to have a nonlinear relationship with epidemiologically relevant traits, and sparse or noisy samples are often unable to uncover the true nature of such relationships (Diuk-Wasser et al 2006, Coroian et al 2020). Additionally, the contribution of different epidemiological traits that make up disease risk, like biting rate or pathogen transmission rates, cannot be disentangled using data on infection rates or mosquito prevalence alone. The absence of underlying mechanisms can be a barrier to designing effective interventions. Having access to fine resolution estimates on MBD risk would be valuable for resolving heterogeneity, predicting small scale changes in risk under climate and land cover change, and better targeting mitigation efforts to areas of highest current or future risk. We aim to improve the resolution of MBD risk maps using mechanistic, laboratory based understandings of risk-relevant traits, in combination with high resolution, remotely sensed temperature data.
Our goal is to investigate the potential to generate fine scale spatio-temporal risk maps for temperature-dependent aspects of MBD epidemiology. To do so, we use 70 m resolution land surface temperature (LST) measurements from the Ecosystem Spaceborne Thermal Radiometer Experiment (ECOSTRESS) in conjunction with laboratory derived temperature effects on mosquito life cycle and disease transmission to generate maps of risk calculated from temperature across the diurnal cycle. To investigate this method, we conduct a case study for two traits related to West Nile virus (WNV) risk in California's San Joaquin Valley (SJV): mosquito biting rates and WNV transmission rates. WNV is the most common MBD in the SJV (Newsom 2020a), and the diverse, irrigated croplands and intermixed (sub)urban areas result in fine-scale heterogeneity in temperature that we hypothesize translates into yet-to-be evaluated heterogeneity in WNV risk. Since air temperature, rather than LST, is taken as the input variable in current mechanistic models, we first model air temperature from the LST measurements, and then use laboratory-derived trait equations to estimate and analyse variations in biting and transmission rates over time and space. We seek to answer the following:
- (a)How do mosquito biting rate and WNV transmission probability vary across crop types and land covers at high spatial resolution?
- (b)Do fine spatial and temporal temperature data significantly change the expected biting rates and transmission probabilities as compared to average temperatures?
2. Materials and methods
2.1. Methods
This study can be divided into three efforts. First, because the traits we investigate are related to air temperature and not LST, we use ground based air temperature monitors to model air temperature from the ECOSTRESS LST images. Second, we use this relationship to create air temperature maps that allow us to infer mosquito biting rates and WNV transmission probabilities. We then use these fine resolution maps to investigate variations in these data over time and space. The data and models that support the findings of this study are openly available at the following URL: https://github.com/anna-boser/2021-ERL-WNV-Risk/tree/oct_26_2021.
2.1.1. West Nile virus study system
In order to explore the potential of ECOSTRESS for fine resolution mechanistic MBD risk mapping, we conduct a case study on WNV in the SJV of California. In California, WNV is the most prevalent MBD, killing 309 people and infecting 7024 since its introduction in 2003 (Newsom 2020b). This virus is spread by mosquitoes in the genus Culex between bird hosts, which have also experienced substantial WNV-related mortality (LaDeau et al 2007), as well as to dead-end hosts such as humans. The SJV suffers from especially high WNV rates, particularly in the summer months from June through September (Barker et al 2010, Snyder et al 2020), and thus we conduct our analysis during this peak transmission season. We specifically seek to map the biting rates and WNV transmission probabilities of Culex tarsalis, the major WNV vector in the SJV (Goddard et al 2002, Thiemann et al 2012). We choose these traits as they are not possible to observe directly in the field despite their clear relation to WNV risk.
2.2. Study area
California's (SJV; figure 1(a)) is one of the most productive agricultural landscapes on earth, due to its fertile soils, warm and sunny climate, and an intricate irrigation network (Newsom 2020a). However, many of the environmental factors that drive agricultural productivity also support high WNV disease prevalence (Reisen et al 2009). The site of this analysis (figure 1(b)) is chosen to include the Bakersfield urban center as well as lower density housing and a broad diversity of surrounding agricultural fields. Crop types include both row crops and orchards, including both specialty and commodity crops, as well as uncultivated fields.
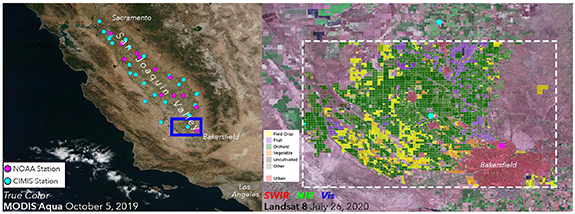
Figure 1. Distribution of weather stations and diversity of agriculture in the SJV, CA. (a) CIMIS (26 cyan dots) and NOAA (12 pink dots) weather stations spread across the entire 25 000 km2 valley (Riley and Galloway 1999) provide an hourly time series of air temperature with which to calibrate the radiometric to air temperature transfer function (figure S2). (b) The study area (3878 km2) for detailed analysis (blue rectangle (a)) contains a diverse mixture of crops including row crops (fruit, vegetable, and field crops), orchards, uncultivated land, and most of the city of Bakersfield.
Download figure:
Standard image High-resolution image2.3. Data
2.3.1. ECOSTRESS LST
The ECOSTRESS is a NASA multichannel thermal radiometer able to collect highly accurate LST measurements at roughly 70 m resolution (Fisher et al 2020). Aboard the International Space Station, the data are collected in a precessing (non sun-synchronous) orbit, resulting in variable local time for each overpass. We therefore resolve variations in LST across space as well as across the diurnal cycle over our study period.
All available LST images were retrieved for our study area in the period June–September, 2018–2020 from the APPEEARS data portal (https://lpdaacsvc.cr.usgs.gov/appeears/). Images were visually inspected for quality and a final 65 cloud-free images were included in the study. These images span the entire diurnal cycle and different months included in the study (figure S1 available online at stacks.iop.org/ERL/16/124014/mmedia). LST to air temperature modeling was also performed on single pixel time series (only best quality QA flags included) from the locations of the air temperature monitoring sites.
2.3.2. Culex tarsalis biting rate and WNV transmission probability
We employ the mechanistic relationships between temperature and biting rates and WNV transmission probabilities from Shocket et al (2020) (figure 2). Though more temperature-dependent relationships for many mosquito species and various risk relevant traits are known (Mordecai et al 2019), we chose to focus on Culex tarsalis, the main vector in the SJV, and biting and transmission rates since these cannot be retrieved any other way. In the context of mosquito and pathogen trait-based mechanistic R0 models, biting rate is measured as the inverse of the gonotrophic (or oviposition) cycle duration, in days (Shocket et al 2020). One complete blood meal is taken per mosquito, per gonotrophic cycle, so this parameter represents the frequency of host blood meals taken by egg laying, adult female mosquitoes. Transmission probability is measured as the proportion of mosquitoes that take an infectious blood meal from a host that then become infectious (with virus present in the salivary glands). Both of these rates are key determinants of pathogen transmission in MBD systems and are sensitive to environmental temperature (Mordecai et al 2019, Shocket et al 2020).
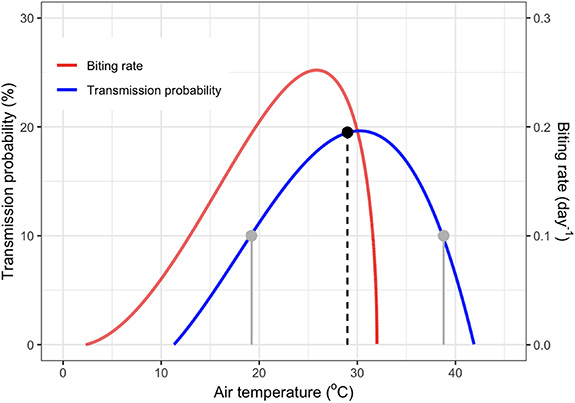
Figure 2. Culex tarsalis biting and WNV transmission rates. Transmission probability (the proportion of mosquitoes that take an infectious blood meal that then become infectious) and biting rate (the inverse of the gonotrophic cycle length in days) as a function of temperature as described in Shocket et al (2020). The vertical lines represent an example of Jensen's inequality: the average transmission probability of the two temperature observations (grey) is about 10% whereas the transmission probability of their average is far greater (black; almost 20%).
Download figure:
Standard image High-resolution imageWe note, in particular, the highly nonlinear relationship between temperature and biting and transmission rates; a property ubiquitous among all temperature-dependent traits described in Shocket et al (2020) and Mordecai et al (2019). This nonlinearity makes it difficult to find similar relationships in the field, where fewer or noisy data may require simpler, often linear models. Additionally, strongly nonlinear relationships such as this require high resolution data, since applying such relationships on aggregated, averaged data may lead to significant bias (figure 2). This phenomenon, called Jensen's inequality, occurs because if the average air temperature is near the maximum of the relationship, risk will be overestimated, while if the average is further from the maximum, where the function is concave, risk will be underestimated (Mordecai et al 2019). Applying deeply non-linear relationships to coarse data (e.g. using daily average temperatures that do not account for diurnal temperature variation) can thus lead to inaccurate results (Ruel and Ayres 1999, Paaijmans et al 2010, Lambrechts et al 2011, Bernhardt et al 2018).
2.3.3. Air temperature
We calibrate the relationship between LST and air temperature using hourly air temperature data from the California Irrigation Management Information System (CIMIS) and from the National Oceanic and Atmospheric Administration (NOAA). Air temperature time series were downloaded for all stations in the SJV from: https://cimis.water.ca.gov/ (26 stations obtained) and www.ncdc.noaa.gov/cdo-web/datatools/lcd (12 stations obtained). CIMIS instruments and site placement are calibrated across the network, with standardized locations chosen in irrigated grass fields. NOAA stations tend to be located in urban areas, often near airports; microenvironments that fundamentally differ from those surrounding CIMIS stations due to the prevalence of impervious surface and dry grass/non-photosynthetic vegetation (PV) land cover types.
2.3.4. Fractional vegetation from Landsat 8
PV cover can influence the LST to air temperature relationship (Gallo et al 2011). We investigate this effect in our study by extracting and matching cloud-free 30 m Landsat 8 VSWIR observations at the geographic coordinates of the CIMIS air temperature monitors that are closest in time to each included ECOSTRESS pixel. We estimate fractional PV cover from Landsat 8 data using linear spectral mixture analysis (Smith et al 1990, Elmore et al 2000, Small and Lu 2006), applying a globally-calibrated three endmember model implementing a unit sum constraint with weight 1 (Sousa and Small 2017).
2.3.5. Urban and agricultural boundaries
In order to evaluate the ability of ECOSTRESS to capture variability in biting and transmission rates over a landscape, we use two land cover shapefiles to determine the extent of urban areas and agricultural areas. We take advantage of the annually permitted crop boundaries from the Kern County Department of Agriculture and Measurement Standards (www.kernag.com/gis/gis-data.asp). We group the crop types as vegetable, fruit, orchard, field crop, and uncultivated, and ensure that each ECOSTRESS derived WNV temperature suitability map is overlaid with the appropriate year's shapefile. In order to identify the extent of urban areas in our study site, we rely on the 2016 Statewide Crop Mapping GIS Shapefiles from the California Department of Water Resources (https://data.cnra.ca.gov/dataset/statewide-crop-mapping).
2.4. Air temperature regression
In order to create the high resolution air temperature maps necessary to calculate biting and transmission rate, we first model air temperature from the ECOSTRESS LST measurements. Our approach follows from previous work modelling air temperature from moderate resolution imaging spectroradiometer LST measurements (Mostovoy et al 2005, Vancutsem et al 2010, Benali et al 2012). In order to train our model, we rely on hourly air temperature measurements from ground based stations across the SJV (figure 1(a)). High-confidence ECOSTRESS LST pixels were matched to air temperature measurements located within the pixel and collected within 30 min of the image, resulting in a sample size of 3248.
We evaluate polynomial models of up to three degrees, and additionally test the significance of vegetative fraction which can also have an effect on the LST–air temperature relationship (Gallo et al 2011). We select the polynomial model of best fit according to the Akaike Information Criterion (AIC), the adjusted R2 value, and the Breusch–Pagan statistic for homoscedasticity (table S1). Although the linear and quadratic models boast higher AIC values, the cubic model results in a higher adjusted R2 and Breusch–Pagan statistic. Additionally, vegetative fraction shows little effect (figure S3). We therefore select a cubic polynomial model in order to estimate air temperature for our analysis (figure S1). This results in an adjusted R2 of 0.86 and a standard error of 2.804.
2.5. Application to West Nile virus epidemiology
The modeled 70 m air temperature maps allow us to gain high resolution understandings of risk over our study area (figure 1(b)). Using such maps, we are able to observe how estimated risk changes over different land covers and how the impact of temperature varies over time of day. To do so, we model the biting rate and transmission rate over each pixel and each image.
2.5.1. Spatial variability
Because biting rate and transmission rate do not change instantaneously, we average air temperature, biting rates, and transmission probabilities across time in order to capture integrated risk for our study period at 70 m resolution. We resample temperatures to the grid of one image to accommodate orbit-to-orbit discrepancies in ECOSTRESS geolocation and orthorectification. We then evaluate the differences in risk over different land cover types: agricultural versus urban, as well as different crop types and test the significance of such differences using t-tests and ANOVA tests. We do not include pixels which changed land cover type from 2018 to 2020 in this analysis.
2.5.2. Jensen's inequality
We additionally test the significance of using high resolution spatial and temporal data which captures air temperature variability over our study region in avoiding biases due to Jensen's inequality. To test the significance of high spatial resolution, we averaged air temperature, biting rate, and transmission probability over the entire study region for each of the 65 frames included in the study. We then use a paired t-test to compare the average biting and transmission rates over all these frames to the biting and transmission rates calculated from the 65 averaged air temperatures. Similarly, to test the significance of high temporal resolution which captures diurnal temperature variability, we calculated the temporally averaged air temperature, biting rate, and transmission probability of each pixel over our study area. We then compared the average biting and transmission rates to biting and transmission rates calculated with the average temperatures by pixel with a paired t-test.
3. Results
To capture variations in mosquito biting rates and WNV transmission probability over time and space, we use ECOSTRESS LST to model 65 maps at 70 m resolution of air temperature at varying times of day in the greater Bakersfield area (figure 3(a)). These maps allow us to resolve diurnal and spatial variations in air temperature which, in turn, resolves variations in WNV risk over the landscape at a 70 m resolution (figures 3(b) and (c)).

Figure 3. Air temperature and WNV temperature suitability maps. (a) A subsample of air temperature maps. Images taken at times most representative of dawn, day, dusk and night were chosen among the 2019 measurements to create the shown temperature suitability maps for WNV (taken at 6:49 am on 12 July 2019, 2:15 pm on 4 August 2019, 8:08 pm on 20 July 2019, and 3:41 am, 2 July 2019) Images are then used to estimate (b) biting rate and (c) transmission probability throughout the study region by averaging across the resulting diurnal variations in biting and transmission rate. Agricultural areas have lower air temperature and transmission probability but higher biting rate as compared to urban areas (p <.05).
Download figure:
Standard image High-resolution imageAcross the 65 images, urban areas had higher air temperatures than agricultural areas by an average of 2.0 °C (p < 0.05 for a t-test pairing agricultural and urban area means by image). While this translated to a higher transmission probability overall in urban areas (p < 0.05), the biting rate was on average lower for urban areas (p < 0.05). These relative differences in risk do not, however, result from uniform differences in estimated risk throughout the day. Since agricultural areas are cooler than urban areas throughout the day, they tend to contribute lower biting and transmission rate values as compared to urban areas at night when the relationship between temperature and risk is positive. However, during the day this relationship reverses and agricultural areas have higher rate values (figure 4).
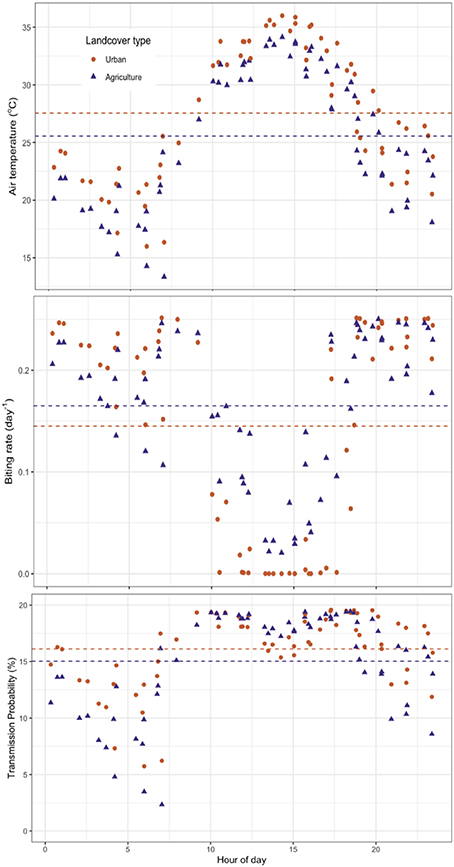
Figure 4. Diurnal cycles of air temperature, and resulting biting and transmission rates. (a) Air temperature modeled from ECOSTRESS LST resolves the diurnal temperature cycle over urban and agricultural areas in and around Bakersfield, CA. These translate to distinct diurnal patterns of estimated temperature-dependent WNV risk, as demonstrated by (b) biting rates and (c) transmission probabilities. Biting rate and transmission probability do not vary instantaneously throughout the day, but these instantaneous measurements serve to calculate unbiased temporal averages representative of risk over different land covers in the study area (dashed lines).
Download figure:
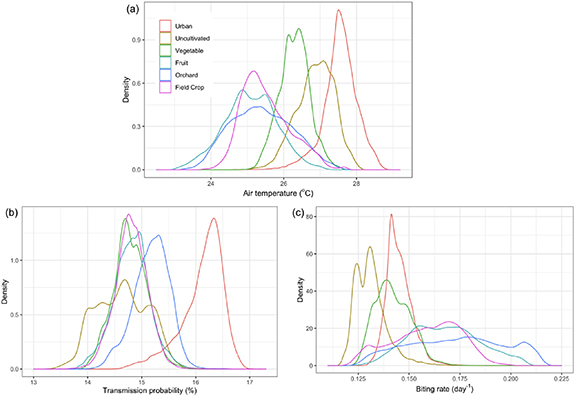
Standard image High-resolution imageAt an even finer scale, we are able to resolve marked differences in the distribution of air temperatures over different crop types. These statistically significant differences in air temperature (ANOVA p <.05) also manifest in differences in risk (ANOVA p <.05) (figure 5). Most notably, uncultivated areas have very high temperatures as compared to other agricultural areas, which correspond to low biting and transmission rates. Vegetables have a similar distribution, but with slightly lower temperatures. This is likely caused by spatially mixing within the 70 m ECOSTRESS pixels among cool, transpiring plant canopies; cool, evaporating watered soil; and hot, dry unwatered soil exposed in gaps between rows, which could generate temperature profiles similar to those of uncultivated lands. Fruit, orchards, and field crops all have lower temperatures, which translate to elevated biting rates.
Figure 5. Air temperature and WNV transmission probability distributions by land cover type. (a) Average air temperatures vary significantly over crop types (p < 0.05) and these correspond to different distributions in (b) transmission probability (p < 0.05) and (c) biting rate (p < 0.05) obtained by applying temperature–transmission relationships to air temperature values.
Download figure:
Standard image High-resolution image
One additional advantage of resolving fine diurnal and spatial patterns with ECOSTRESS is relevant to even larger scale and less localized applications of mechanistic temperature-based disease risk models. Because the temperature–trait relationships are so deeply nonlinear, they are susceptible to be biased by Jensen's inequality when using averaged inputs (Danforth et al 2016). We first tested the effect of high resolution spatial data by comparing the average risk obtained over an image to the average risk obtained by applying the temperature–risk relationships to the average temperature over the image. We similarly test the effect of high resolution temporal data by investigating the effect of using temporally averaged air temperatures at the pixel level. Finally, we test the effect of calculating risk simply from an average air temperature over the entire study area and period. We find statistically significant biases arise for both biting rate and transmission probability when using aggregate air temperature data over time, space, and both (table 1). These biases are mostly positive, resulting from air temperatures which cluster around the convex portions of the temperature–risk equations (figure 2). Temporal resolution sees a markedly larger effect than spatial resolution, due to the wider spread in values across the day at a single location as compared to across space at a given time (figures 3–5). Only averaging over space led to a negative bias for biting rates. This is due to large negative biases occurring over daytime hours where the average air temperatures are so high the biting rate drops to zero, reflecting a concave relationship between air temperature and biting rates (figure 2). The air temperature variations in time and space observed by ECOSTRESS over our study area therefore significantly reduced the bias that would have been observed had a coarser dataset been used.
Table 1. Using aggregate data results in statistically significant biases when calculating risk. The effect of 70 m spatial resolution and temporal resolution that resolves diurnal variations are evaluated by comparing the biting and transmission rates from the original data to values obtained from air temperature averages that hold space, time, or both constant. The stars represent statistical significance (p < 0.05), and the percentages are the percent of possible range in values the bias represents.
| Bias from spatial averaging | Bias from temporal averaging | Bias from both | |
|---|---|---|---|
| Biting rate (day 1) (range 0–0.252) | −0.006 (2.4%)* | 0.099 (39.3%)* | 0.102 (40.5%)* |
| Transmission probability (%) (range 0–19.634) | 0.246 (1.3%)* | 3.069 (15.6%)* | 3.166 (16.2%)* |
4. Discussion
Laboratory derived temperature-dependent risk relationships in combination with fine resolution LST measurements lead to a better resolved understanding of mechanisms that underlie MBD risk. We are able to map traits that contribute to risk at high resolutions, including biting rates and transmission probabilities, which cannot be independently measured in the field. The variations we uncover in WNV risk over different land cover types in California's SJV create the potential for more targeted mitigation efforts and better prediction of the changing landscape of risk under climatic and land cover change. Additionally, we demonstrate the substantial bias that can arise from using these non-linear relationships on average temperatures, implying fine spatial and diurnal variation should be considered even when attempting large scale analyses. Considering all of the known relationships between temperature and risk-relevant traits, this method could allow for a detailed understanding of the temperature-driven mechanisms underlying MBD risk at a fine resolution.
Understanding when and where disease risk is high has implications for outreach and mosquito abatement efforts. For example, the varying temperatures over different agricultural fields in this study suggests that it may be advantageous to focus resources for certain types of fields, such as orchards as these presented the highest biting rates and transmission probabilities. It is unclear if similar results would be found in less heavily irrigated lands, but this method would allow such analyses to be conducted to understand localized patterns of risk anywhere high resolution LST measurements are available. Combined with understanding of other environmental drivers of MBD risk such as mosquito larva and adult habitat suitability, this method could help generate more accurate risk maps relevant for management and policy.
WNV temperature suitability maps can also be useful for predicting changes in the risk landscape under land cover change and climate change. The observation that uncultivated lands lead to higher temperatures as compared to other cropland may also suggest a potentially substantial change in the landscape of WNV risk as more land is fallowed in California in response to California's Sustainable Groundwater Management Act (Kelsey et al 2018). These higher temperatures in fallowed lands decrease risk of the traits investigated in this study, and this may or may not also be true for other traits relevant to WNV. It is also conceivable that since fallowed lands have lower risk during the current peak WNV months, increased fallowing could shift risk to earlier in the year when temperatures are generally cooler (Barker et al 2010, Hartley et al 2012). Climate change is also predicted to change the temperature profile in California, and applying the non-linear laboratory derived risk relationships to such changes allows us to investigate how changing temperatures will affect risk across the landscape and across seasons.
Access to high resolution data additionally represents new opportunities to investigate the biology of MBD. For example, finer grained understandings of temperature in time and space would allow us to better evaluate temperatures that mosquitoes truly experience through avoidance behaviors, which can be significantly different than the average landscape temperature (Danforth et al 2016). Culex tarsalis is known to have a strong dispersive capacity and can fly several kilometers in a single night (Bailey et al 1965, Verdonschot and Besse-Lototskaya 2014), which suggests that a mosquito could, in theory, take advantage of warmer urban temperatures at night while sheltering in cooler agricultural areas during the day. One might hypothesize that highly heterogeneous landscapes may therefore increase MBD risk if mosquitoes are able to find more suitable shelter in different land covers according to the time of day. Similarly, though rate summation over the diurnal cycle is commonly used to avoid biases resulting from Jensen's inequality (Lambrechts et al 2011), it may be possible that certain times of day are more important than others, depending on diurnal variations in host-seeking versus resting behavior. For example, if mosquitoes tend to seek resting sites during the day in more homogenous, cooler microclimates (e.g. in orchards or other dense vegetation), then temperature variation across the landscape at dusk when mosquitoes are seeking hosts may be more important in determining variation in risk. Lastly, high resolution temporal data may aid in studying instantaneous temperature effects on mosquito populations and behavior (Ma et al 2021, Sales et al 2021). For example, capturing the full range of diurnal variation in temperature may help characterize the frequency of heat stress events mosquitoes experience, better characterizing its effect on MBD risk today and into the future under climate change.
Even for studies focused on large scale understandings of MBD risk, considering fine spatial and temporal variability is important for accounting for Jensen's inequality when applying the deeply nonlinear temperature–trait relationships (Danforth et al 2016, Mordecai et al 2019). We show that for our study area, where average temperatures hover around the maximum for biting and transmission rates, failing to account for temporal variation leads to a substantial positive bias in risk assessment. Using fine resolution LST measurements to understand and account for the variability in time and space of temperature could therefore be valuable for coarser analyses and predictions.
Incorporated with other temperature-dependent traits, remote sensing products, and field-based techniques, high resolution LST can help contribute to a holistic understanding of WNV risk. Larval survival, fecundity, infection, and adult survival are only a few of the many traits that have been extensively studied (Mordecai et al 2019, Shocket et al 2020). Together, they allow for an integrated understanding of WNV risk that can be summarized with a single metric: R0 (Mordecai et al 2019). However, though temperature is one of the most important and most widely studied abiotic factors affecting biting and transmission rates, it is not the only or overarching determinant. In order to add relevance of this approach at the spatial and temporal scales now possible to observe, each trait must be considered along with other known contributing factors, such as the presence of standing water for larval survival and development, resting sites for adult mosquitoes, or host availability and abundance (Lothrop and Reisen 2001, Reisen et al 2008, Machault et al 2014).
There are several limitations to note, stemming from the use of laboratory-derived equations, the depence on an LST–air temperature model, and ECOSTRESS sensor. Laboratory-derived equations have several inherent limitations. For example, not all the parameterizations of these equations are equal in quality and uncertainty. Additionally, we extrapolate laboratory-derived equations to the field. While direct, field observations of biting rate and transmission probability would be highly advantageous, these traits and many others are extremely difficult, if not impossible, to measure outside a laboratory setting. We therefore apply these equations to the field even though naturally occuring phenomena such as variations in temperature over a mosquito's life cycle have not yet been studied (Mordecai et al 2019). Nevertheless, similar studies using laboratory-derived equations have found good agreement between the overall R0 and human cases (Mordecai et al 2019, Shocket et al 2020). The second source of uncertainty in our approach stems from the dependence on an LST–air temperature model. In our model, we note greater uncertainty at high air temperatures (figure S2), which is significant since these temperatures correspond to large variations in possible risk (figure 2). However, given that we average across 65 images which capture the range of the diurnal cycle, the uncertainty is greatly reduced. The reliance on an LST–air temperature relationship may, however, prove challenging in other locations where there are insufficient air temperature monitors available to calibrate the model. Establishing relationships between LST and air temperature may also be especially challenging in more heterogeneous landscapes (Vancutsem et al 2010). Applying this method to certain other locations may also be difficult since valid ECOSTRESS LSTs can only be retrieved on clear, cloudless days. Though we do not find this especially concerning for this study, as peak WNV season and the study period for this analysis spans summer months with limited cloud coverage, this may prove problematic for other potential applications of this method in areas with greater cloud cover.
Fine resolution LST measurements can thus be used to model air temperature and capture variations in space and time for the traits relevant to MBD risk. Though here we demonstrate its utility with only two such traits concerning WNV risk for the major WNV vector in California's Central Valley, ECOSTRESS is available over the entire conterminous United States (CONUS) and some other regions globally, and there are known relationships between temperature and risk for many mosquito species and MBDs. This method may help better characterize risk and lead to more informed decision making in other regions affected by MBD as they intensify and shift with warming temperatures. Future sensors that capture LST over areas with higher burden of MBD like the tropics may provide a valuable advance in the understanding and control of MBD globally.
5. Conclusion
Fine resolution LST measurements are adapted for distinguishing significant spatial and temporal changes in air temperature and its effects on epidemiologically relevant mosquito and pathogen traits. We calibrate and apply an air temperature model to ECOSTRESS images and observe fine resolution changes in temperature-dependent biting rates and WNV transmission probabilities. We resolve the diurnal air temperature cycle, as well as changes across land cover types relevant to differences in biting and transmission rates. This approach allows for estimation of traits that can only be measured in the lab, such as WNV transmission probabilities. Additionally, we find that high resolution data in both time and space captured variability in such a way to significantly avoid biases from Jensen's inequality. This method has the potential to better inform targeted mitigation practices and project the future landscape of risk not only for WNV in California's San Joaquin Valle, but for MBDs across the CONUS.
Acknowledgments
AB acknowledges support from National Science Foundation Graduate Research Fellowship (1650114), AEL acknowledges support from National Science Foundation (DEB-2042526), AJM acknowledges support from National Science Foundation and the Fogarty International Center (DEB-2011147). We are grateful to Kelly Caylor, Nakoa Farrant, Brian Lee, Sam Sambado, and three anonymous reviewers for their helpful comments. DS thanks Emily P Sousa for years of highly instructive conversations about agricultural health disparities.
Data availability statement
The data that support the findings of this study are openly available at the following URL/DOI: https://github.com/anna-boser/2021-ERL-WNV-Risk/tree/oct_26_2021.
Conflict of interest
The authors have no conflict of interest to disclose.