

Abstract
A portion of human-caused carbon dioxide emissions will stay in the atmosphere for hundreds of years, raising temperatures and sea levels globally. Most nations' emissions-reduction policies and actions do not seem to reflect this long-term threat, as collectively they point toward widespread permanent inundation of many developed areas. Using state-of-the-art new global elevation and population data, we show here that, under high emissions scenarios leading to 4 ∘C warming and a median projected 8.9 m of global mean sea level rise within a roughly 200- to 2000-year envelope, at least 50 major cities, mostly in Asia, would need to defend against globally unprecedented levels of exposure, if feasible, or face partial to near-total extant area losses. Nationally, China, India, Indonesia, and Vietnam, global leaders in recent coal plant construction, have the largest contemporary populations occupying land below projected high tide lines, alongside Bangladesh. We employ this population-based metric as a rough index for the potential exposure of the largely immovable built environment embodying cultures and economies as they exist today. Based on median sea level projections, at least one large nation on every continent but Australia and Antarctica would face exceptionally high exposure: land home to at least one-tenth and up to two-thirds of current population falling below tideline. Many small island nations are threatened with near-total loss. The high tide line could encroach above land occupied by as much as 15% of the current global population (about one billion people). By contrast, meeting the most ambitious goals of the Paris Climate Agreement will likely reduce exposure by roughly half and may avoid globally unprecedented defense requirements for any coastal megacity exceeding a contemporary population of 10 million.
Export citation and abstract BibTeX RIS
1. Introduction
Cumulative carbon emissions from human activity are projected to sustain global temperatures close to their peak increase for millennia, even if the global economy achieves net zero emissions later this century or next [1–3]. Reasons include the long half-life of carbon dioxide in the atmosphere [4]; the slow movement of heat between ocean and atmosphere [1–3]; and feedbacks that amplify and extend warming, such as albedo loss [5] and methane release from thawing permafrost [6]. Because of ice sheets' extended response to warming, sea level rise (SLR) will exhibit even greater inertia [7–9].
The cumulative emissions total shaped by global economic activity over the coming few decades may thus lock in profound long-term sea level consequences for low-lying cities and other immovable built features embodying the cultures and economies of coastal and island nations today [10, 11]. A better understanding of these different potential sea level legacies can inform and motivate climate change policies and goals for a wide range of actors including national governments and international coalitions. Here we use published relationships between cumulative carbon emissions, warming, and long-term SLR for a comprehensive global assessment of sea level threats to cities on a multi-century to multi-millennial timescale under different emissions and warming scenarios. Employing new high resolution and high accuracy datasets for coastal elevation and population density, we also assess national and global level exposures. Finally, for context, we assess exposure in 2100 under similar scenarios.
1.1. Sea level rise projections
Complex dynamic and thermodynamic processes will dominate the temporal evolution of sea level this century [12]. The millennial-scale equilibrium response to warming, however, is determined by equilibria for ocean expansion and for ice sustained in a hotter world. Both can be estimated without precise knowledge of transient states and rates of emissions, warming, or SLR, and thus also without specifying when equilibrium SLR will be achieved (see e.g. [7]).
Estimates of the long-term equilibrium sea level response to a certain amount of warming—commonly termed sea level commitment, because near-term emissions appear to irreversibly shape far-future sea level [7, 8, 10, 11, 13]—are in this respect less demanding than traditional time-dependent projections. Equilibrium estimates have accordingly proven to be relatively robust. The sea level commitment reported by the IPCC [7, 13] ('IPCC13' hereafter) was based on physical modeling of ocean thermal expansion, thermodynamic modeling of glaciers and ice caps, and ice-dynamical modeling of Greenland and Antarctica. These combined factors yield about 2.3 m of long-term SLR per 1 ∘C global warming, consistent with a wide range of paleo records [8, 14, 15], long-term projections from physical models of the components [16–19] and the newest assessment of the IPCC [20].
The dominating sea level component comes from Antarctica. The corresponding physical simulation was carried out with the PennState-3D model [17] and has been tested against paleo data [14]. The resulting estimate of roughly 1.2 m of long-term Antarctic contribution per 1 ∘C closely matches simulations with the very different Parallel Ice Sheet Model [21] and is consistent with other simulations [22–24].
IPCC13 estimated equilibrium sea level increases that occur sometime within a 2000-year envelope in response to different sustained levels of warming. Here we apply sea level projections from Strauss et al 2015 [11] ('S15' hereafter), which extends IPCC13 principally by making a direct link back to cumulative carbon emissions. Median estimates of global mean SLR range from 2.9 m of rise sometime after 1.5 ∘C of warming through 8.9 m after 4 ∘C (for more detail see table 1 headers or see table S1 of S15). We emphasize that these projections do not forecast what sea levels may unfold this century, nor do they provide timelines or time slices of rise. Nonetheless, the high tails of sea level projections in other studies—unlike S15, specifically addressing the year 2300—encompass [25–27] or nearly encompass [12, 28] the central projections assessed here, suggesting the possibility of reaching these levels relatively quickly. The latest IPCC assessment [20] argues that a global mean SLR of more than 3 m is possible up to the year 2300 even if the two degree warming limit is met (scenario SSP-2.6). For unabated climate change consistent with 4 ∘C warming (SSP-8.5), up to 7 m of SLR were considered within the likely outcomes by the same year, and SLR of up to 15 m cannot be ruled out, whereas S15 projects as much as 11 m for similar scenarios but at an unspecified time within 2000 years. Together with S15, then, these studies indicate that the principal sea levels considered in the present analysis may be realized between 200 and 2000 years from now, a timeframe we will denote as 'multi-century' or more broadly as 'long-term.'
Table 1. Percentage of population currently occupying land below high tide lines under multi-century projections based on different equilibrium warming scenarios—for the 20 most-affected large countries (total population at least 25 M) and globally. Median multi-century global mean sea-level-rise (SLR) projections are noted in parentheses next to their corresponding warming scenario headers. 'Present' denotes multi-century projections based on cumulative emissions through 2020 only, assuming no further net emissions. Countries are ranked by vulnerability in the 4 ∘C column. 66% confidence intervals are in parentheses.
| Country | 4 ∘C (8.9 m SLR) | 3 ∘C (6.4 m) | 2 ∘C (4.7 m) | 1.5 ∘C (2.9 m) | Present (1.9 m) |
|---|---|---|---|---|---|
| Global | 14 (12–15) | 12 (10–13) | 10 (7.4–12) | 7.6 (3.2–11) | 5.3 (1.8–9.6) |
| Bangladesh | 67 (60–73) | 59 (49–66) | 50 (35–60) | 37 (14–51) | 25 (6.8–46) |
| Vietnam | 64 (62–66) | 61 (56–64) | 57 (49–61) | 49 (33–57) | 42 (24–55) |
| Egypt | 39 (34–42) | 33 (24–38) | 27 (11–35) | 12 (5.8–28) | 7.1 (4.4–23) |
| Thailand | 36 (35–37) | 34 (32–36) | 32 (28–34) | 29 (17–32) | 25 (5.7–31) |
| Malaysia | 35 (32–38) | 31 (25–35) | 26 (17–31) | 18 (5.7–26) | 11 (2.7–23) |
| Philippines | 34 (32–37) | 31 (24–34) | 24 (18–31) | 18 (7.8–24) | 12 (4.8–22) |
| Japan | 34 (31–36) | 30 (27–33) | 27 (20–31) | 20 (5.0–28) | 10 (2.8–26) |
| Myanmar | 31 (28–32) | 28 (23–30) | 24 (14–28) | 14 (3.8–24) | 7.5 (2.5–21) |
| Indonesia | 24 (22–26) | 21 (18–23) | 18 (14–21) | 14 (5.1–18) | 10 (2.5–17) |
| China | 17 (16–18) | 16 (14–17) | 14 (11–16) | 11 (4.5–14) | 8.3 (2.0–13) |
| Iraq | 17 (16–18) | 15 (14–17) | 15 (13–16) | 14 (10–15) | 12 (7.8–14) |
| South Korea | 15 (13–18) | 12 (9.4–15) | 9.7 (6.6–12) | 6.7 (1.9–9.8) | 3.8 (0.86–8.7) |
| Saudi Arabia | 13 (12–14) | 11 (9.1–13) | 9.6 (5.9–12) | 6.3 (2.1–9.9) | 3.9 (0.83–8.9) |
| United Kingdom | 13 (11–15) | 11 (9.0–13) | 10 (6.9–12) | 7.5 (2.5–10) | 5.1 (1.2–9.5) |
| Argentina | 12 (10–14) | 9.5 (7.6–12) | 7.8 (3.9–9.8) | 4.6 (0.29–8.1) | 0.72 (0.08–7.1) |
| United States | 9.9 (8.0–11) | 7.9 (5.2–9.8) | 5.9 (2.4–8.4) | 2.8 (0.44–6.1) | 1.2 (0.18–5.0) |
| Brazil | 9.9 (8.4–11) | 7.9 (5.6–9.5) | 5.9 (2.8–8.1) | 3.0 (0.54–6.1) | 1.3 (0.30–4.9) |
| Spain | 9.8 (8.2–11) | 8.3 (6.0–9.9) | 6.8 (3.2–8.8) | 3.7 (0.59–7.1) | 1.6 (0.22–6.1) |
| India | 8.9 (8.0–9.7) | 7.8 (6.4–8.7) | 6.6 (4.8–7.9) | 4.9 (2.6–6.7) | 3.7 (1.6–6.1) |
| Italy | 8.9 (7.4–10) | 7.4 (5.2–8.9) | 6.0 (1.8–7.9) | 2.3 (0.60–6.3) | 0.95 (0.45–5.3) |
An important caveat is that sea-level-commitment studies do omit consideration of negative emissions technologies that, deployed at vast scales, could plausibly reduce warming over time [29–31]. Because this might in turn reduce long-term equilibrium sea level, we generally avoid the term 'commitment' here. However, negative emissions technologies are relatively underdeveloped, expensive, and unproven [31–33]. Furthermore, major SLR may become inevitable once warming destroys ice configurations restraining different glaciers and ice sheet systems from sliding into the sea—even if interventions can later reverse warming [9, 34–37].
1.2. Exposure of population and built environment
Few assessments of global population exposure to SLR and coastal flooding extend past the 21st century (see e.g. review in [38]). To our knowledge, none of these longer-term studies systematically assess cities, the largest coastal-area concentrations of built environment; and all rely on underlying global elevation datasets with multi-meter bias and/or very low consistency and precision (see [39]).
We define exposure as the current (2010) population living on land below projected high tide lines. We do not consider projected future population because of the very wide time range in our sea level projections, and because of the enormous uncertainty that would reside in any multi-century population projections. The Shared Socioeconomic Pathway spatial population-projection scenarios widely used for coastal exposure projections extend only to 2100 [40, 41].
People alive today will clearly not experience SLR on multi-century timeframes. We rather rely on contemporary population distribution as a rough proxy for the existing and largely immovable built environment that rising seas could threaten in the long run. The relationship between population and development varies widely among regions and nations according to their wealth and other factors [42], so we emphasize the percentage of population exposed within cities and nations as a threat indicator.
While we mainly employ contemporary population exposure as a proxy for exposure of the built environment and the cultural heritage it embodies, the direct human implications of this exposure are also critical, especially in light of continuing and projected population growth in coastal areas [43]. Projected sea levels imply that many millions of people will have to be defended by new infrastructure or move.
1.3. Accounting for coastal defenses
The key caveat to our multi-century exposure assessments is that current and especially future coastal defenses will offer some degree of protection. Nicholls et al [44] estimated that one-quarter of the world's coastline is currently protected by levees, while [45] found that roughly 100 million people live on land below the high tide line today, presumably mostly behind defenses. Looking forward, considerable regional to global scale research has explored the potential for defense against sea level increments that might be expected this century, generally on the order of 1 m or less (e.g. [44, 46–49]). However, there has been almost no investigation related to the multi-meter rise probable after this century ([50], and see section 4).
Because of the lack of spatially explicit global data on existing coastal defenses (to our knowledge), the long and uncertain timeframe of this study, and the speculation required to project far-future adaptation, we do not directly consider coastal protections. However, because cities are likely to be defended (see e.g. [48]), we set our analysis in this context. We define a 'critical exposure threshold' that doubles the greatest sub-sea-level population exposure faced in any global city today. We then identify cities projected to exceed this unprecedented exposure level due to long-term SLR, implying the need for unprecedented defenses, deep accommodation, or abandonment.
2. Method
2.1. Sea level projections
IPCC13 models equilibrium states for ocean thermal expansion, melting of glaciers and ice caps, mass loss from Greenland ice sheets, and mass loss from Antarctic ice sheets. Parameter values for each of these four sub-models are independently sampled and combined to develop central estimates and 66% confidence intervals (CIs) of committed global SLR under different fixed warming scenarios (1.5 ∘C–4 ∘C). To localize these projections, S15 applies spatially varying gravitational, rotational, and deformational effects to sea level as caused by mass loss from each of Greenland and Antarctica. S15 models additional scenarios based on cumulative emissions through the present or from different representative concentration pathways (RCPs) tracked over time. These models employ a distribution of values for the transient climate response to carbon emissions, a roughly linear relationship between cumulative emissions and warming on a centennial to millennial scale. For emissions-based scenarios, the 66% CIs for committed SLR factor in the distribution of transient climate responses as well as uncertainty from the IPCC13 sub-models. Here we employ localized S15 projections for both temperature-based scenarios (e.g. 2 ∘C warming) and emissions-based ones (e.g. cumulative emissions under RCP 8.5 through a given future year).
To contextualize our main analysis and to emphasize the importance of the timeframe considered, we also evaluate exposure under end-of-century sea level projections from Rasmussen et al [51] ('R18' hereafter). These are localized probabilistic projections with global coverage based on different warming scenarios through 2100. While R18 includes only 1.5 ∘C, 2 ∘C, and 2.5 ∘C warming in 2100, we here add projections for 3 ∘C and 4 ∘C for the same year and based on the same methodology. The cooler scenarios likely approximate warming levels that will remain fairly steady after 2100, but the warmer scenarios likely do not, because emissions continue longer under those scenarios. R18 incorporates both climatic and non-climatic factors, the latter including glacial isostatic adjustment and human-induced subsidence. Multi-century sea level projections in IPCC13 and S15 do not incorporate non-climatic factors.
Supplementary table 1 (available online at stacks.iop.org/ERL/16/114015/mmedia) gives global and select local sea level projections from different scenarios, models, and timeframes, as used in the current analysis. All projections use 2000 as the baseline reference year for sea level.
2.2. Exposure analysis
Over the last decade, most analyses of global exposure to SLR [38, 52] have relied on elevation data from NASA's Shuttle Radar Topography Mission (SRTM [53]), which suffers from a multi-meter mean positive vertical bias in coastal areas [39]. More recently, some efforts (e.g. [54–56]) have employed the SRTM-derived dataset MERIT DEM [57], but MERIT DEM produces underestimates of coastal population exposure very similar to those based on SRTM, as neither accounts for SRTM's averaging of rooftops with ground elevations in urban environments [45]. Here, we use CoastalDEM version 1.1 [58] at 30 m horizontal resolution, recently developed using an artificial neural network applied to SRTM and designed to reduce bias and scatter, including in developed areas. Error assessments have shown that in both the US and Australia, where high quality lidar-based bare earth elevation data are extensively available, the correlation between population density and vertical error present in SRTM has been flattened in CoastalDEM ([58], figure 2 therein). CoastalDEM produces estimates of coastal population exposure substantially closer to lidar-based 'ground-truth' assessments than either SRTM or MERIT DEM [45], likely reflecting this improved performance in high density areas. Figure 1 illustrates topography from CoastalDEM by depicting land vulnerable to select scenarios in several major metropolitan areas. Like SRTM, CoastalDEM is limited to latitudes between 60∘ N and 56∘ S. However, as roughly 99.7% of human population lives within this zone [45], we take the liberty of calling our analysis global.
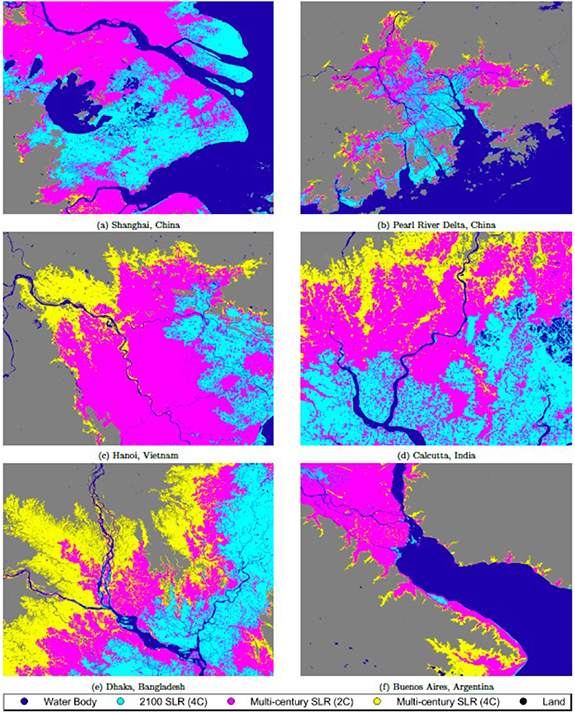
Figure 1. Inundation surfaces given central projections for sea level in 2100 (4 ∘C warming scenario) and over a multi-century timeframe (2 ∘C and 4 ∘C scenarios).
Download figure:
Standard image High-resolution imageTo develop exposure estimates for any given scenario, we employ a modified bathtub method as described in [45] to identify land lower than the projected local high tide line—a term we use to denote projected local SLR added to contemporary local mean higher high water, a defined tidal level. Exposure is further restricted to land hydrologically connected to the ocean at the projected level. We then tabulate the population inhabiting that land at local, national, and global levels, employing the high-accuracy population density dataset WorldPop [59, 60], distributed at ~100 m horizontal resolution, for the year 2010. For national and global exposure analyses, we utilize spatial data on the boundaries of the smallest administrative units available from the GADM 2.0 dataset [61] within each nation. For urban agglomerations (UAs), we directly utilize boundaries defined by the Natural Earth populated-area-boundaries dataset [62]. The bathtub method does not capture the sloping water surfaces typical during coastal floods [63, 64], but is applied here only to represent the effect of SLR.
3. Results
Unless otherwise noted, we present all results as median estimates paired with 66% CIs. We quantify these intervals exclusively on the basis of uncertainty in sea level projections.
3.1. Global exposure
Even in a hypothetical scenario with no net global emissions after 2020 (with cumulative emissions approximated at 620 GtC based on historical values and forecasts under RCP 8.5 [65, 66]), the carbon already in the atmosphere could sustain enough warming for global mean sea level to rise 1.9 (0–3.8) meters over the coming centuries. Our analysis indicates that roughly 5.3% (1.8%–9.6%) of global population, or 360 (120–650) million people, currently live on land below the corresponding new high tide lines. Multi-century SLR from carbon cuts that keep warming at the proposed upper limit of the Paris Climate Agreement, 2 ∘C, would lead to a median 4.7 m of global mean rise and threaten land now home to roughly twice as many people, while an upper confidence limit of 10.8 m of global mean SLR following 4 ∘C of sustained warming—possible under current emissions trends [67, 68]—could affect land now home to up to one billion people, or 15% of current global population, and all of the immovable built environment and cultural heritage that that implies (see top rows of table 1 and supplementary table 2 for more scenarios). In comparison, 2.5%–3.0% of people (170–200 million) currently live on global land projected to fall below the high tide line in 2100, after medians of 0.48–0.73 m of global mean SLR estimated from 1.5 ∘C to 4 ∘C warming per R18 (see top rows of supplementary tables 3 and 4 for more details).
3.2. National exposures
At the national level, East, Southeast, and South Asia face the greatest overall exposure to SLR both this century and later (figure 2). In fact, Asian countries make up nine of the top ten most at-risk large nations (total population at least 25 million), as measured by the percentage of 2010 population on threatened land corresponding to all of the long-term sea levels assessed here (table 1; supplementary table 2 ranks the most-threatened nations by total population exposure, and supplementary data 1 lists results for all nations analyzed). More broadly, across timescales, more than 75% of the global population on implicated land live in Asia, larger than the fraction inhabiting Asia overall (see supplementary tables 3 and 4 for estimated exposures in 2100). Most notably, land home to over half the populations of Bangladesh and Vietnam falls below the long-term high tide line, even if warming is limited to 2 ∘C. At the same time, every other populated continent except Australia makes the top-20 list, led respectively by Egypt, the United Kingdom, the United States, and Argentina (or Brazil, for a ranking based on total, not percentage, exposure).

Figure 2. Millions of people currently living on land vulnerable under 4 ∘C warming scenarios to (a) multi-century SLR, and (b) sea levels projected for 2100. Median projections are used.
Download figure:
Standard image High-resolution imageIn absolute terms, China has the most to gain from limiting warming, with roughly 40 million people on land that multi-century SLR threatens after 4 ∘C warming but not after 2 ∘C. Across the same warming differential, exposure drops by at least 30% for more than half of the world's coastal nations. All but ten see at least a 10% drop.
Many smaller nations, particularly islands, have much higher percentage exposure estimates than those reflected in table 1 (see supplementary data 1). Under a 4 ∘C warming scenario, the Cocos Islands, Maldives, Marshall Islands, Kiribati, Cayman Islands, Tokelau, Tuvalu, and the Bahamas each face a future with land home to  90% of their current populations below the median projected multi-century high tide line. With 2 ∘C warming, the threat still exceeds 80% for each.
Unlike these island nations, some of the countries with the most at stake are also those who have invested heavily in coal power infrastructure. Four out of the top five countries (China, India, Vietnam, and Indonesia) adding the most new coal-burning capacity in a recent 5-year period (2015–2019) [69] also fall within the top five for total exposure to long-term rise (supplementary table 2). China tops both lists by wide margins. Meanwhile, although the US has made minimal new investments, its current operating capacity ranks second globally, and it has contributed the most cumulative carbon emissions.
3.3. City-level exposures and coastal defenses
To achieve a globally consistent analysis, we quantify the exposure of UAs, contiguous areas of high population density that may cross administrative boundaries. Table 2 and supplementary tables 5–7 present different rankings and details for the top 20 most threatened 'large' UAs (total population at least one million); supplementary data 2 presents complete results for all UAs analyzed. Under median sea level projections for the 4 ∘C scenario, land home to  90% of the current population in nearly 300 UAs falls below the projected multi-century high tide line. Of these UAs of any size, only about one third are in Asia, but these include megacities (population
  10 million) such as Haora, Shanghai, Hanoi, and Dhaka. About half of UAs threatened above 90% after 4 ∘C are so threatened even after 2 ∘C.
Table 2. Percentage of population currently occupying land below high tide lines under multi-century projections based on different equilibrium warming scenarios, for the 20 most-affected large UAs (total population at least one million). 'Present' denotes multi-century sea level projections based on cumulative emissions through 2020 only, assuming no further net emissions. UAs are ranked by vulnerability in the 4 ∘C column. 66% confidence intervals are in parentheses.
| Place | Country | 4 ∘C | 3 ∘C | 2 ∘C | 1.5 ∘C | Present |
|---|---|---|---|---|---|---|
| Haora | India | 99 (95–100) | 96 (82–99) | 88 (57–97) | 64 (23–88) | 37 (12–72) |
| Shanghai | China | 96 (94–96) | 94 (89–96) | 91 (80–95) | 83 (46–91) | 70 (20–86) |
| Hanoi | Vietnam | 91 (84–93) | 85 (67–91) | 74 (44–87) | 48 (21–73) | 35 (7.2–53) |
| Dhaka | Bangladesh | 90 (81–94) | 82 (65–90) | 72 (44–84) | 50 (20–72) | 32 (11–56) |
| Calcutta | India | 85 (77–92) | 78 (63–85) | 71 (45–79) | 50 (25–70) | 37 (9.1–54) |
| Shantou | China | 75 (67–80) | 68 (54–75) | 60 (38–70) | 43 (9.1–59) | 26 (2.9–47) |
| Mumbai | India | 74 (70–76) | 71 (66–74) | 67 (60–71) | 62 (53–67) | 57 (46–63) |
| Hong Kong | China | 65 (61–68) | 61 (55–65) | 57 (47–62) | 50 (23–57) | 36 (15–52) |
| Osaka | Japan | 46 (42–50) | 42 (37–46) | 39 (17–43) | 25 (2.6–39) | 5.2 (1.6–31) |
| Tianjin | China | 43 (38–47) | 39 (31–43) | 34 (22–40) | 25 (13–34) | 17 (1.9–27) |
| Tokyo | Japan | 40 (36–43) | 36 (32–39) | 33 (24–37) | 27 (4.4–33) | 13 (1.6–29) |
| Shenzhen | China | 38 (33–41) | 34 (29–38) | 31 (24–35) | 25 (12–30) | 19 (6.2–27) |
| Karachi | Pakistan | 34 (29–36) | 30 (22–34) | 25 (14–31) | 17 (5.0–25) | 10 (2.3–19) |
| Jakarta | Indonesia | 30 (27–33) | 27 (23–30) | 25 (19–28) | 20 (8.8–24) | 15 (3.9–22) |
| Surabaya | Indonesia | 29 (26–32) | 27 (24–29) | 25 (21–27) | 22 (9.3–25) | 17 (4.2–23) |
| New York | United States | 28 (16–37) | 19 (8.9–30) | 13 (5.0–23) | 6.7 (2.0–14) | 3.7 (1.00–8.2) |
| Quezon City | Philippines | 26 (21–30) | 21 (12–26) | 14 (6.9–23) | 8.3 (2.8–13) | 3.6 (2.0–9.9) |
| Buenos Aires | Argentina | 25 (20–29) | 20 (15–25) | 17 (6.3–21) | 9.3 (0.03–16) | 0.11 (0.02–12) |
| Seoul | South Korea | 17 (10–23) | 11 (7.1–16) | 8.0 (4.3–12) | 5.3 (1.5–7.9) | 2.9 (0.71–6.1) |
| Rajshahi | Bangladesh | 16 (3.9–36) | 4.9 (0.11–16) | 0.57 (0.01–6.6) | 0.02 (0.01–0.45) | 0.01 (0.01–0.03) |
| Cairo | Egypt | 9.1 (3.7–17) | 4.6 (0.41–9.6) | 1.5 (0.00–5.9) | 0.12 (0.00–1.4) | 0.00 (0.00–0.22) |
Many cities already include areas below the high tide line. Based on the elevation data, sea surface height, and tidal data employed here (see [45]), we identify 197 UAs globally where more than 10 000 people live below mean higher high water (see supplementary data 2), likely defended by existing infrastructure.
To develop a baseline that reflects the greatest sea level exposures that cities cope with today, we characterize the very lowest-lying contemporary urban development. Among UAs with at least 100 000 total inhabitants, none has more than a quarter of its population on land lower than 2 m below the high tide line (−2 m; see supplementary data 3). Accordingly, we use unprecedented 25% exposure below −2 m as one marker of future danger, and 50% as a more conservative and emphatic critical exposure threshold—more than double the worst circumstance of today, and thus never previously defended against. Even where defenses may be physically feasible at this level, their failure would result in rapid flooding to dangerous depths well above average human height during high tide or, especially, water-raising storms.
Figure 3 maps large UAs with at least 50% of current population below the future −2 m line from median long-term sea level projections under 2 ∘C and 4 ∘C scenarios. The implicated large UAs for these cases total 32 (4–53) and 73 (50–83) respectively, and concentrate heavily in Asia. Only 9 (0–30) large UAs meet these criteria under 1.5 ∘C warming. For agglomerations of any size, 224 (32–436) match the −2 m/50% criteria under the 2 ∘C scenario, compared to 556 (363–678) for 4 ∘C. Using a 25% cut-off, central estimates of all these metrics increase roughly by half to more than doubling. Supplementary data 3 presents complete exposure assessments below −2 m in global UAs affected to any degree; supplementary tables 8 and 9 rank the 20 most threatened large UAs.

Figure 3. Large urban agglomerations (population  1 M) with at least half of current population on land at least 2 m below high tide line under median multi-century SLR projections for 2 ∘C (red) and 4 ∘C (blue) warming scenarios.
Download figure:
Standard image High-resolution imageConceptually following [11, 70], we also identify and quantify the UAs set on paths to one day fall below the −2 m/50% threshold as a function of RCP scenario and year, and thus cumulative emissions, allowing progressive estimation of multi-century SLR, even if emissions suddenly cease after each year considered (figure 4 and supplementary data 4). These 'cumulative emissions years' can be considered as metaphorical deadlines for preventing SLR above critical thresholds for different cities under different scenarios. While only 18 (0–80) UAs of any size are set on course by 2020 toward a future −2 m/50% destination, the total rises to 444 (206–611) by century's end under RCP 8.5, versus 98 (13–326) under RCP 4.5—a more-than-fourfold difference. By 2100, eight megacities are set in motion toward −2 m/50% under RCP 8.5, vs. just Mumbai and Shanghai under RCP 4.5, and none under RCP 2.6, according to central estimates (figure 4(c)). Most of these figures double or more using a 25% threshold (supplementary data 4), adding megacities that include Tokyo and Jakarta—and New York and Buenos Aires in the tails.

Figure 4. Urban agglomerations (UAs) critically exposed by long-term SLR based on carbon emissions through 2100. The critical exposure threshold is defined as at least half of each UA's current population living on land at least 2 m below the local high tide line under median multi-century SLR projections stemming from cumulative carbon emissions through the years indicated. Shaded areas (a), (b) and bars (c) reflect 66% CIs of projections. 'Small urban agglomerations' (a) refer to UAs with total population below 1 million, 'large urban agglomerations' (b) 1–10 million, and 'megacities' (c) over 10 million. Select UAs are labeled in (b) for purposes of illustration; unlabeled dots share labels with the dots horizontally to their left. Panel (c) includes only megacities whose central critical threshold year falls between 2020 and 2100.
Download figure:
Standard image High-resolution image
4. Discussion
This analysis assumes that global emissions do not become negative. Massive-scale carbon drawdown could reduce long-term SLR and the exposure assessments made here. However, our analysis also assumes that no major ice sheet system has yet started an unstoppable collapse. If a runaway West Antarctic Ice Sheet breakdown has already begun (see e.g. observations in [37]), all projections of multi-century sea levels would be higher than those reported and analyzed here, e.g. globally running roughly 1 m (21%) higher in the 2 ∘C scenario and 0.5 m (6%) higher in the 4 ∘C scenario [11].
Due to the long and uncertain timeframes of the sea level projections detailed here, this study cannot incorporate various time-dependent processes that may impact future coastal vulnerability. These include coastal morphology evolution (e.g. erosion and wetland migration) and changing tidal dynamics. For the same reason and because our focus is on the threat to built heritage as it exists today, we consider neither population change nor human migration. Many vulnerable small islands are surrounded by coral reefs whose vertical growth with SLR could afford some measure of protection, but warming, ocean acidification, and other forms of ecological degradation endanger this possibility (see e.g. [71]).
Elevation data present another source of error. CoastalDEM (RMSE: 2.4 m) improves on but is derived from SRTM (RMSE: 5.4 m), and a degree of spatially autocorrelated vertical error persists. Such error may be caused by certain types of land cover [72, 73] or large striping artifacts from satellite/instrument misalignment [74], and most affects exposure estimates at smaller spatial scales [45].
These potential issues may be mitigated by the high sea levels assessed in this analysis. At global scale, coastal populations appear most heavily concentrated at low elevations, with an estimated 770 M people on land less than 5 m above high tide line, compared to 230 M people at 5–10 m above it [45]. This gradient suggests the sensitivity of population exposure to elevation error is small for most water levels considered here, mostly near or above 5 m. Furthermore, our smaller-spatial-scale analyses of UAs are focused on land more than 2 m below projection high tide lines, reducing the chance of overestimating vulnerability—though increasing the risk of underestimating it.
Despite the potential for errors deriving from CoastalDEM, results here are consistent with those presented in a US-focused study [11] that employed highly accurate lidar-derived elevation data, along with high-resolution population data from the 2010 US Census. In that assessment, an estimated 19 (12–25) million people live on land projected to fall below the long-term future high tide line set in motion under a 2 ∘C warming scenario, 24 (18–29) million under 3 ∘C, and 30 (25–34) million under 4 ∘C. In comparison, this analysis, employing lower-quality global elevation and population data for the US, estimates 18 (7.5–26) million, 24 (16–30) million, and 30 (25–35) million, respectively, reflecting almost no difference for central estimates. Since CoastalDEM's neural network model was trained using the same US lidar elevation data, similar experiments elsewhere might produce less favorable results.
Finally, our analysis does not directly consider any present nor future artificial coastal defenses, an issue of special importance for dense urban areas, where such investments are most likely to occur. National and global results reflect potential threats to coastal built environments assuming no new defenses, whereas our analysis of UA vulnerability does put exposure into the context of potential protection. The major multi-meter SLR projected under most scenarios suggests that large areas would require globally unprecedented defenses, if defense were feasible.
To our knowledge, almost no research has explored adaptation to the levels that may be needed. The Atlantis project provides the main exception, evaluating potential adaptation in three vulnerable areas in Europe after a 5–6 m rise by conducting interviews and structured exercises with dozens of local experts in each setting [75–77]. Participants generally concluded that affected areas in the little-developed Rhone delta in southern France would be abandoned, and that a blend of protection, Venice-like accommodation, and retreat would be applied for the Thames estuary including London. Most saliently, the experts forecast large-scale abandonment of affected areas in the Rhine delta, probably including the cities of Amsterdam and Rotterdam, after initial attempts at defense. Importantly, the study assumed that 5 m of rise would be quickly attained by 2130. Participants felt that the Netherlands could be defended in theory, but that the measures needed would be too rapid and expensive in the scenario considered. In any timeframe, such a defensive feat would require artificially pumping the full flow of the Rhine River over defenses and out to sea, among other steps.
Extreme measures may accordingly be possible for defense against the likely more gradual long-term sea level increases contemplated here, up to about 13 m locally in the worst case (see supplementary table 1). However, many factors must temper such optimism. Defenses will be costly, and population exposure at these levels is greatest by far in regions less wealthy than the Netherlands or the United Kingdom [45]. Unlike the case of the Netherlands, large fractions of most developed coastal areas were not originally built up from below sea level, suggesting that many built environment layouts may not easily accommodate the addition of levees or other defenses. The spatial details of each affected city and region will be important, and large-scale studies on coastal adaptation have not considered the conflict between existing infrastructure and the siting of potential protective features (e.g. [44, 46, 47]).
Another approach to assessing the feasibility of adaptation to multi-meter SLR is to study cities which have already experienced multi-meter subsidence. The most dramatic examples are Tokyo and Jakarta [78, 79], which have experienced close to 5 m of subsidence, albeit in limited neighborhoods [80, 81]. Some areas in each city are now below mean sea level. Wealthier Tokyo has implemented progressively more robust measures, culminating in super-levees 30 times wider than high. So far, these are limited in extent due to the cost of demolishing structures in the way, raising the levees, and rebuilding on top of them [79, 82]. Measures taken in Jakarta have been far more limited, and in 2019, the president of Indonesia announced that the nation's capital would abandon Jakarta for higher ground [82].
Even monumental adaptation measures will not be able to eliminate all concerns. Some rivers would need to be walled off from the sea and fully pumped into it, with consequences for ecology, ports, trade, and more. Citizens living inside the deep bowls of protected areas would need to agree to live with the risk of catastrophic and near-instant floods in the event of levee or pump failures, whether from natural causes, human error, or terrorist or wartime attacks. The deaths and damage from Hurricane Katrina in New Orleans and the 1953 North Sea floods in the Netherlands both illustrate the danger of living behind defenses while below sea level.
Nonetheless, the degree to which cities will be able to defend themselves against multi-meter SLR, given time, remains a core issue for interpretation of the threats presented here. Further research on the potential for defense against multi-meter rise, and on the potential spatial conflicts between new defenses and extant infrastructure, would both be valuable contributions to the coastal adaptation literature.
5. Conclusion
The greatest differences in the sea level consequences among emissions pathways that lead to 1.5 or 2 ∘C warming vs. 3 ∘C or 4 ∘C warming will take centuries to unfold but will be determined in the coming few decades. Higher levels of warming will require globally unprecedented defenses or abandonment in scores of major coastal cities worldwide, whereas the count could be limited to a relative handful through strong compliance with the Paris Agreement, especially limiting warming to 1.5 ∘C. Threats are global but concentrated in Asia, where megacity futures hang in the balance, and four of the top five global nations building the most new coal capacity are four of the five most endangered. Results suggest that a sharp reduction in carbon emissions is in the national interest of all coastal nations. Even if this outcome is achieved, major adaptation efforts around the world will be required to protect coastal populations over time, as well as to preserve extensive areas of built environment as it exists today, and all the cultural heritage it embodies.
Acknowledgments
Benjamin Strauss and Scott Kulp were supported by the Kresge Foundation and by NSF Grant No. ICER-1663807 and NASA Grant No. 80NSSC17K0698. D J Rasmussen was grateful for support from the Science, Technology, and Environmental Policy Program at the Princeton School of Public and International Affairs at Princeton University.
Data availability statement
The data that support the findings of this study are available upon reasonable request from the authors.