

Abstract
In their recent contribution, Scully et al (2021 Environ. Res. Lett. 16 043001) review and revise past life cycle assessments of corn-grain ethanol's carbon (C) intensity to suggest that a current 'central best estimate' is considerably less than all prior estimates. Their conclusion emerges from selection and recombination of sector-specific greenhouse gas emission predictions from disparate studies in a way that disproportionately favors small values and optimistic assumptions without rigorous justification nor empirical support. Their revisions most profoundly reduce predicted land use change (LUC) emissions, for which they propose a central estimate that is roughly half the smallest comparable value they review (figure 1). This LUC estimate represents the midpoint of (a) values retained after filtering the predictions of past studies based on a set of unfounded criteria; and (b) a new estimate they generate for domestic (i.e. U.S.) LUC emissions. The filter the authors apply endorses a singular means of LUC assessment which they assert as the 'best practice' despite a recent unacknowledged review (Malins et al 2020 J. Clean. Prod. 258 120716) that shows this method almost certainly underestimates LUC. Moreover, their domestic C intensity estimate surprisingly suggests that cropland expansion newly sequesters soil C, counter to ecological theory and empirical evidence. These issues, among others, prove to grossly underestimate the C intensity of corn-grain ethanol and mischaracterize the state of our science at the risk of perversely affecting policy outcomes.
Export citation and abstract BibTeX RIS
1. Introduction
The carbon intensity (CI) of corn grain ethanol has long been assessed and debated due, in part, to its inherent uncertainty and its regulatory implications for policies like the U.S. Renewable Fuel Standard (RFS) and the California Low-Carbon Fuel Standard [1–7]. The CI of corn ethanol represents the estimated life cycle greenhouse gas (GHG) emissions associated with burning a unit of ethanol as fuel. It additively accounts for emissions and offsets associated with all aspects of ethanol use and production, including those associated with on-farm biofuel feedstock production and any direct and indirect land use change (LUC) that results from feedstock demand. In their recent review, Scully et al [8] select and revise past emissions estimates for each of these components and combine them into an aggregated value they present as a 'central best estimate' of U.S. ethanol's total CI. Yet, their proposed value proves to be considerably smaller than all prior estimates, an outcome that primarily results from their profoundly reduced estimate of LUC emissions (figure 1).
Emissions from LUC have persistently been one of the most uncertain elements of ethanol's GHG profile [5, 6, 9]; their estimation requires that the patterns of LUC be predicted or observed and compared to the predictions of a counterfactual scenario representing expected outcomes absent bioenergy policy. To date, this has largely been accomplished using partial or computable general equilibrium models (hereafter 'P/CGEs') which simulate part or all of the global economy, respectively, to predict LUC in the presence and absence of bioenergy policy. In their review of LUC estimates, Scully et al exclusively consider P/CGE predictions and endeavor to identify those which are 'best'. However, they dismiss that variation among past predictions reflects the vetted diversity of relevant thought by asserting a single method they favor and rejecting all non-compliant predictions. We contend that impartial valuation of past predictions instead necessitates a rigorously objective, empirical basis. To do less is to merely add to the existing diversity of opinion.
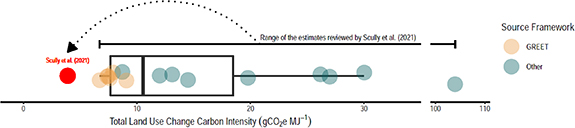
Figure 1. Boxplot showing the total (i.e. international + domestic) land use change carbon intensity estimates of all the studies initially considered by Scully et al, as well as the much lower estimate they advance after reviewing these studies. These values were taken from figure 2 of Scully et al. When a study reported parsed international and domestic estimates, we combined them into a single 'total' estimate when possible and excluded estimates from which a total estimate could not be obtained (n = 11 of 26). Predictions are colored to illustrate the disproportionate representation of GREET-based estimates (this includes studies authored by primary GREET developers and the so-called 'USDA 2018' study which also uses GREET). The width of the box represents the interquartile range of the 15 estimates, their median is denoted by the vertical middle line, and their 95th percentile range is shown as the affixed whiskers. The full range of the estimates reviewed is indicated by the bracket above the boxplot. Points have been randomly jittered vertically to enable visualization of overlapping data points.
Download figure:
Standard image High-resolution image2. Unjustified selection of past LUC estimates
Scully et al present a set of P/CGE-based LUC estimates and then assert as justification for selective consideration that 'variability among the[se] LUC estimates stem primarily from differences in the four major elements that comprise these [carbon intensity] values: the agro-economic model, economic data year, yield price elasticity, and land intensification.' Despite offering no statistical evidence that these four criteria are the primary determinants of variability (see supplemental discussion 1 available online at stacks.iop.org/ERL/16/118001/mmedia), they operationalize them as selection criteria they call 'best practices' and use them to reject non-compliant studies from further consideration. For each practice, they state a modeling configuration that they believe to be optimal—though they offer no rigorous scientific basis for these choices (see supplemental discussion 2)—and then they assess studies' binary compliance with each. Accordingly, they require that LUC predictions be generated using (a) the GTAP-BIO CGE model, with (b) an economic data year of 2004, (c) a yield price elasticity between 0.175 and 0.325, and (d) include additional treatment of 'land intensification'. These requirements distill to an unsubstantiated endorsement of a singular treatment of cropping-intensification in ethanol life cycle assessment (LCA); one that was explicitly discussed in an unacknowledged review by Malins et al [10] that showed it almost certainly underestimates LUC by overestimating agriculture's capacity to intensify production on existing cropland (see supplemental discussion 2).
When applied to the studies Scully et al initially consider, these criteria systematically eliminate those reporting all but the smallest LUC emissions without adequate justification (see supplementary discussion 2). Requiring use of GTAP is a necessary precondition of the subsequent criteria; requiring 2004 as the economic data year arbitrarily mandates use of outdated data [11] and specifically dismisses GTAP studies reporting high LUC estimates; and requiring explicit treatment of 'land intensification' in addition to a relatively high yield price elasticity that implicitly accounts for some of the same process [12] likely double-counts intensification responses to bioenergy demand and thus underestimates rates of LUC [10]. Ultimately, select elements of just two of the 16 studies Scully et al initially reviewed comply with these criteria: (a) the smallest of the four total-LUC prediction reported by Taheripour et al [11]; and (b) one domestic and two international LUC predictions reported in the ICF report that Scully et al most consistently reference as Rosenfeld et al [13], and which are simply the LUC results from one of the two corn feedstock scenarios ('Corn Ethanol 2013') provided in the Argonne National Laboratory's GREET LCA model. Notably, Taheripour et al repeatedly describe the value selected from their study as a heuristic based on outdated data and do not endorsed it [11]; instead, they endorse a larger value that Scully et al reject for its use of a more recent economic data year. Likewise, Scully et al's retention of just one GREET scenario also appears to be a specific and unsubstantiated endorsement of that which predicts the lowest LUC emissions.
3. A new, self-calculated and unrealistic estimate of domestic LUC emissions
In addition to their use of these selection criteria, Scully et al also generate their own domestic LUC emissions estimate using the Carbon Calculator for Land Use Change from Biofuels Production (CCLUB)—the LUC emissions accounting framework in GREET [14]—which oddly predicts that gross domestic cropland expansion results in soil C sequestration. This prediction is particularly curious because soil C is generally lost upon converting perennial vegetation to annual cropland regardless of the land use history or subsequent tillage regime [15–21] and U.S. cropland is no exception. More broadly, the authors' inclusion of a self-calculated data-point is also surprising for a self-described 'review' and is accompanied by little explanation nor any validation (see supplementary discussion 3).
We recreated the CCLUB configuration used by Scully et al and found that they only report the most anomalous prediction generated for the management assumptions they adopt (figure 2). CCLUB allows users to pick from two corn-specific LUC scenarios that predict the extent of LUC resulting from bioenergy demand, and three distinct sets of emissions factors (EFs)—the so called 'Winrock,' 'Woods Hole,' and (for domestic LUC only) 'CENTURY/COLE' (hereafter 'CENTURY-based') EFs—that represent the expected loss or gain of ecosystem C stocks per unit area following LUC. While CCLUB asks users to select a set of EFs, the results of all three are reported side-by-side in the model output. Only when the CENTURY-based EFs are used with the 'Corn Ethanol 2013' scenario—the authors' specification—does CCLUB predict net C sequestration from domestic LUC (figure 2).

Figure 2. Varied carbon intensity of land use change estimates resulting from CCLUB's two corn ethanol feedstock scenarios ('2011' and '2013') and its three emission factor (EF) options ('Winrock', 'Woods Hole', and 'CENTURY/COLE'), all else being equal to the specifications used by Scully et al. Positive and negative values indicate emissions and sequestration, respectively. The emission/sequestration contribution of each land source is parsed by color and the net effect is noted as a horizontal black line. The Woods Hole EFs do not include an estimate for cropland-pasture conversion (CCLUB simply omits these emissions without warning) so we show the net effect of adding either the corresponding Winrock or CENTURY/COLE-based cropland-pasture estimate as dashed horizontal lines. Of the six comparable estimates, Scully et al choose the only one that suggests sequestration, without acknowledging the others nor the relative dissimilarity of their choice.
Download figure:
Standard image High-resolution imageThe Corn Ethanol 2013 feedstock scenario used by Scully et al predicts that 'cropland-pasture' comprises the vast majority (1.7 M ha; 92%) of land converted from non-use to corn production and it is cropland-pasture conversion in particular for which the CENTURY-based EFs invariably predict sequestration (figure 2). While CCLUB does not explicitly identify the lands it presumes cropland-pasture to encompass, it inherits the ambiguous class from GTAP which defines it as land 'in long-term crop rotation which is marginal for crop uses' [22] following the USDA's definition for it as land that is 'routinely rotated between crop and pasture use... and may remain in pasture indefinitely' [23]. Cropland-pasture is therefore, by definition, land that has been removed from annual cultivation for some indeterminate time.
Yet, the treatment of cropland-pasture underlying the CENTURY-based EFs instead assumes that it has been cultivated for 25 years prior to its conversion to corn production. Unlike the other two sets of EFs, which are based on summaries of empirical data, the CENTURY-based EFs are based on the predictions of a biophysical model—a variant of the popular CENTURY model—that simulates soil organic carbon (SOC) stocks and their responses to LUCs. The EF's reported in CCLUB represent the average annual SOC changes (losses or gains) ensuing from these simulated transitions and are reported for each U.S. county. Like most biophysical models, CENTURY requires that SOC stocks be 'spun-up'—a necessary technical procedure that predicts baseline SOC stocks based on a prescribed land use history. For their spin-up of cropland-pasture, the CCLUB developers prescribed a proximate history of '50 years as cropland followed by 25 years of pasture and 25 years of cropland' [24].
By simulating the most recent 25 years of cropland-pasture as cropland, this treatment, effectively pre-depletes the simulated baseline SOC stocks such that when cropland-pasture is subsequently converted to corn production in the model, its SOC is predicted to respond similar to converting generic 'cropland' to corn production (figures 3 and S1). Indeed, the CENTURY-based EFs for cropland-pasture and cropland conversion are statistically indistinguishable when effects are considered to a maximum depth of 30 cm, and only slightly distinct when considered to a greater depth of 100 cm (mean < 0.04 MgC ha−1 yr−1; α = 0.05; table S1). For both cropland-pasture and cropland, the CENTURY-based EFs oddly predict that their conversion sequesters SOC regardless of the accompanying tillage and yield assumptions (figure S1, table S1). While a meta-analysis of empirical studies by the CCLUB developers and others suggests that crop rotations containing corn may sequester small amounts of C over time [20], it does not show this in the context of LUCs like cropland-pasture conversions to corn, nor even when generic cropland on which corn is rotated with other crops is converted to a continuous corn rotation [25]. Moreover, while there exists tremendous variance among observed responses [20], CCLUB's county-level CENTURY-based EFs for conversion of cropland and cropland-pasture to corn exhibit little variance and similar rates of C sequestration in virtually all U.S. counties (figures 3 and S1).
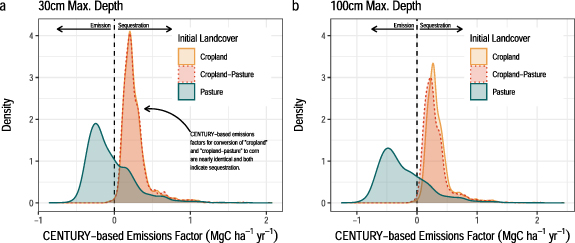
Figure 3. Density distributions of CCLUB's CENTURY-based county-level soil C emissions factors (EFs) for conversion of cropland, cropland-pasture, and pasture to corn production under one of CCLUBs tillage/yield scenarios (plots for all 16 tillage/yield scenarios are included as figure S1 and all show the same general pattern). CCLUB provides two estimates for each tillage/yield scenario: one considering effects to a maximum soil depth of 30 cm (left) and the other to 100 cm (right). Due to the similar way in which their initial SOC stocks are spun-up, EFs for cropland-pasture and cropland conversions are remarkably similar to each other yet distinct in both sign and magnitude from those of pasture (i.e. grasslands). When considered to a depth of 30 cm, cropland and cropland-pasture EFs are statistically the same (table S1) and, visually, their distributions directly overlap; when considered to a depth of 100 cm, they are statistically-distinct, but both still report that significant rates of C sequestration ensue from LUC.
Download figure:
Standard image High-resolution image
To our knowledge, there exists no empirical evidence supporting the proposition that cropland-pasture conversion to corn production generally enhances SOC stocks. While the breadth and ambiguity of cropland-pasture's definition admittedly confounds direct comparison with empirical studies, land leaving the Conservation Reserve Program (CRP)—a U.S. federal program that retires land from production for the duration of at least one 10 or 15 year contract—for one, falls within the functional purview of cropland-pasture and has been estimated to account for ∼30% of RFS caused domestic LUC [26]. Field studies assessing SOC changes after recultivation of CRP lands consistently report either net emissions or indeterminant change [19, 27–31], with estimated SOC losses as high as 154 MgCO2e ha−1 when CRP land is converted to a corn-soy rotation managed with conventional tillage [29]. Conversion to no-till management results in lower but still substantial GHG costs [19]. We know of no studies reporting net gains. These emissions reflect the tendency of abandoned croplands to recover SOC to varying degrees during their retirement that can later be lost if re-cultivated [16, 32–40].
Had Scully et al instead or further considered CCLUB's Winrock-based estimate, they would have reported a less optimistic CI estimate for domestic LUC of +8.7 gCO2e MJ−1 (figure 2)—a value more in line with many of the estimates they dismissed, and a contemporaneous study in Environmental Research Letters [41]. The Winrock EFs calculate cropland-pasture emissions as simply one-half the estimate generated using the corresponding pasture/grassland EFs. Despite its simplicity, this approach may more accurately represent the C dynamics of cropland-pasture conversion by implicitly assuming higher levels of vulnerable SOC upon initiation of corn cropping. Adding this Winrock-based estimate, for the sake of example, to Scully et al 's international LUC estimate (6.0 gCO2e MJ−1)—which, itself, is likely an underestimate given the selection criteria by which it was obtained—yields an estimated total-LUC C intensity of 14.7 gCO2e MJ−1; a value nearly four-times larger than the total-LUC value proposed by Scully et al as a 'central best estimate' and comparable to the raw median of estimates they initially reviewed (figure 1).
Scully et al recommend that, 'future studies conduct a thorough review of the various EFs to assess the validity of their assumptions and functions'. We reaffirm this recommendation but add that, in the absence of such an assessment, reporting the range of possible outcomes ought to be considered the minimum reporting standard.
4. Misconstruing the state of the science
Scully et al's 'central best estimate' of total-LUC emissions is less than even the smallest such estimate they initially reviewed (figure 1). This statistical feat is only possible because they first, when able, parse the domestic and international estimates of studies and then treat them as being entirely independent when subjecting them to the aforementioned selection routine that rejects nearly all but the smallest estimates of each. They then calculate a 'credible range' of total-LUC estimates by combining the smallest disparate domestic and international estimates to define the lower bound of their range (−1 gCO2e MJ−1), and by defining its upper bound as the retained estimate of Taheripour et al [11] (8.7 gCO2e MJ−1), which is the largest possible value compliant with their selection criteria. The value they present as a 'central best estimate' is the midpoint of this range (3.85 gCO2e MJ−1) and is less than half the estimate of Taheripour et al—the smallest peer-reviewed total-LUC estimate the authors initially reviewed—though, again, Taheripour et al expressly renounced this estimate as outdated and instead favor a larger value [11].
The more general approach used by Scully et al and some of the non-peer-reviewed analyses they consider [13, 42] of deconstructing and recombining elements of disparate LCAs belies the scientific intent of LCA and may ultimately miscount emissions. LCA is, by its nature, an integrated science in which the assumptions underlying system elements and boundaries are to be treated consistently throughout. When LCAs are instead deconstructed and recombined, assumptions can get lost or conflict among recombinant elements. Scully et al, for example, assume a large degree of cropping intensification in their treatment of LUC, which presumably requires additional fertilizer and amendments that would increase emissions from the 'farming' sector. Yet, because they determine farming emissions separately as the mean of a GREET-based estimate and their own revisions to ecoinvent, their estimate does not appear to account for these additional intensification emissions. In fact, Scully et al laud GREET's recently reduced estimates of fertilizer usage, and they, themselves, revise downward ecoinvent's relatively high emissions estimate for irrigation based on their own unpresented analysis of USDA-reported water use trends. These revisions appear to diminish the chance that their farming estimate even coincidentally captures some of the emissions from the intensification they implicitly assume. Moreover, since their LUC prediction is itself the mean of four disparate predictions from two studies and their own self-calculated value—each with distinct assumptions—it is not clear how one would even determine the precise acreage or type of intensification assumed. To avoid these ambiguities and maintain coherence, earnest LCA as a discipline has increasingly embraced sensitivity and uncertainty analyses, rather than piecemeal selection, as a means of better understanding—rather than erasing—variance [5, 43, 44].
Scully et al provide neither a comprehensive nor an impartial review. As we have shown, well-established concerns are not acknowledged nor discussed. Instead, assertions are made either without support or are ostensibly supported by unvetted analyses. When discussing LUC in the U.S., for example, they cite a single, second-hand account of a non-peer-reviewed conference presentation to claim that 'agricultural land area declined by 38 million acres [between 2002–2017]' [45]. Yet, using those same USDA data, Lark et al [46] showed instead that cropland underwent a net expansion after implementation of the expanded RFS in 2007 by as much as 13.9 M acres (between 2007 and 2017; see supplemental note 2 and table S7 in [46]). Moreover, Lark et al [46] further corroborated their findings with three independent data sources and ultimately favored a smaller net estimate of 6.5 M acres between 2009 and 2016. Separate peer-reviewed studies have estimated similar recent rates of net expansion using a range of data sources [26, 47–50] as has a comprehensive review of biofuel-relevant LUC by the US Environmental Protection Agency [51], yet none of these antithetical studies are acknowledged by Scully et al.
In all, the C intensity estimate of Scully et al for corn-grain ethanol is hardly credible. It is based on a flawed assessment that systematically disqualifies high estimates without cause, a new self-calculated estimate that contradicts empirical observation, and an inconsistent general methodology that belies the science it seeks to emulate. While we do not claim to know the true C intensity of corn ethanol, we strongly assert that the estimate of Scully et al should not be interpreted as such. It grossly mischaracterizes the land system, our means of understanding it, and, ultimately, the state of our science. In so doing, it has the potential to spawn perverse policy outcomes by attributing far greater climate benefits to the production and use of corn grain ethanol than can be supported by current evidence.
Acknowledgments
Financial support was provided by a National Science Foundation Graduate Research Fellowship under Grant No. DGE-1747503 to SAS, and by the Great Lakes Bioenergy Research Center, U.S. Department of Energy, Office of Science, Office of Biological and Environmental Research (Award DE-SC0018409). Any opinions, findings, and conclusions or recommendations expressed in this material are those of the authors and do not necessarily reflect the views of the National Science Foundation. We are grateful to Luoye Chen, John Field, Rich Plevin, and Stephanie Searle for feedback and suggestions that greatly improved our manuscript.
Data and code availability
Code and data associated with all figures and analyses presented are freely accessible through GitHub (https://github.com/sethspawn/erl_response_2021.git). Data presented in our figures 1 and S2 were taken directly from figure 2 and table S1 in Scully et al [8] and can be viewed in the file 'data_from_scully_figure 2.csv' in our GitHub repository. Data presented in our figures 2, 3, S1, S3 and table S1 were generated using the 'CCLUB_2020_for_GREET1_2020.xlsm' file included with the 2020 version of the GREET Excel Fuel-Cycle model [52] as described in the text. Data used in our analysis of CCLUB's CENTURY-based emission factors were taken directly from the 'C-Database' sheet of GREET's 'CCLUB_2020_for_GREET1_2020.xlsm' file.
Conflicts of interest
The authors declare no conflicts of interest.